
Figures marked "CSIRO", are copyright CSIRO, but please feel free to use them, conditional on the figures not being altered, and their source being acknowledged, and with a link to this site where possible. All other figures are copyright. Please do not copy without the owner's permission.
|
IPCC AR4 sea-level projections - an updateProjections for global averaged sea-level change for the Intergovernmental Panel on Climate Change Fourth Assessment Report (IPCC AR4) were based on global climate model simulations completed as part of an internationally organized set of climate simulations called CMIP-3. For the twentieth century, the models used observed changes in greenhouse gas concentrations and other climatic forcings while, for the twenty-first century, they used greenhouse-gas emissions from the IPCC Special Report on Emission Scenarios (SRES). The sea-level projections (see the figures and tables below) include changes in ocean heat content and thus ocean thermal expansion, changes in glacier mass, surface mass balance changes for the ice sheets and changes in ice-sheet flow. Recognising that land ice contributions did not adequately take account of dynamic ice-sheet processes, Meehl et al. (2007) calculated an additional "scaled-up ice sheet discharge" term as an estimate of possible contributions from a dynamic response of the large Ice Sheets of Greenland and Antarctica. The effect of this term is also shown in the figure below. It should be noted that there is no firm theoretical or observational basis for this scaled-up ice sheetdischarge. The AR4 explicitly states that larger rises cannot be excluded and its projections for sea-level rise do not give a best estimate or an upper bound. Note that since publication of the AR4, Pfeffer et al. (2008) have argued that a rise in excess of 2 metres is "physically untenable," and that a maximum rise of 0.8 metres (near the upper end of the IPCC AR4 projections) is more plausible.
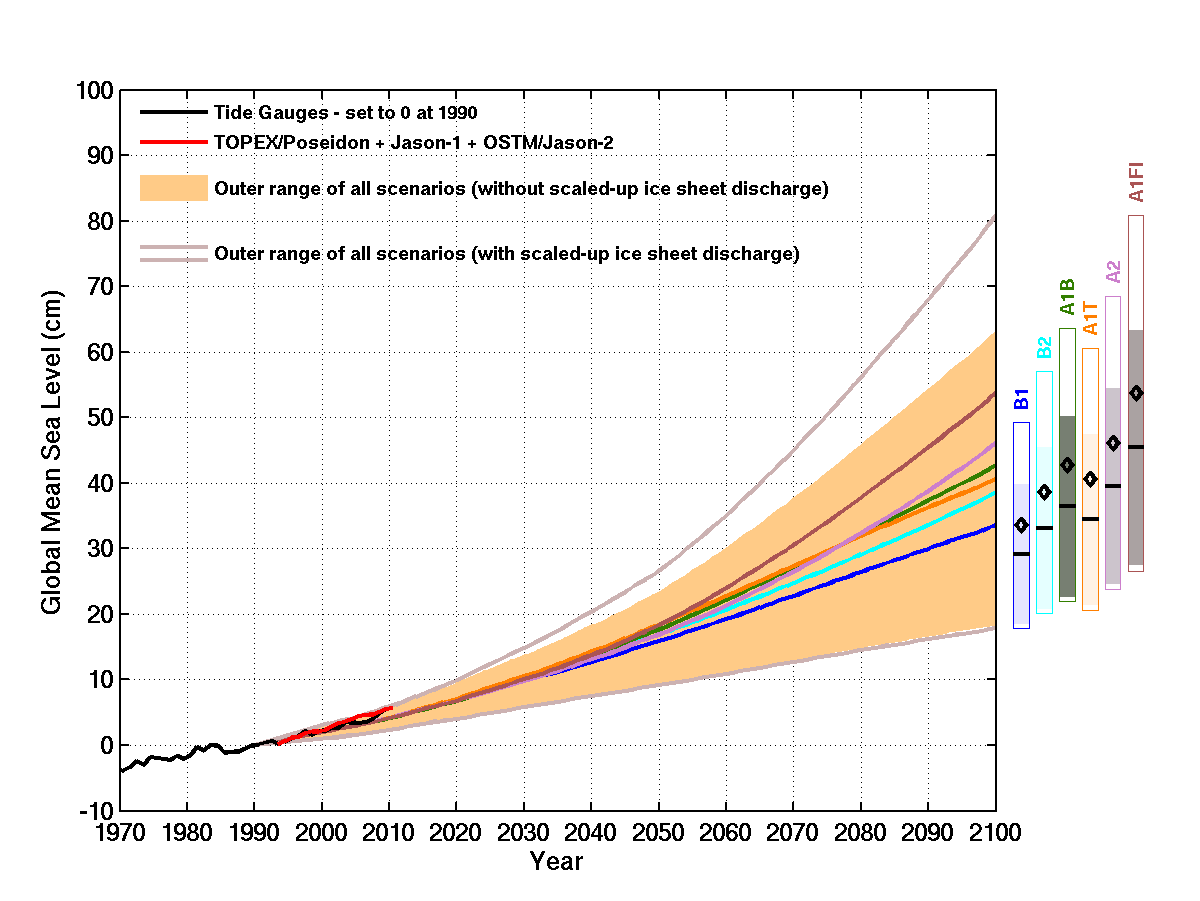
This figure shows projections of global-averaged sea-level rise for the greenhouse gas scenarios from the IPCC Special Report on Emission Scenarios(SRES) to 2100 with respect to 1990. The shaded region shows the full (5- to 95-percentile) range of projections, without scaled-up ice sheet discharge. The continuous coloured lines from 1990 to 2100 indicate the central value of the projections, including the scaled-up ice sheet discharge. The bars at right show the 5- to 95-percentile range of projections for 2100 for the various SRES scenarios. The horizontal lines/diamonds in the bars are the central values without and with the scaled-up ice sheet discharge. The observational estimates of global-averaged sea level based on tide-gauge measurements and satellite-altimeter data are shown in black and red, respectively. The tide-gauge data are set to zero at the start of the projections in 1990, and the altimeter data are set equal to the tide-gauge data at the start of the record in 1993. The projections are based on the Intergovernmental Panel on Climate Change Fourth Assessment Report (IPCC AR4), as reproduced in Church et al. (2011a).
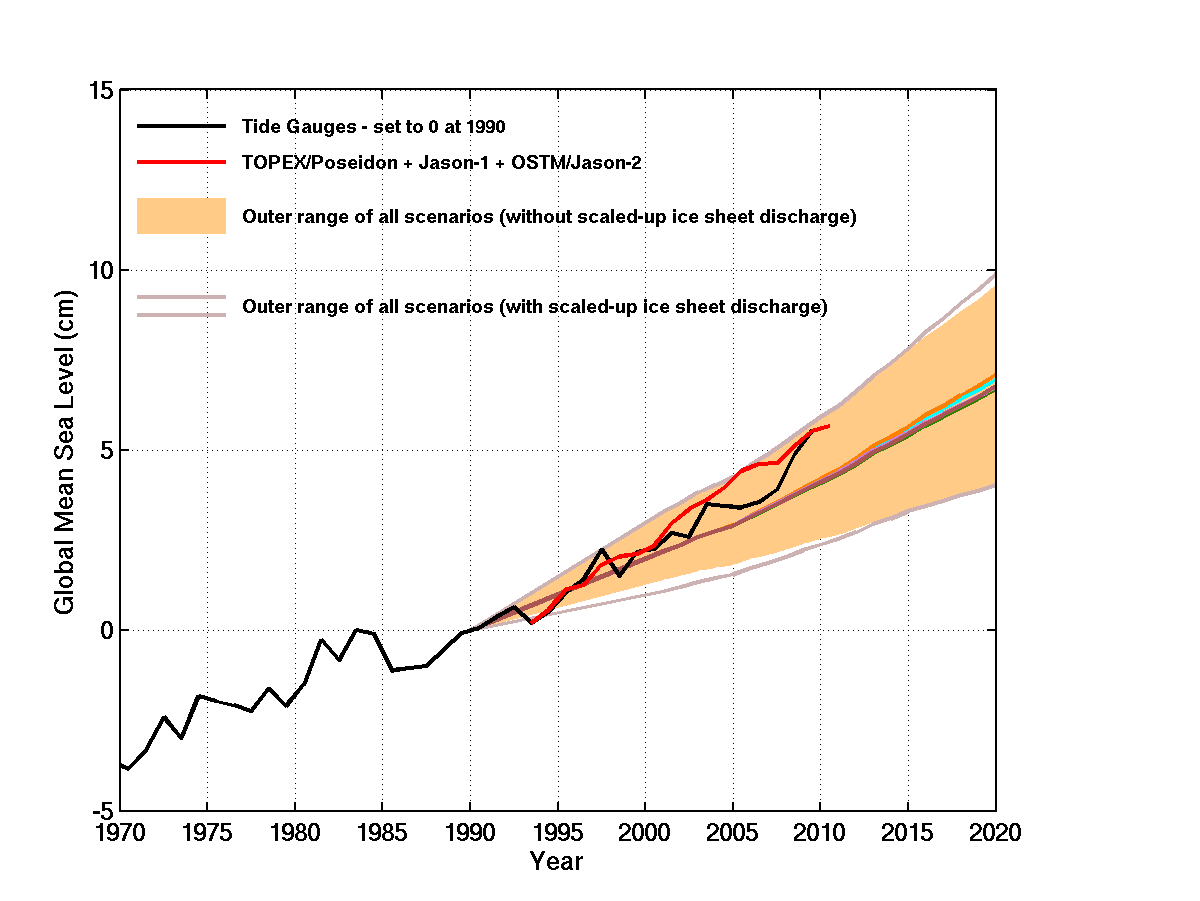
This figure shows the early part (1970-2020) of the figure above in more detail. Tables of projections
This table can be downloaded as a .csv file.
This table can be downloaded as a .csv file. How are the IPCC projections made?These projections are based on outputs from the climate models: changes in ocean temperature from the models are used to estimate changes in sea level due to thermal expansion, changes in global-averaged surface temperatures are used to estimate contributions from glaciers and changes in surface mass balance are used to estimate contributions from the Greenland and Antarctic Ice Sheets. See (e.g.): chapter 10 of the AR4 for more information. There is also a contribution to allow for a poorly understood ice sheet response. As stated in the AR4, the projections include a contribution due to increased ice flow from Greenland and Antarctica at the rates observed for 1993 to 2003 but that these flow rates could increase or decrease in the future. An estimate of this contribution was made by scaling it with global average temperature change. Projections here are based on the IPCC projections. What are "semi-empirical" projections?The inability of models to reproduce the observed rise during the twentieth century, our lack of ability (until recently) to adequately close the sea-level budget over decadal periods, and the observation that sea level is currently rising near the upper end of the IPCC AR4 projections has led to concern that the IPCC projections for the twenty-first century may be underestimated (Rahmstorf et al., 2007; the figure above). This concern has, in turn, led to the development of so-called "semi-empirical Models" (Rahmstorf, 2007; Vermeer and Rahmstorf, 2009; Grinsted et al., 2010) in an attempt to bypass our lack of complete process understanding. These semi-empirical models scale observed sea-level rise to some other physical parameter such as global averaged temperature or radiative forcing. They give higher rates of rise and a wider range of projections (about 50-180 cm) by 2100. A number of concerns have been raised about these semi-empirical projections, one of which is that, although semi-empirical models represent the observed rise over the period of calibration, there is little available information to quantitatively test their predictive skill over decadal periods. Some of the projections are at the high end of the physics-based estimates of the maximum plausible sea-level rise by 2100 (i.e. 2.0m), as given by Pfeffer et al. (2008). Where to next?Progress has been made since the AR4: there is now a quantitative understanding of the reasons for the observed sea-level rise from 1972 to 2008 (Church et al., 2011b), and progress is being made towards making better regional projections (Church et al. 2011a and Slangen et al. (2011)). Statistical techniques for making adaptation decisions are also being developed (Hunter, 2011). Some of the factors that have to be taken into account to improve these projections are:
Some of these issues are described in more detail in Church et al. (2011a), a link for which is given below. ReferencesChurch, J.A., J.M. Gregory, N.J. White, S.M. Platten and J.X. Mitrovica (2011a), Understanding and Projecting Sea Level Change. Oceanography (Journal of The Oceanography Society), 24(2), 130-143, doi:10.5670/oceanog.2011.33 for more information. This article is available from The Oceanography Society's web site Church, J.A., N.J. White, L.F. Konikow, C.M. Domingues, J.G. Cogley, E. Rignot, J.M. Gregory, M.R. van den Broeke, A.J. Monaghan, and I. Velicogna (2011b), Revisiting the Earth's sea level and energy budgets from 1961 to 2008, Geophysical Research Letters, 38, L18601, doi:10.1029/ 2011GL048794 Hunter, J.R. (2011), A simple technique for estimating an allowance for uncertain sea-level rise, Climatic Change, 1-14, DOI: 10.1007/s10584-011-0332-1 (published online). Meehl, G.A., T.F. Stocker, W.D. Collins, P. Friedlingstein, A.T. Gaye, J.M. Gregory, A. Kitoh, R. Knutti,
J.M. Murphy, A. Noda, and others. 2007. Global climate projections. Chapter 10 in Climate Change 2007:
The Physical Science Basis. Contribution of Working Group 1 to the Fourth Assessment Report of the
Intergovernmental Panel on Climate Change. S. Solomon, D. Qin, M. Manning, M. Marquis, K. Averyt, Pfeffer, W.T., J.T. Harper, and S. O'Neel. 2008. Kinematic constraints on glacier contributions to 21st-century sea-level rise. Science, 321, 1340-1343
Document date: 01-Mar-2012 |
||||||||||||||||||||||||||||||||||||||||||||||||||||||||||||||||||||||||||||||||||||||||||||||||||||||||||||||||||||||||||||||||||||||||||||||||||||||||||||||||||||||||||||||||||||||||||||||||||||||||||||||||||||||||||||||||||||||||||||||||||||||||||||||||||||||||||||||||||||||||||||||||||||||||||||||||||||||||||||||||||||||||||||||||||||||||||||||||||||||||||||||||||||||||||||||||||||||||||||||||||||||||||||||||||||||||||||||||||||||||||||||||||||||||||||||||||||||||||||||||||||||||||||||||||||||||||||||||||||||||||||||||||||||||||||||||||||||||||||||||||||||||||
|
Website owner: Benoit Legresy | Last modified 5/01/15
|
||||||||||||||||||||||||||||||||||||||||||||||||||||||||||||||||||||||||||||||||||||||||||||||||||||||||||||||||||||||||||||||||||||||||||||||||||||||||||||||||||||||||||||||||||||||||||||||||||||||||||||||||||||||||||||||||||||||||||||||||||||||||||||||||||||||||||||||||||||||||||||||||||||||||||||||||||||||||||||||||||||||||||||||||||||||||||||||||||||||||||||||||||||||||||||||||||||||||||||||||||||||||||||||||||||||||||||||||||||||||||||||||||||||||||||||||||||||||||||||||||||||||||||||||||||||||||||||||||||||||||||||||||||||||||||||||||||||||||||||||||||||||||
![]()
