
Figures marked "CSIRO", are copyright CSIRO, but please feel free to use them, conditional on the figures not being altered, and their source being acknowledged, and with a link to this site where possible. All other figures are copyright. Please do not copy without the owner's permission.
|
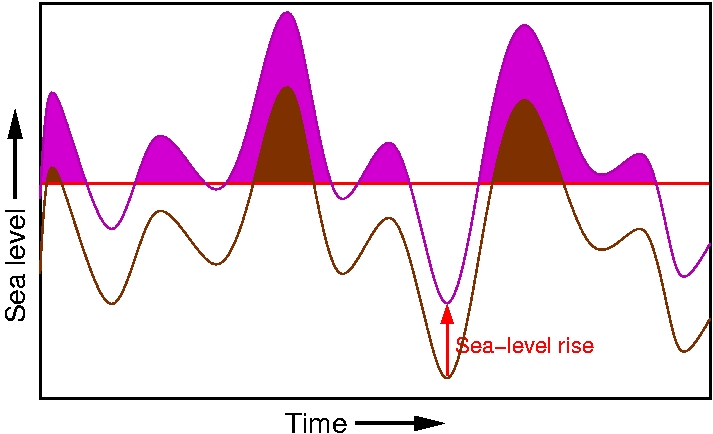
Sea Level ImpactsExtreme eventsIntroductionAs mean sea level rises, extreme events of a given height tend to become more frequent, as shown schematically in the following figure:
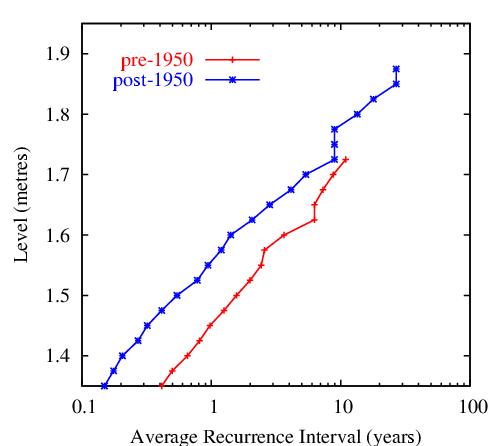
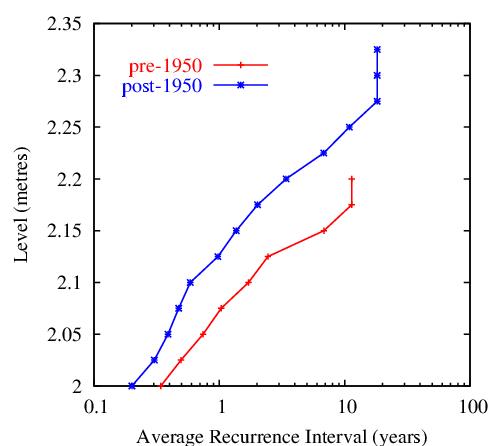
We quantify the occurrence of such events by the Return Period or Average Recurrence Interval, which is the average time between "exceedances" (the times when sea level exceeds a certain height). The simplest way to estimate this from observational data is to count the number of exceedances in the record for each of a series of prescribed heights. Estimate of the ARI are then given by the length of the observations divided by the numbers of exceedances. The effect of sea level rise during the 20th century is indicated in the following figures, which shows the change of Average Recurrence Interval (derived using the above method) from the first half of the century to the second, at Fort Denison and Fremantle. It can be seen that the Average Recurrence Interval for these extremes was reduced by a factor or around three at both sites, so that an extreme that used to occur, say, every three years now occurs every one year. See also Church, J.A., J.R. Hunter, K.L. McInnes and N.J. White (2006), sea level rise around the Australian coastline and the changing frequency of extreme sea level events. Australian Meteorological Magazine, 55, 253-260. Fremantle
Fort Denison
|
|
Website owner: Benoit Legresy | Last modified 20/11/14
|
![]()
