
Figures marked "CSIRO", are copyright CSIRO, but please feel free to use them, conditional on the figures not being altered, and their source being acknowledged, and with a link to this site where possible. All other figures are copyright. Please do not copy without the owner's permission.
|
Why does sea level change?Longer termOn time scales of months and longer, sea level changes as a result of both changes in ocean mass (addition of water to the ocean from the land) and expansion/contraction of the ocean water as it warms/cools. Sea level changes – Mass ExchangeExchange of water with other "reservoirs" is an important contribution to sea level change. A significant part of this is through the hydrological cycle, where water evaporates from the ocean, resides in the atmosphere, then returns to the ocean either directly or via reservoirs (snow, ice, lakes, rivers, groundwater etc). There are both annual variations as well as longer-term variations. For example, extraction of water from underground aquifers can increase the mass of the ocean whereas the storage of water in dams can decrease the mass of the ocean. 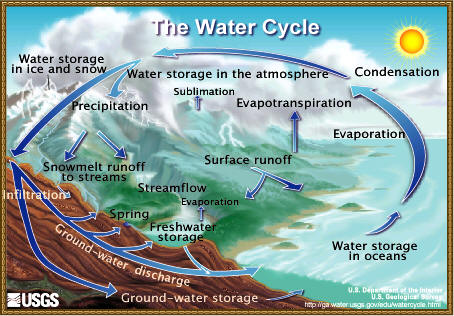 A major contribution to sea level change is from the changing mass of glaciers, and the ice sheets. At the time of the last glacial maximum when sea level was more than 120 m below present level, there were major ice sheets in North American and northern Europe and Asia. Sea level changes – Thermal ExpansionThermal expansion is one of the main contributors to long-term sea level change, as well as being part of regional and short-term changes. Water expands as it warms and shrinks as it cools. From 1961 to 2003, the upper 700 metres of the global oceans absorbed about 3.6 x 10²¹ Joules per year, increasing global mean sea level (GMSL) by about 22 millimetres. This is equivalent to contributing about 0.52 mm/year to GMSL, and also to an air-sea flux of 0.36 Watts per square metre over the ocean area considered (65°S to 65°N). This contribution to GMSL is about one third of the total GMSL trend (1.6 mm/year) over this period. From 1993 to 2003, the thermosteric contribution was estimated to be about 0.79 mm/year, about a quarter of the total GMSL trend of 3.3 mm/year over the same period. See Domingues et al. (2008). 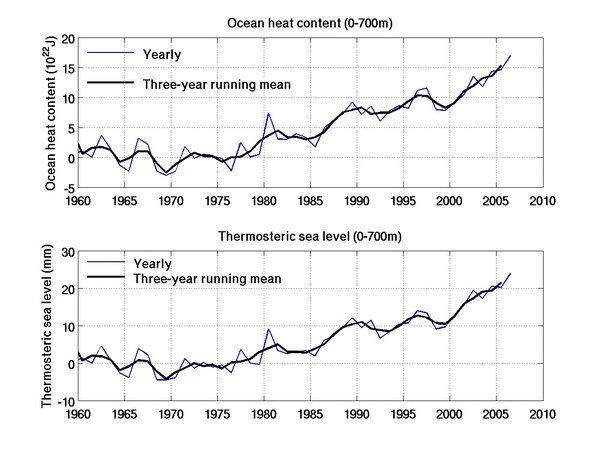
The top panel of the above plot show changes in the heat content of the top 700 metres of the ocean from 1960 to 2007. The bottom panel shows the change in thermosteric sea level. 
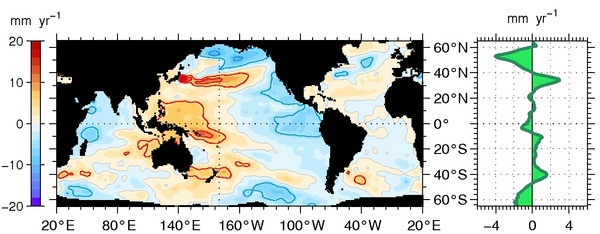
These plots show the spatial distribution of the rates of sea-level rise (with the mean trend removed) for January 1993 to December 2003. Top panel: Total sea level, as measured by satellite altimeters. Bottom panel: The thermal expansion contribution. (See Church et al. 2008). Data issues
1. Poor spatial samplingThere are large gaps in the spatial sampling, especially prior to 1990. Throughout the record the majority of the data is in the Northern Hemisphere, with some very data-sparse regions in the Southern Hemisphere, especially the Southern Ocean. Traditional forms of data interpolation tend to underestimate the signal from poorly sampled areas. We have used a form of EOF reconstruction which should alleviate this problem to some extent (Domingues et al. 2008). 2. XBTsEstimates of ocean heat content have also been problematical because of problems with XBT (eXpendable BathyThermograph - see here for more information) data. These instruments are expendable probes which are dropped from a moving ship. They have a thermistor in the nose cone and transmit the thermistor resistance (equivalent to temperature) back to instrumentation on the ship via a fine copper wire which is paid out from the XBT as it sinks through the water and from the ship as it steams on its way. For each type of XBT probe (there have been a number of small changes made since they were introduced in the late 1960s), a formula is used to estimate depth from the time since the XBT probe entered the water. It has become apparent in recent years that there are two main problems: Recent efforts have made significant progress towards resolving these issues. As a result the linear trend of the heat content (and steric height) time series from 1960 to 2003 is larger than previous estimates. However there is little change to the actual change in heat content/height between the 1950s and 2003. The corrected data agrees better with the sea-surface temperature record and with model results. 3. Argo floatsThe Argo array is a global array of 3,000 free-drifting profiling floats that measures the temperature and salinity of the upper 2000 m of the ocean. This allows, for the first time, continuous monitoring of the temperature, salinity, and velocity of the upper ocean, with all data being relayed and made publicly available within hours after collection. Argo deployments began in 2000 and by November 2007 the array was 100% complete. While the Argo array is currently complete at 3000 floats, to be maintained at that level, national commitments need to provide about 800 floats per year (which has occurred for the past three years). The earlier part of this array has some large data gaps (again, especially in the Southern Ocean), which can be problematical if you try to use only Argo data in analyses. In addition, one type of float (mainly deployed in the Atlantic Ocean) had problems which caused estimates of ocean heat content to drop for a few years. These floats have now been identified.
ReferencesDomingues, C.M. , J.A. Church, N.J. White, P.J. Gleckler, S.E. Wijffels, P.M. Barker and J.R. Dunn (2008), Improved estimates of upper-ocean warming and multi-decadal sea-level rise. Nature, 453, 1090-1094, doi:10.1038/nature07080. Church, J.A., N.J. White, T. Aarup, W.S. Wilson, P.L. Woodworth, C.M. Domingues, J.R. Hunter & K. Lambeck (2008), Understanding global sea levels: past, present and future. Sustainability Science, Special Feature: Original Article, doi:10.1007/s11625-008-0042-4. Wijffels, S.E., J. Willis, C.M. Domingues, P. Barker, N.J. White, A. Gronell, K. Ridgway and J.A. Church (2008), Changing eXpendable BathyThermograph fall-rates and their impact on estimates of thermosteric sea level rise. Journal of Climate, accepted, doi: 10.1175/2008JCLI2290.1. Gouretski, V. and K.P. Koltermann (2007), How much is the ocean really warming? Geophysical Research Letters 34 L01610, doi:10.1029/2006GL027834. Ingleby, B. and M. Huddleston (2007), Quality control of ocean temperature and salinity profiles - Historical and real time data. J. Mar. Sys. 65, 158-175. |
|
Website owner: Benoit Legresy | Last updated 5/01/15
|
![]()
