Why does sea level change?
Recent contributions
Global warming from increasing greenhouse gas concentrations is a significant driver of
both increases in ocean mass and ocean thermal expansion as components of recent and future
sea level rise.
Ocean Thermal Expansion
From 1955 to 1995, earlier estimates of ocean thermal expansion is estimated to have
contributed about 0.4 mm/year to sea level rise, less than 25 per cent of the observed
rise over the same period. For the 1993 to 2003 decade, when the best data are available,
thermal expansion was estimated to be significantly larger, at about 1.6 mm/year for
the upper 750 m of the ocean alone, about 50 per cent of the observed sea level rise of
3.1 mm/year. Over the last few years we have been working hard on providing improved
estimates of ocean thermal expansion.
[top]
Contributions from non-polar Glaciers
Kaser et al and others estimate the melting of glaciers and ice caps (excluding
the glaciers surrounding Greenland and Antarctica) contributed to sea level rise by about 0.4 mm
per year from 1961 to 1990 increasing to about 1.0 mm per year from 2001-2004. (Kaser, G.,
J.G. Cogley, M.B. Dyurgerov, M.F. Meier and A. Ohmura (2006), Mass balance of glaciers and ice caps:
Consensus estimates for 1961-2004, Geophysical Research Letters,
33, L19501, doi:1029/2006GL027511
Meier et al state that mass loss from glaciers is dominating the eustatic
component of sea level rise in the 21st century, providing 1.1 mm/year of the total eustatic
contribution of 1.8 mm/year in 2006. (Meier, M.F>, M.B. Dyurgerov, U.K. Rick, S. O'Neel,
W.T. Pfeffer, R.S. Anderson, S.P. Anderson and A.F. Glazovsky (2007), Glaciers Dominate
Eustatic sea level Rise in th 21st Century, Science,
317, 1064-1067
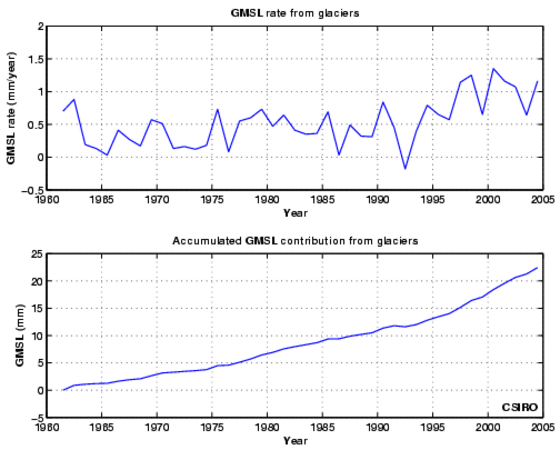
Dyurgerov and Meier glacier estimate.
The figure below shows the time series of glacier contributions to global sea level (top panel)
and the cumulative effect (bottom panel) from 1961-2004.
[top]
Contributions from the Ice Sheets
The ice sheets of Greenland and Antarctica have the potential to make the largest contribution
to sea level rise, but they are also the greatest source of uncertainty. Since 1990 there has
been increased snow accumulation at high elevation on the Greenland ice sheet, while at
lower elevation there has been more widespread surface melting and a significant increase in
the flow of outlet glaciers. The net result is a decrease in the mass of the Greenland ice
sheet - a positive contribution to sea level rise. For the Antarctic Ice Sheet, the uncertainty
is greater. There are insufficient data to make direct estimates for the preceding decades.
At present, the mass gain of the Antarctic Ice Sheet due to increased thickening of the East
Antarctic Ice Sheet does not appear to compensate for the mass loss due to the increased glacier
flow on the Antarctic Peninsula and the West Antarctic Ice Sheet. Modelling studies suggest that the Antarctic Ice Sheet is still responding to changes since the last ice age and that this may also
be contributing to sea level rise.
Antarctica
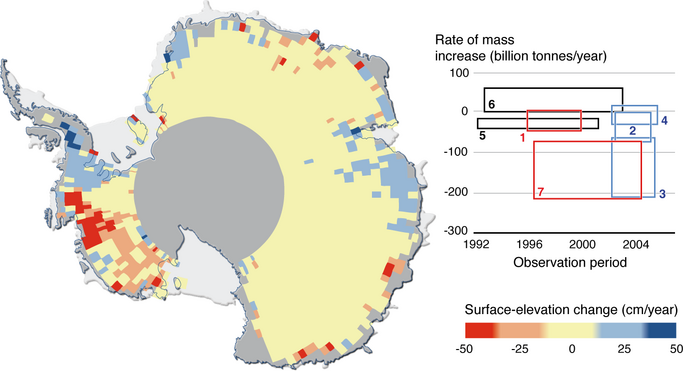
The
figure shows rates at which the ice-sheet mass was estimated to be changing
based on radar-altimeter data (black), mass-budget calculations (red), and
satellite gravity measurements (blue). Rectangles depict the time periods
of observations (horizontal) and the upper and lower estimates of mass balance
(vertical). Measurements by satellite techniques based on gravity indicate
|