
Figures marked "CSIRO", are copyright CSIRO, but please feel free to use them, conditional on the figures not being altered, and their source being acknowledged, and with a link to this site where possible. All other figures are copyright. Please do not copy without the owner's permission.
|
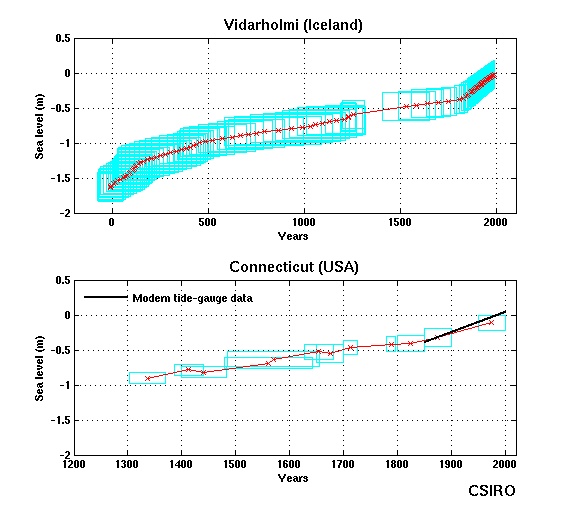
Historical sea level CHANGESLast few hundred yearsChanges in local sea level estimated from sediment cores collected in salt marshes reveal an increase in the rate of sea level rise in the western and eastern Atlantic Ocean during the 19th century and early 20th century, consistent with the few long tide-gauge records from Europe and North America. The figure below shows data from Vidarholmi, Iceland (data from Roland Gehrels, Gehrels et al., 2006) and Connecticut, USA (data from Dr Jeff Donnelly, WHOI Coastal System Group , Donnelly et al., 2004).
The few very long tide gauge records all show an increase in the rate of sea level rise from the 18th century.
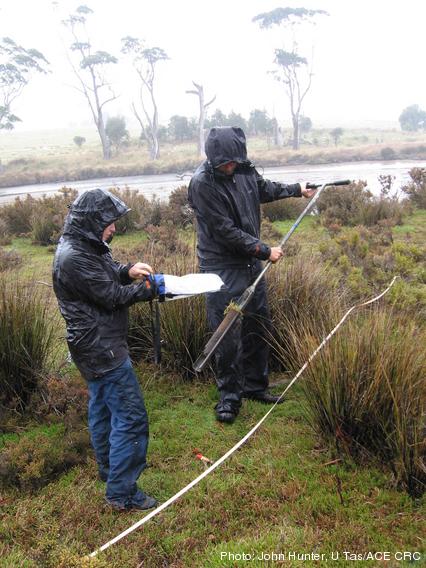
One of the oldest tide gauge benchmarks in the world is at Port Arthur in south-east Tasmania. When combined with historical tide gauge data (found in the London and Australian archives) and recent sea level observations, it shows that relative sea level has risen by 13.5 cm from 1841 to 2000.
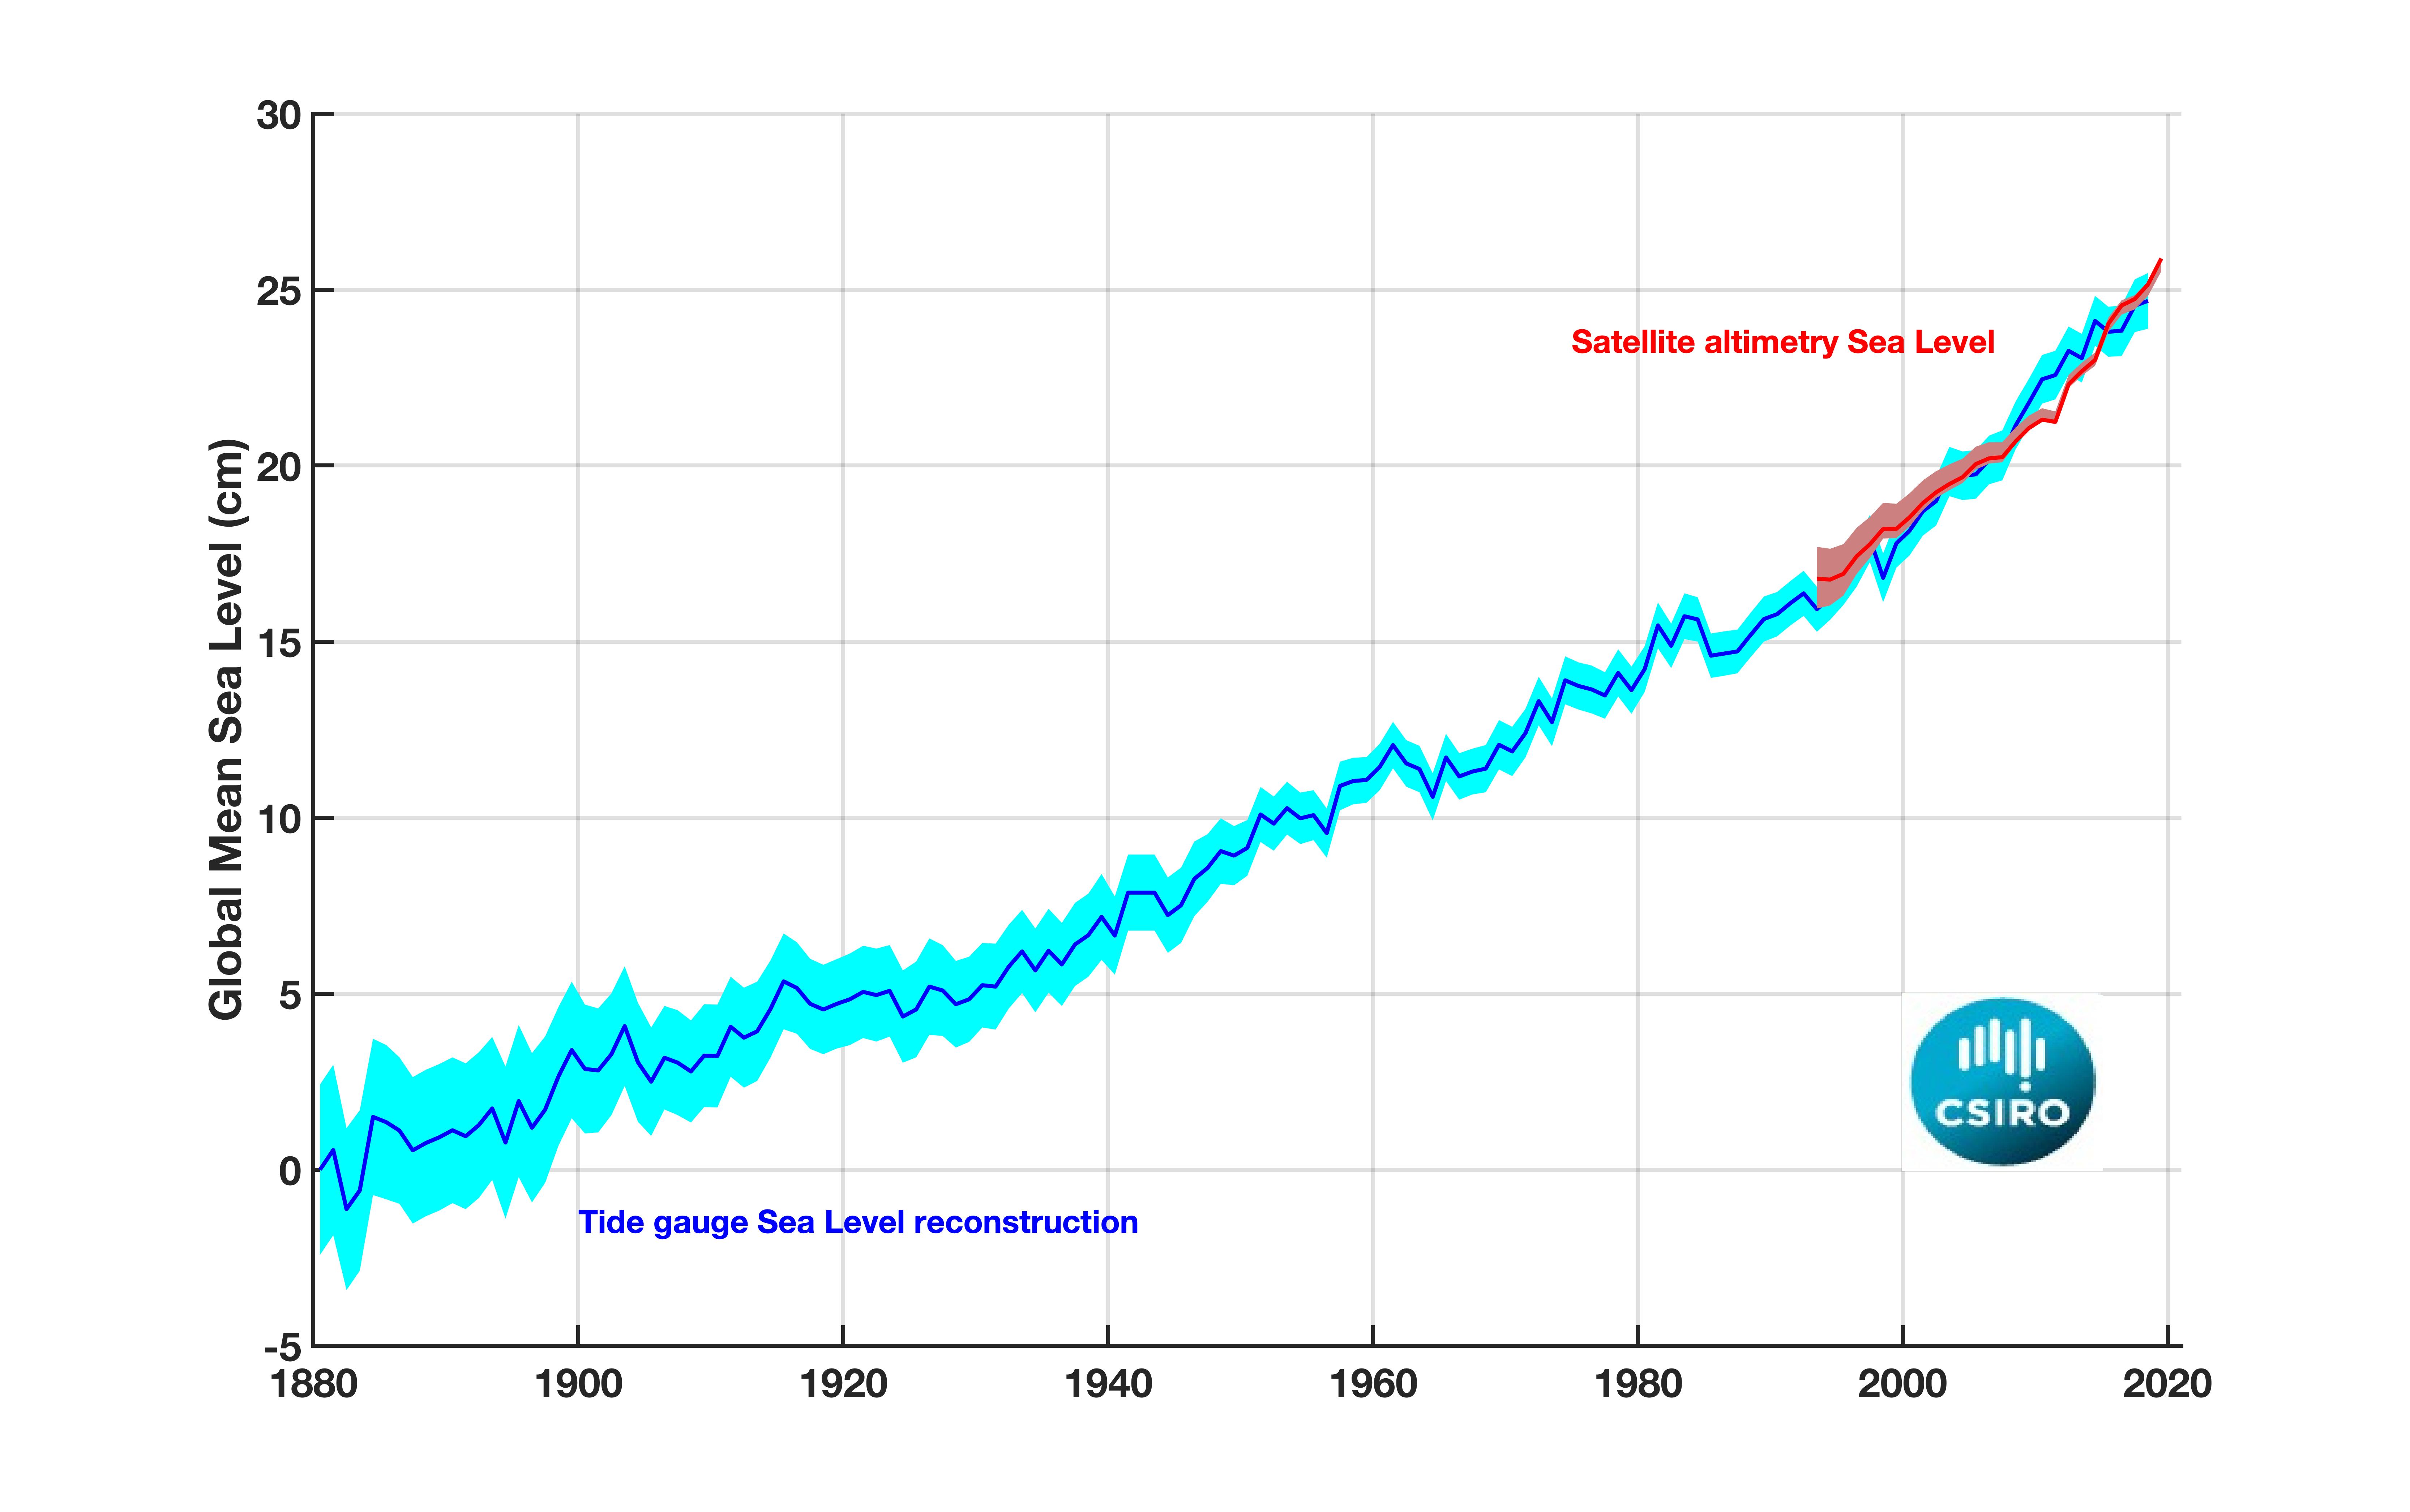
We have used a combination of historical tide-gauge data and satellite-altimeter data to estimate global averaged sea level change from 1880 to 2019. During this period, global-averaged sea level rose about 25 cm, with an average rate of rise of about 1.6 mm/yr over the 20th Century. The sea level record indicates a statistically significant increase in the rate of rise from 1880 to 2019. Global Mean Sea Level (GMSL) - 1880 to the end of 2019
The data for the blue line reconstruction are here : (get the data) The data for the red line updated altimetry record are here : (get the data) More on the satellite sea level record here : https://www.cmar.csiro.au/sealevel/sl_hist_last_decades.html More sea level data here : https://www.cmar.csiro.au/sealevel/sl_data_cmar.html |
|
Website owner: Benoit Legresy | Last modified 12/10/2020
|

![]()
