
Figures marked "CSIRO", are copyright CSIRO, but please feel free to use them, conditional on the figures not being altered, and their source being acknowledged, and with a link to this site where possible. All other figures are copyright. Please do not copy without the owner's permission.
|
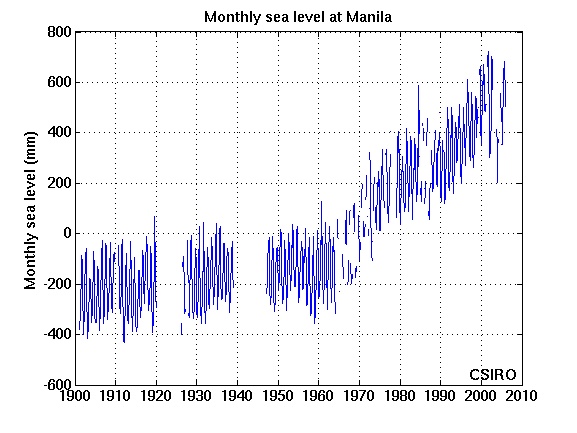
Sea level measurementsTide gaugesThe measurement of long-term changes in sea level from tide gauges involves the following: At any one site:
Fortunately for us most of this work has been done by the nice people at the Permanent Service for Mean Sea Level (PSMSL). The University of Hawaii also maintains an archive of tide gauge data. For our work we normally use the monthly average data as we are mainly interested in the long-term behaviour, but higher frequency data is needed for some applications. Some high frequency data is available from the PSMSL and UHSLC, but much of it is in national archives, such as Australia's National Tidal Centre (NTC). Tide gauge-derived SSH records are subject to contamination by vertical movement, which can take various forms:
In recent years a lot of effort has been going into installing GPS receivers at or very close to high quality tide gauges to try to estimate this vertical movement directly and then correct for it. Some of the GPS records are now getting to the stage of providing useful estimates of this. See for example GLOSS and TIGA. |
|
Website owner: Benoit Legresy | Last modified 11/10/10
|
![]()
