Voyage details and related metadata, reports, events and data.
IN2019_V04
- is a Marine National Facility ![]() voyage
voyage
Title: Hotspot dynamics in the Coral Sea: connections between the Australian plate and deep Earth
Voyage details on MNF site: https://mnf.csiro.au/en/Voyages/IN2019_V04
Period: 2019-08-06 21:00 to 2019-09-02 22:00 UTC
Duration: 27.04 days
From: Cairns To: Brisbane
Region: Queensland coast; East Australian Current; Coral Sea; Solomon Sea
Ship: Investigator (RV) [details]
Description: In a handful of locations on Earth, hot material rises from deep within the Earth to create lines of volcanoes such as the Hawaiian-Emperor Seamount Chain. We aim to test if the Tasmantid and Lord Howe Seamount chains, hidden in the seas off eastern Australia, should be included in this rare group and if the Louisiade Plateau to the north could have formed from the massive flood of basaltic lava triggered when a rising plume reaches the surface.
Leader: Joanne Whittaker (UTAS)
Projects:
-
Hotspot dynamics in the Coral Sea: connections between the Australian plate and deep Earth [details] Primary
-
Spatial and temporal variability in the distribution and abundance of seabirds and marine mammals [details] Supplementary
-
Understanding the spatial links between geomorphology and biodiversity in the Coral Sea Australian Marine Park. [details] Supplementary
-
CSIRO Educator on Board [details] Piggy-back
-
Collection of dead Invertebrates dredged with geological samples [details] Piggy-back
-
Core Argo floats [details] Piggy-back
-
Transit over likely wreck sites of the USS Lexington and USS Neosho [details] Piggy-back
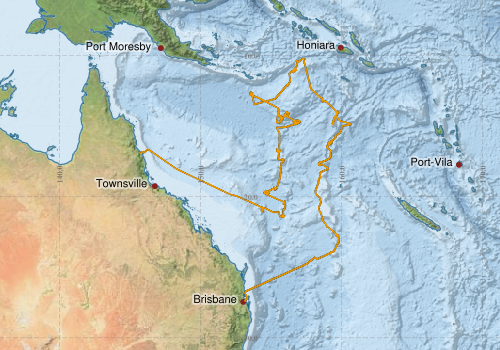
Voyage extents: 27° 25.0' S to 10° 11.5' S 145° 46.8' E to 160° 38.7' E Get voyage track shapefile Get CSV
Marlin Metadata:-
Metadata from OBIS Australia datasets:- biological data is published via the OBIS-AU IPT server and delivered to one or more of OBIS, ALA and GBIF
Download from OBIS Australia IPT View at - Ocean Biodiversity Information System (OBIS)
Download from OBIS Australia IPT View at - Ocean Biodiversity Information System (OBIS)
Cruise Summary Report at SeaDataNet:-
Participants - on ship:-
| Name | Role | Organisation | Project |
|---|---|---|---|
| Ben Cohen | Geologist | University of Glasgow (UK) | Hotspot dynamics in the Coral Sea: connections between the Australian plate and deep Earth |
| Eric Woehler | Lead Principal Investigator | Birdlife Australia | Spatial and temporal variability in the distribution and abundance of seabirds and marine mammals |
| Jeremy Horowitz | PhD - black corals | James Cook University | Collection of dead Invertebrates dredged with geological samples |
| Joanne Whittaker | Chief Scientist | University of Tasmania | Hotspot dynamics in the Coral Sea: connections between the Australian plate and deep Earth |
| Karin Orth | Volcanologist | University of Tasmania | Hotspot dynamics in the Coral Sea: connections between the Australian plate and deep Earth |
| Rob Beaman | Geophysicist | James Cook University | Transit over likely wreck sites of the USS Lexington and USS Neosho |
| Simon Williams | Alternative Chief Scientist | University of Sydney | Hotspot dynamics in the Coral Sea: connections between the Australian plate and deep Earth |
| Vanessa Lucieer | Lead Principal Investigator | University of Tasmania | Understanding the spatial links between geomorphology and biodiversity in the Coral Sea Australian Marine Park. |
Participants - shore based:-
| Name | Role | Organisation | Project |
|---|---|---|---|
| Maria Seton | Principal Investigator | University of Sydney | Hotspot dynamics in the Coral Sea: connections between the Australian plate and deep Earth |
This list includes those that may have only been on part of the voyage. See voyage reports on 'Reports and Maps' tab for details.
Marine National Facility Reports - plans, summaries and data processing
-
IN2019_V04 Voyage Plan
- includes objectives, investigator details, proposed data collection, voyage track and equipment to be used.
-
IN2019_V04 ADCP Data Processing Report
- details of data processing steps, calibration information, instruments used and any issues with the data.
-
IN2019_V04 Voyage Summary
- includes preliminary results, voyage narrative, types of data collected with C77/ROSCOP codes.
-
IN2019_V04 Scientific Highlights
- report of the key outputs
-
IN2019_V04 Underway Data Processing Report
- details of data processing steps, calibration information, instruments used and any issues with the data.
- View Survey map
Publications, reports and datasets from this voyage.
Dataset
- A new carnivorous sponge (Porifera) from the Coral Sea, Australia (2019) External link to reference
- Vanessa Lucieer (2020) Geomorphology and Surface Classification of seven (7) Coral Sea seamounts External link to reference
- Whittaker, Joanne; Lucieer, Vanessa; Nau, Amy; Vandenbossche, Phil; Navidad, Cisco; Gifford, Davina (2023): IN2019_V04 Coral Sea Bathymetry 10m - 210m Multi-resolution AusSeabed products. v1. CSIRO. Data Collection. 10.25919/pvxg-nf52
IPT Resource
- A new carnivorous sponge Lycopodina coralseaensis (Porifera) from the Coral Sea, Australia (2019) (Darwin Core Archive) External link to reference
- First records of Hamacantha species from seamounts off eastern Australia (Porifera, Demospongiae, Merliida), with description of four new species (Darwin Core Archive) External link to reference
Journal Article
- Daudt, Nicholas W.,Woehler, Eric J.,Schofield, Matthew R.,Smith, Robert O.,Bugoni, Leandro,Rayment, William J. (2024) Seabird assemblages are linked to the major western boundary current off eastern Australia. Progress in Oceanography 223 pp103215-. 10.1016/j.pocean.2024.103215
- Ekins, Merrick,Baker, Soraya,Hooper, John N.A. (2023) First records of Hamacantha species from seamounts off eastern Australia (Porifera, Demospongiae, Merliida), with description of four new species. Zootaxa 5318 pp382-400. 10.11646/zootaxa.5318.3.4
- Ekins, Merrick,Horowitz, Jeremy,Beaman, Robin,Hooper, John (2021) A new carnivorous sponge (Porifera) from the Coral Sea. Memoirs of the Queensland Museum - Nature 62 pp205-215. 10.17082/j.2204-1478.62.2021.2020-06
- Haris, K.,Kloser, Rudy J.,Ryan, Tim E.,Downie, Ryan A.,Keith, Gordon,Nau, Amy W. (2021) Sounding out life in the deep using acoustic data from ships of opportunity. Scientific Data 8 pp-. 10.1038/s41597-020-00785-8
- McCarthy, Anders,Magri, Luca,Sauermilch, Isabel,Fox, Jodi,Seton, Maria,Mohn, Geoffroy,Tugend, Julie,Feig, Sandrin,Falloon, Trevor,Whittaker, Joanne M. (2022) The Louisiade ophiolite: A missing link in the western Pacific. Terra Nova 34 pp146-154. 10.1111/ter.12578
- Zhang, Haifeng,Beggs, Helen,Griffin, Christopher,Govekar, Pallavi Devidas (2023) Validation of Himawari-8 Sea Surface Temperature Retrievals Using Infrared SST Autonomous Radiometer Measurements. Remote Sensing 15 pp2841-. 10.3390/rs15112841
Report
- V.L. Lucieer,R. Beaman,E. Woehler,J. Horowitz,A. Nau,P. Vandenbossche (2020) Post survey report for the Coral Sea Australian Marine Park 2019. NESP Marine Biodiversity Hub. External link to reference
- Woehler EJ 2021. Seabird and cetacean surveys, RV Investigator and RV Falkor 2019/20 and 2020/21. Report to Parks Australia, March 2021. BirdLife Tasmania Technical Report 2021 – 03, 30pp.
Search for publications, reports and datasets from this and other voyages
Data publishing
This is a list of online datasets hosted by CSIRO. Other processed datasets hosted by collaborating organisations may be found on the 'Metadata' or "Reports, Publications and Maps' tab.
Use the Get data link on the right to extract data using the NCMI Data Trawler.
| Data Stream | Data Summary | Get data | ||||||||||||||
|---|---|---|---|---|---|---|---|---|---|---|---|---|---|---|---|---|
| ADCP Data |
|
Get Data from Trawler Download the OS75nb plots: in2019_v04_ADCP_webpy_os75nb.zip Download 150KHz ADCP Data (NetCDF, 5 minute): in2019_v04_os150nb.zip Download the OS150nb plots: in2019_v04_ADCP_webpy_os150nb.zip Download 75KHz ADCP Data (NetCDF, 5 minute): in2019_v04_os75nb.zip |
||||||||||||||
| Marine biodiversity observations and/or samples |
|
Get Data from Trawler |
||||||||||||||
| Multibeam echosounder |
|
Get Data from Trawler |
||||||||||||||
| pCO2 |
|
External link - download datafile at IMOS Data fields and units document (.pdf) |
||||||||||||||
| Radon measurements |
|
Get Data from Trawler Download RV Investigator Radon dataset (XLSX) |
||||||||||||||
| Sub-bottom profiler |
|
Get Data from Trawler |
||||||||||||||
| Singlebeam echosounder |
|
Get Data from Trawler |
||||||||||||||
| SOOP Bio-acoustics |
|
External link
Transect 2 - datafile at IMOS Transect 3 - datafile at IMOS NetCDF Data Format: Manual Download |
||||||||||||||
| Sea Surface Temperature |
|
Get Data from Trawler Download IN2019_V04 compressed dataset (3.9 Mb) |
||||||||||||||
| Underway |
|
Get Data from Trawler Download the 5-second csv data: in2019_v04uwy5sec_csv.zip Download the 10-second csv data: in2019_v04uwy10sec_csv.zip Download the 5-minute csv data: in2019_v04uwy5min_csv.zip Download the 5-second netcdf data: in2019_v04uwy_nc.zip Download the 1-minute csv data: in2019_v04uwy1min_csv.zip |
||||||||||||||
| XBT Profile |
|
Get Data from Trawler Geophysical Survey and Mapping data acquisition and processing report |
| ID | When (UTC) | Lat | Long | Instrument | Identifier | Action | Log | Subject / Comment |
|---|
Deployments by start time:- Click on column header to sort. Use link on 'Deployment' to see full details. Use the CSV button at the bottom to export data (tab delimited).
Search for deployments from this voyage and others
| Deployment | Operation | Station | Cast | Gear | Project | Start and end times | Start Location | End Location | Depth range | Max Depth | Description | |||
|---|---|---|---|---|---|---|---|---|---|---|---|---|---|---|
| Underway System [details] | Air Sampling Inlet Mode,Air Temperature Sensor-HMT333,Altimeter-163,Burket Flow meter,Burket Flow meter,CSIRO Hobart pCO2,CSIRO Hobart pCO2,CSIRO Hobart pCO2,CSIRO Hobart pCO2,CSIRO Hobart pCO2,CSIRO Hobart pCO2,CSIRO Hobart pCO2,CSIRO Hobart pCO2,CSIRO Hobart pCO2,CSIRO Hobart pCO2,CSIRO air sampling inlet,CSIRO air sampling inlet,Chelsea Tech Fluorometer,Fluorometer Concentration,Gyrocompass,Humidity Sensor-HMT333,Humidity Sensor-HMT333,Humidity Sensor-HMT333,IMOS Port Pyranometer-SN 29125F3,IMOS Port Radiometer-SN 29140F3,IMOS Stbd Pyranometer-SN 29125F3,IMOS Stbd Radiometer-SN 29140F3,IMOS wind monitor,IMOS wind monitor,IMOS wind monitor,IMOS wind monitor,ISAR SST,Kobold MIK-C Flow meter,Kobold MIK-C Fluorometer Flow Meter,Kongsberg Maritime Skipper DL850 doppler log,Kongsberg Maritime Skipper DL850 doppler log,Kongsberg Maritime Skipper DL850 doppler log,Kongsberg Maritime Skipper DL850 doppler log,Kongsberg Maritime Skipper DL850 doppler log,Kongsberg Maritime Skipper DL850 doppler log,LI-COR LI-190 Quantum Sensor,LI-COR LI-190 Quantum Sensor,MAAP Status,Multiangle Absorption Photometer (MAAP),Multiangle Absorption Photometer (MAAP),Optode Dissolved Oxygen Concentration,Optode Dissolved Oxygen Saturation,Optode Water Temperature,Ozone Monitor RVT1,Ozone Monitor RVT1,Ozone Monitor RVT2,Ozone Monitor RVT2,Picarro Greenhouse Gas Spectrometer CO2,CH4,H2o,Picarro Greenhouse Gas Spectrometer CO2,CH4,H2o,Picarro Greenhouse Gas Spectrometer CO2,CH4,H2o,Port Dew Point,Port Rain Gauge,Port drop keel sensor,RM Young 05106 wind monitor-SN 82705,RM Young Wind Sensor Type 05107,RM Young Wind Sensor Type 05107,RM Young Wind Sensor Type 05107,RM Young Wind Sensor Type 05107,RM Young Wind Sensor Type 05108,RM Young Wind Sensor Type 05108,RM Young Wind Sensor Type 05108,RM Young Wind Sensor Type 05108,Remote Temperature (T) - SN 671,Seapath 330+,Seapath 330+,Seapath 330+,Simrad EK60 multi-frequency split-beam echosounder,Starboard Dew Point,Starboard Rain Gauge,Starboard drop keel sensor,ThermoSalinoGraph (TSG)-SN 3439,ThermoSalinoGraph (TSG)-SS-SN 1777,Vaisala Ship's Barometer PTB330 | 2470 | 2019-08-06 21:01 | 2019-09-02 21:57 | -16.9257 | 145.7807 | -27.4158 | 153.1419 | ||||||
| ADCP Data [details] | Teledyne RDI ADCP 150 kHz,Teledyne RDI ADCP 75 kHz | 2470 | 2019-08-06 23:46 | 2019-09-02 09:56 | -16.7953 | 146.1116 | -26.5465 | 153.5554 | 814 | |||||
| XBT Cast [details] | Sippican Deep Blue | 2548 | 2019-08-22 08:16 | 1100.3 | ||||||||||
| XBT Cast [details] | Sippican Deep Blue | 2548 | 2019-08-22 08:23 | 700.1 | ||||||||||