


Historical SST
Maps showing historical SST in the GAB by month (rows) and year (columns) over the past 10 years. The number in the top right corner gives the mean SST (°C) over the month and area shown.
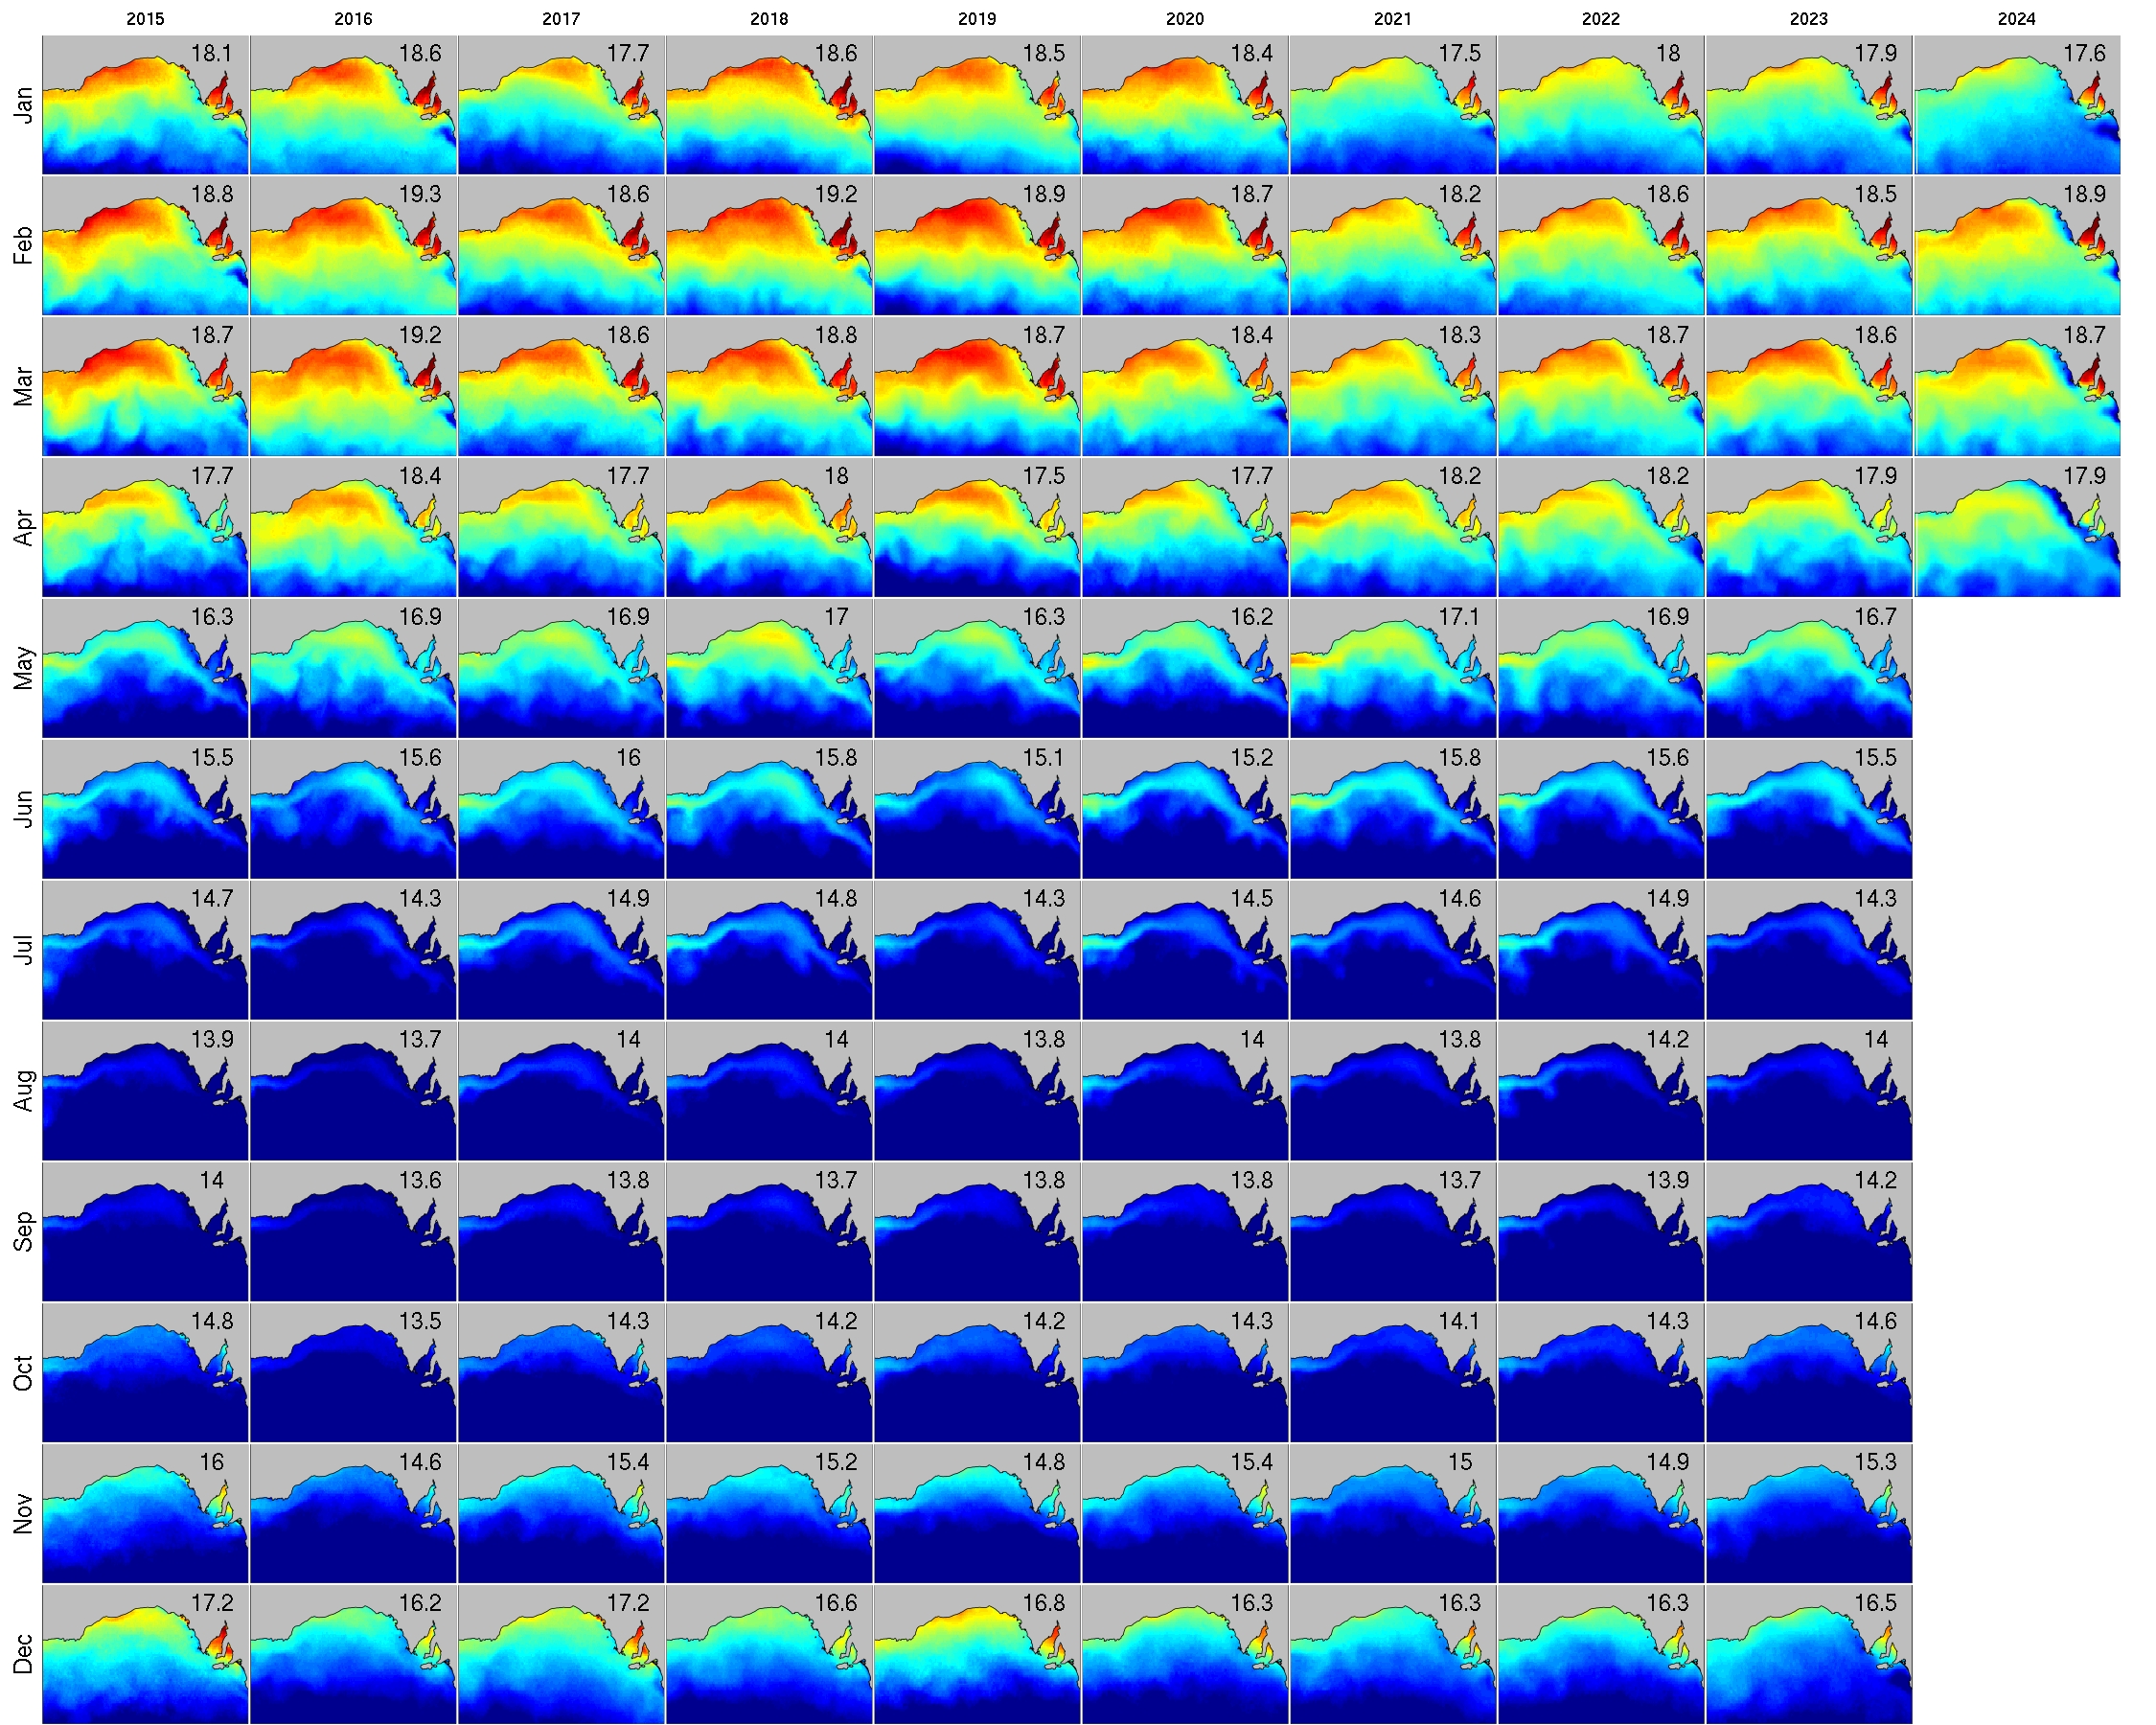
Full-size image
Time series plots of monthly SST (Nov-Apr) over the past 20 years for specific regions, as shown in the map.
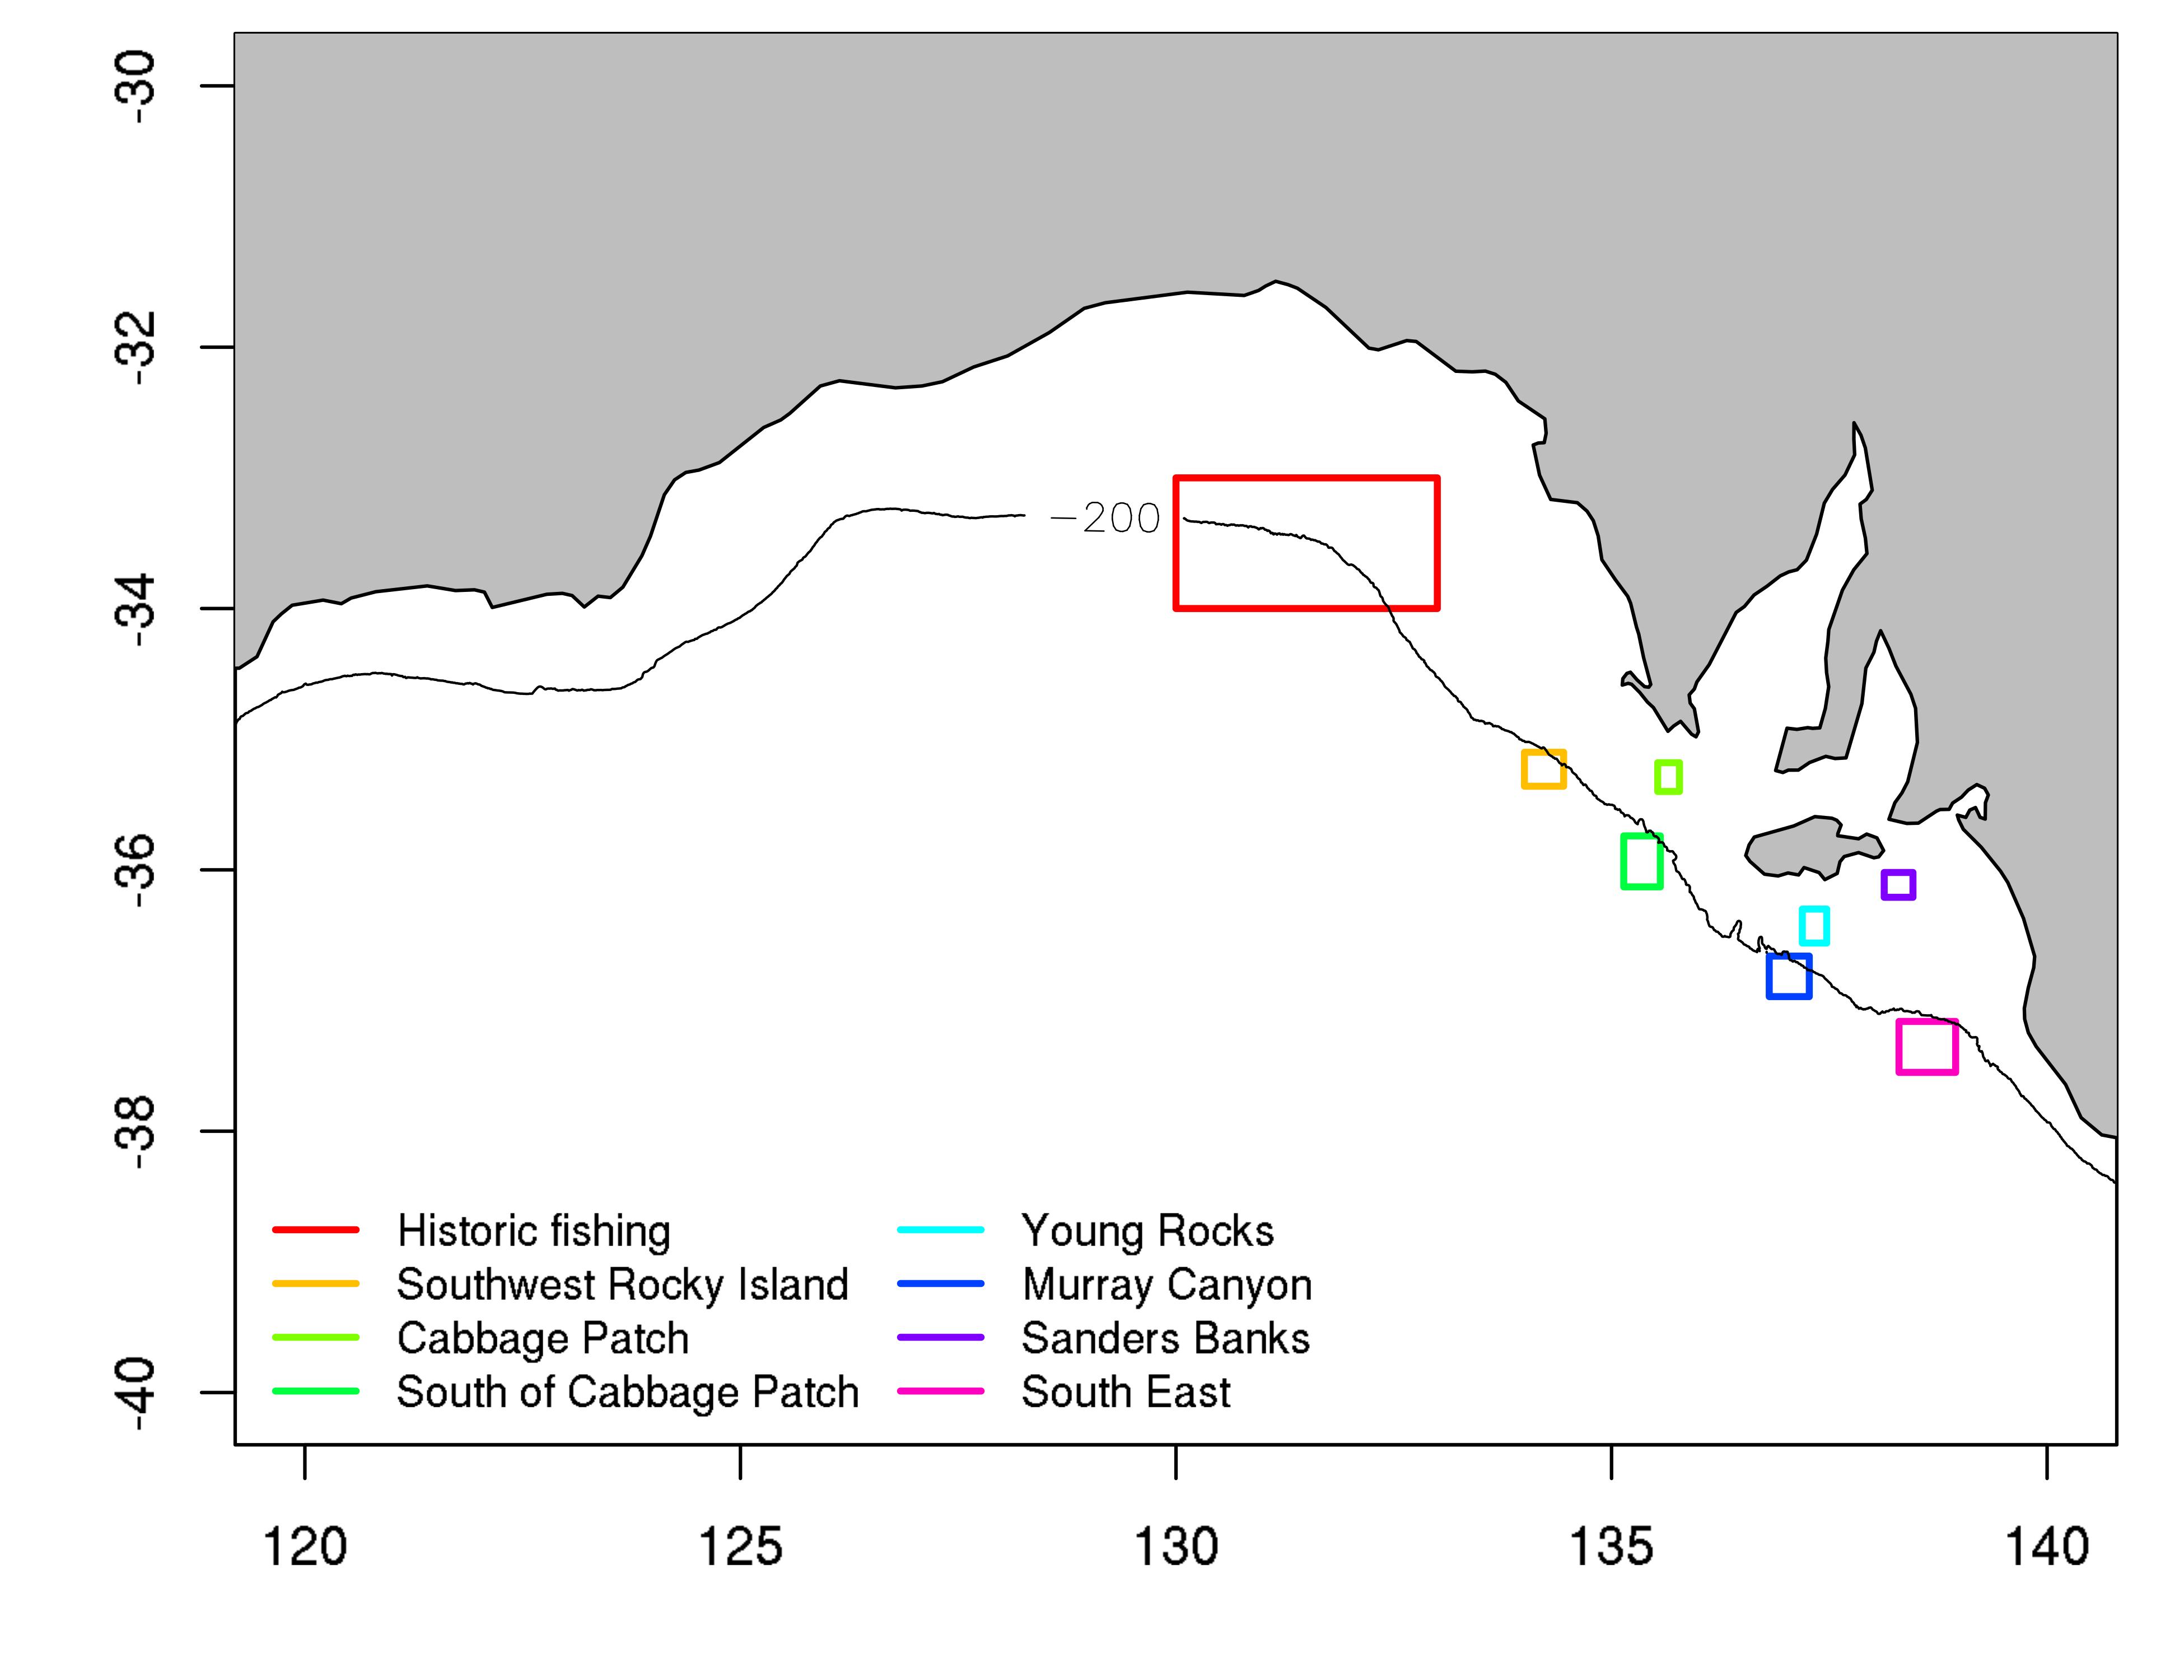
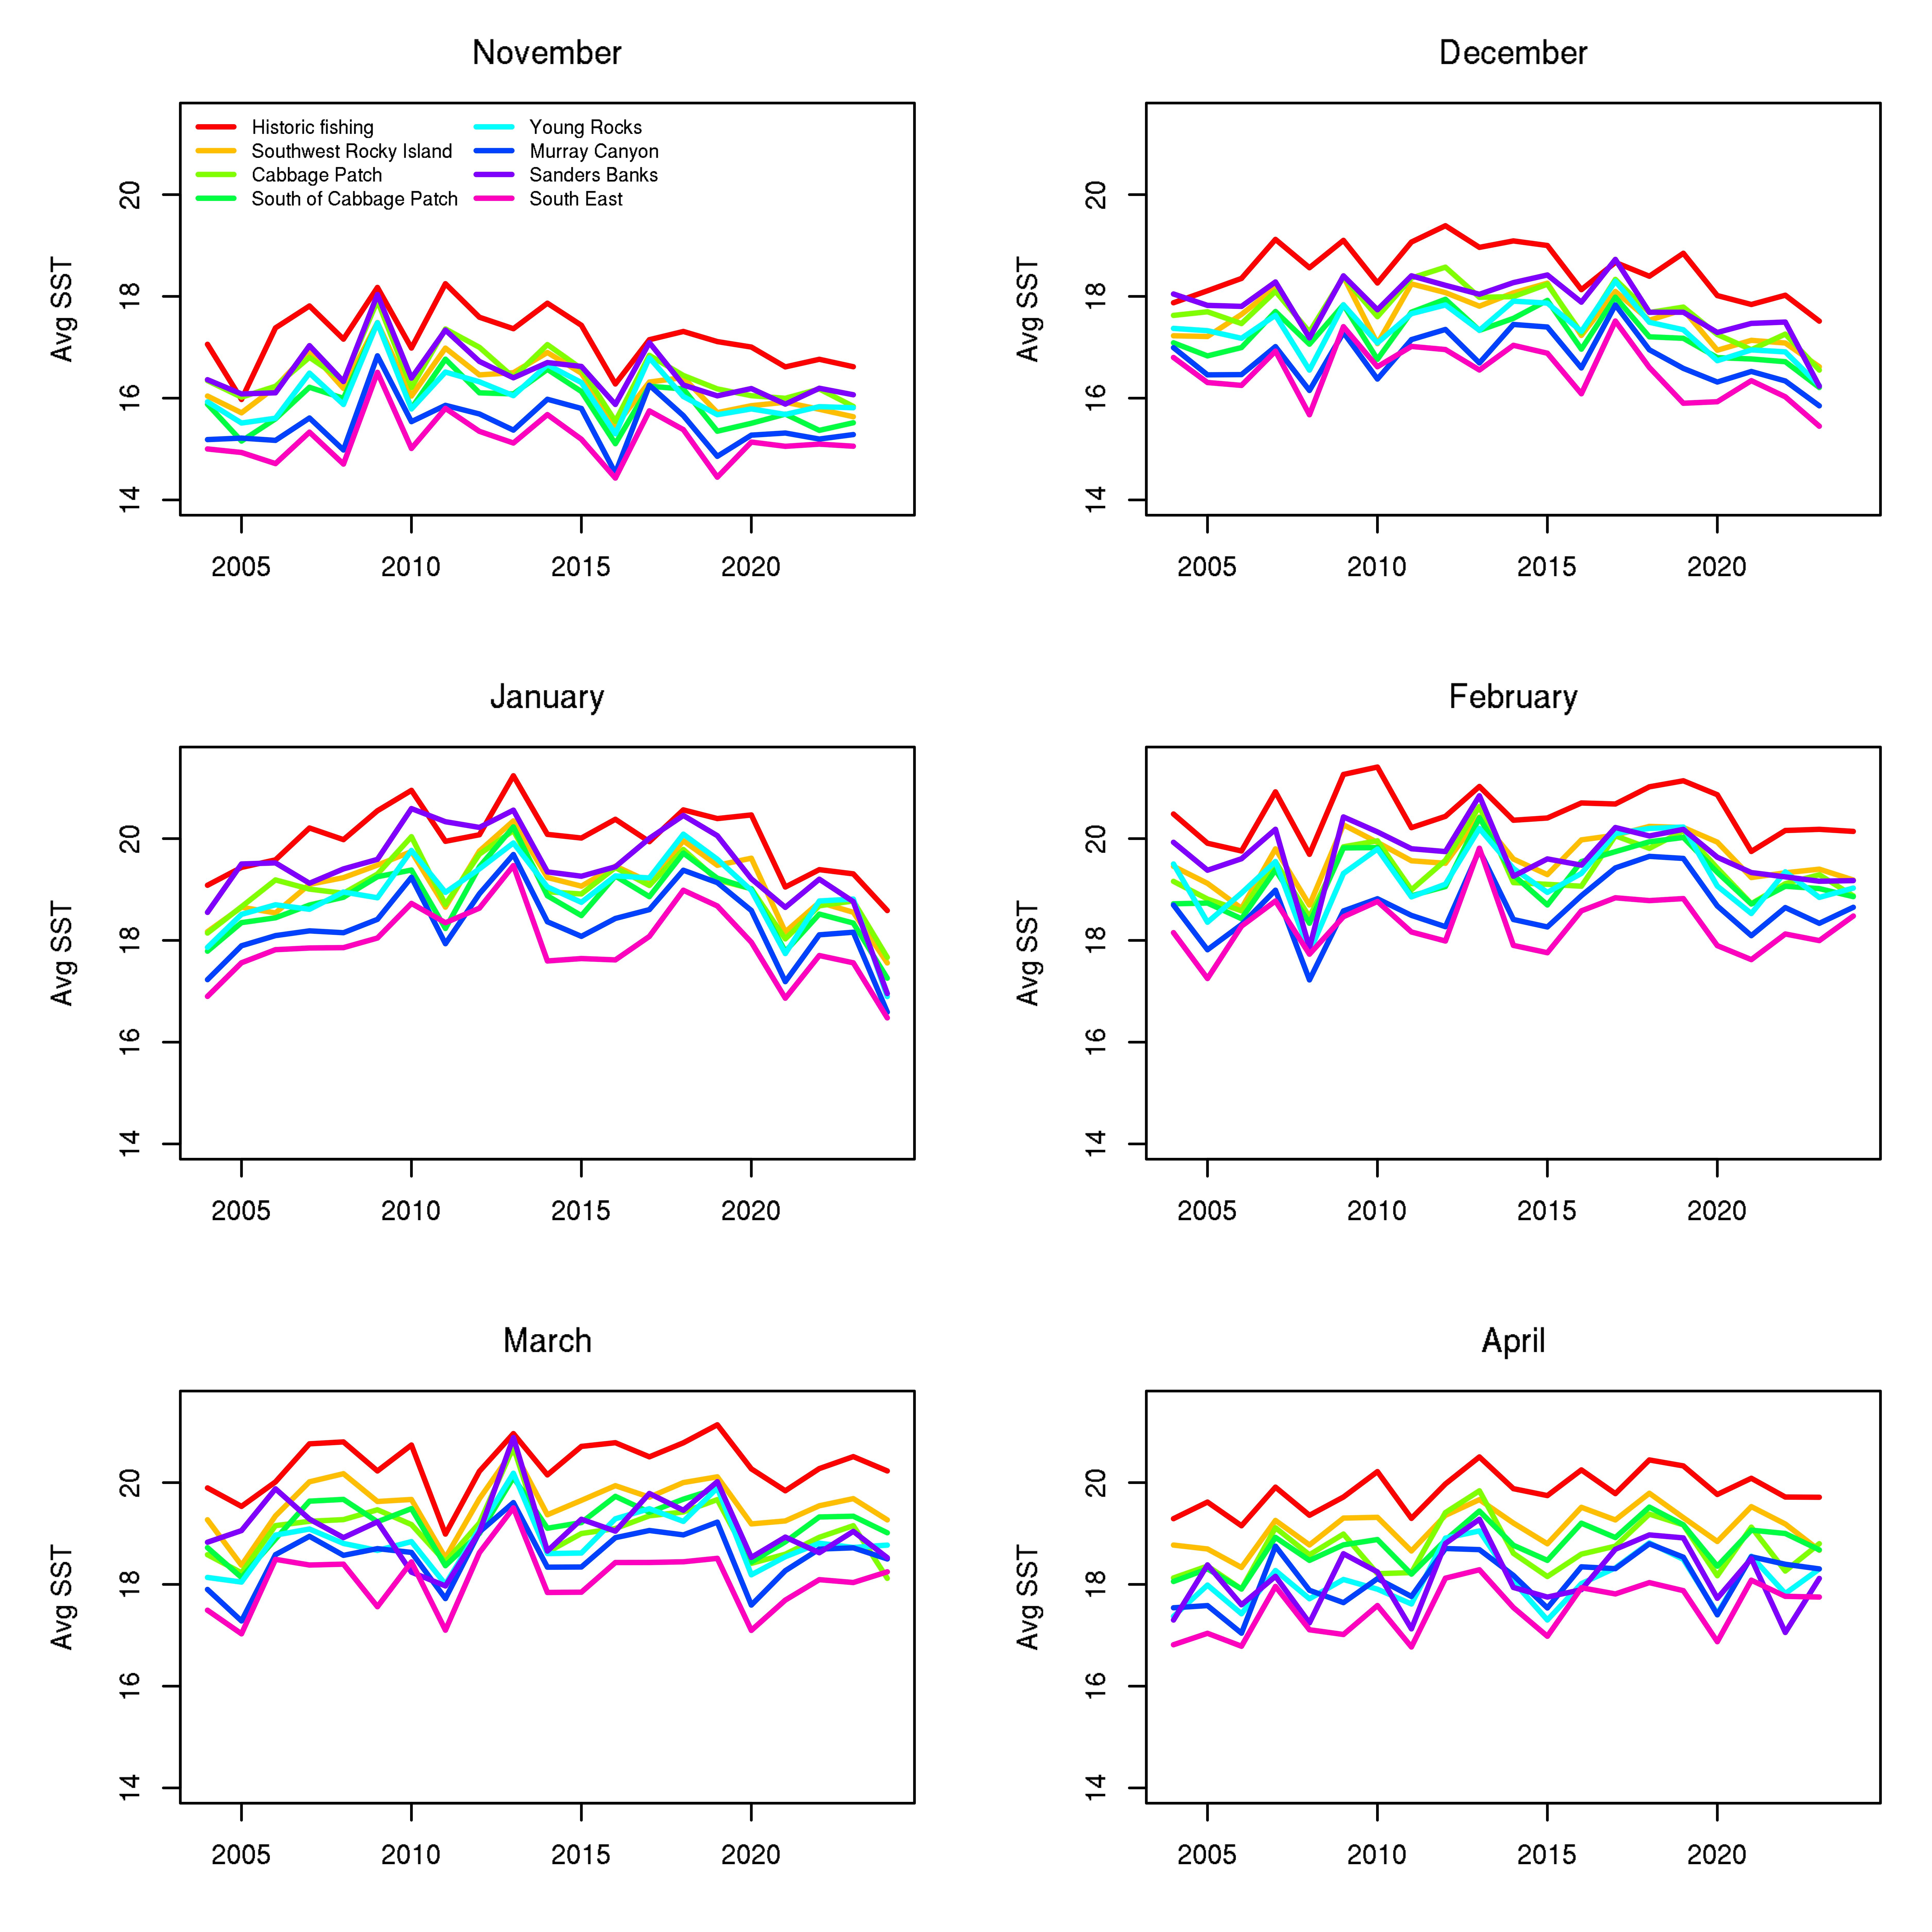
Full-size image