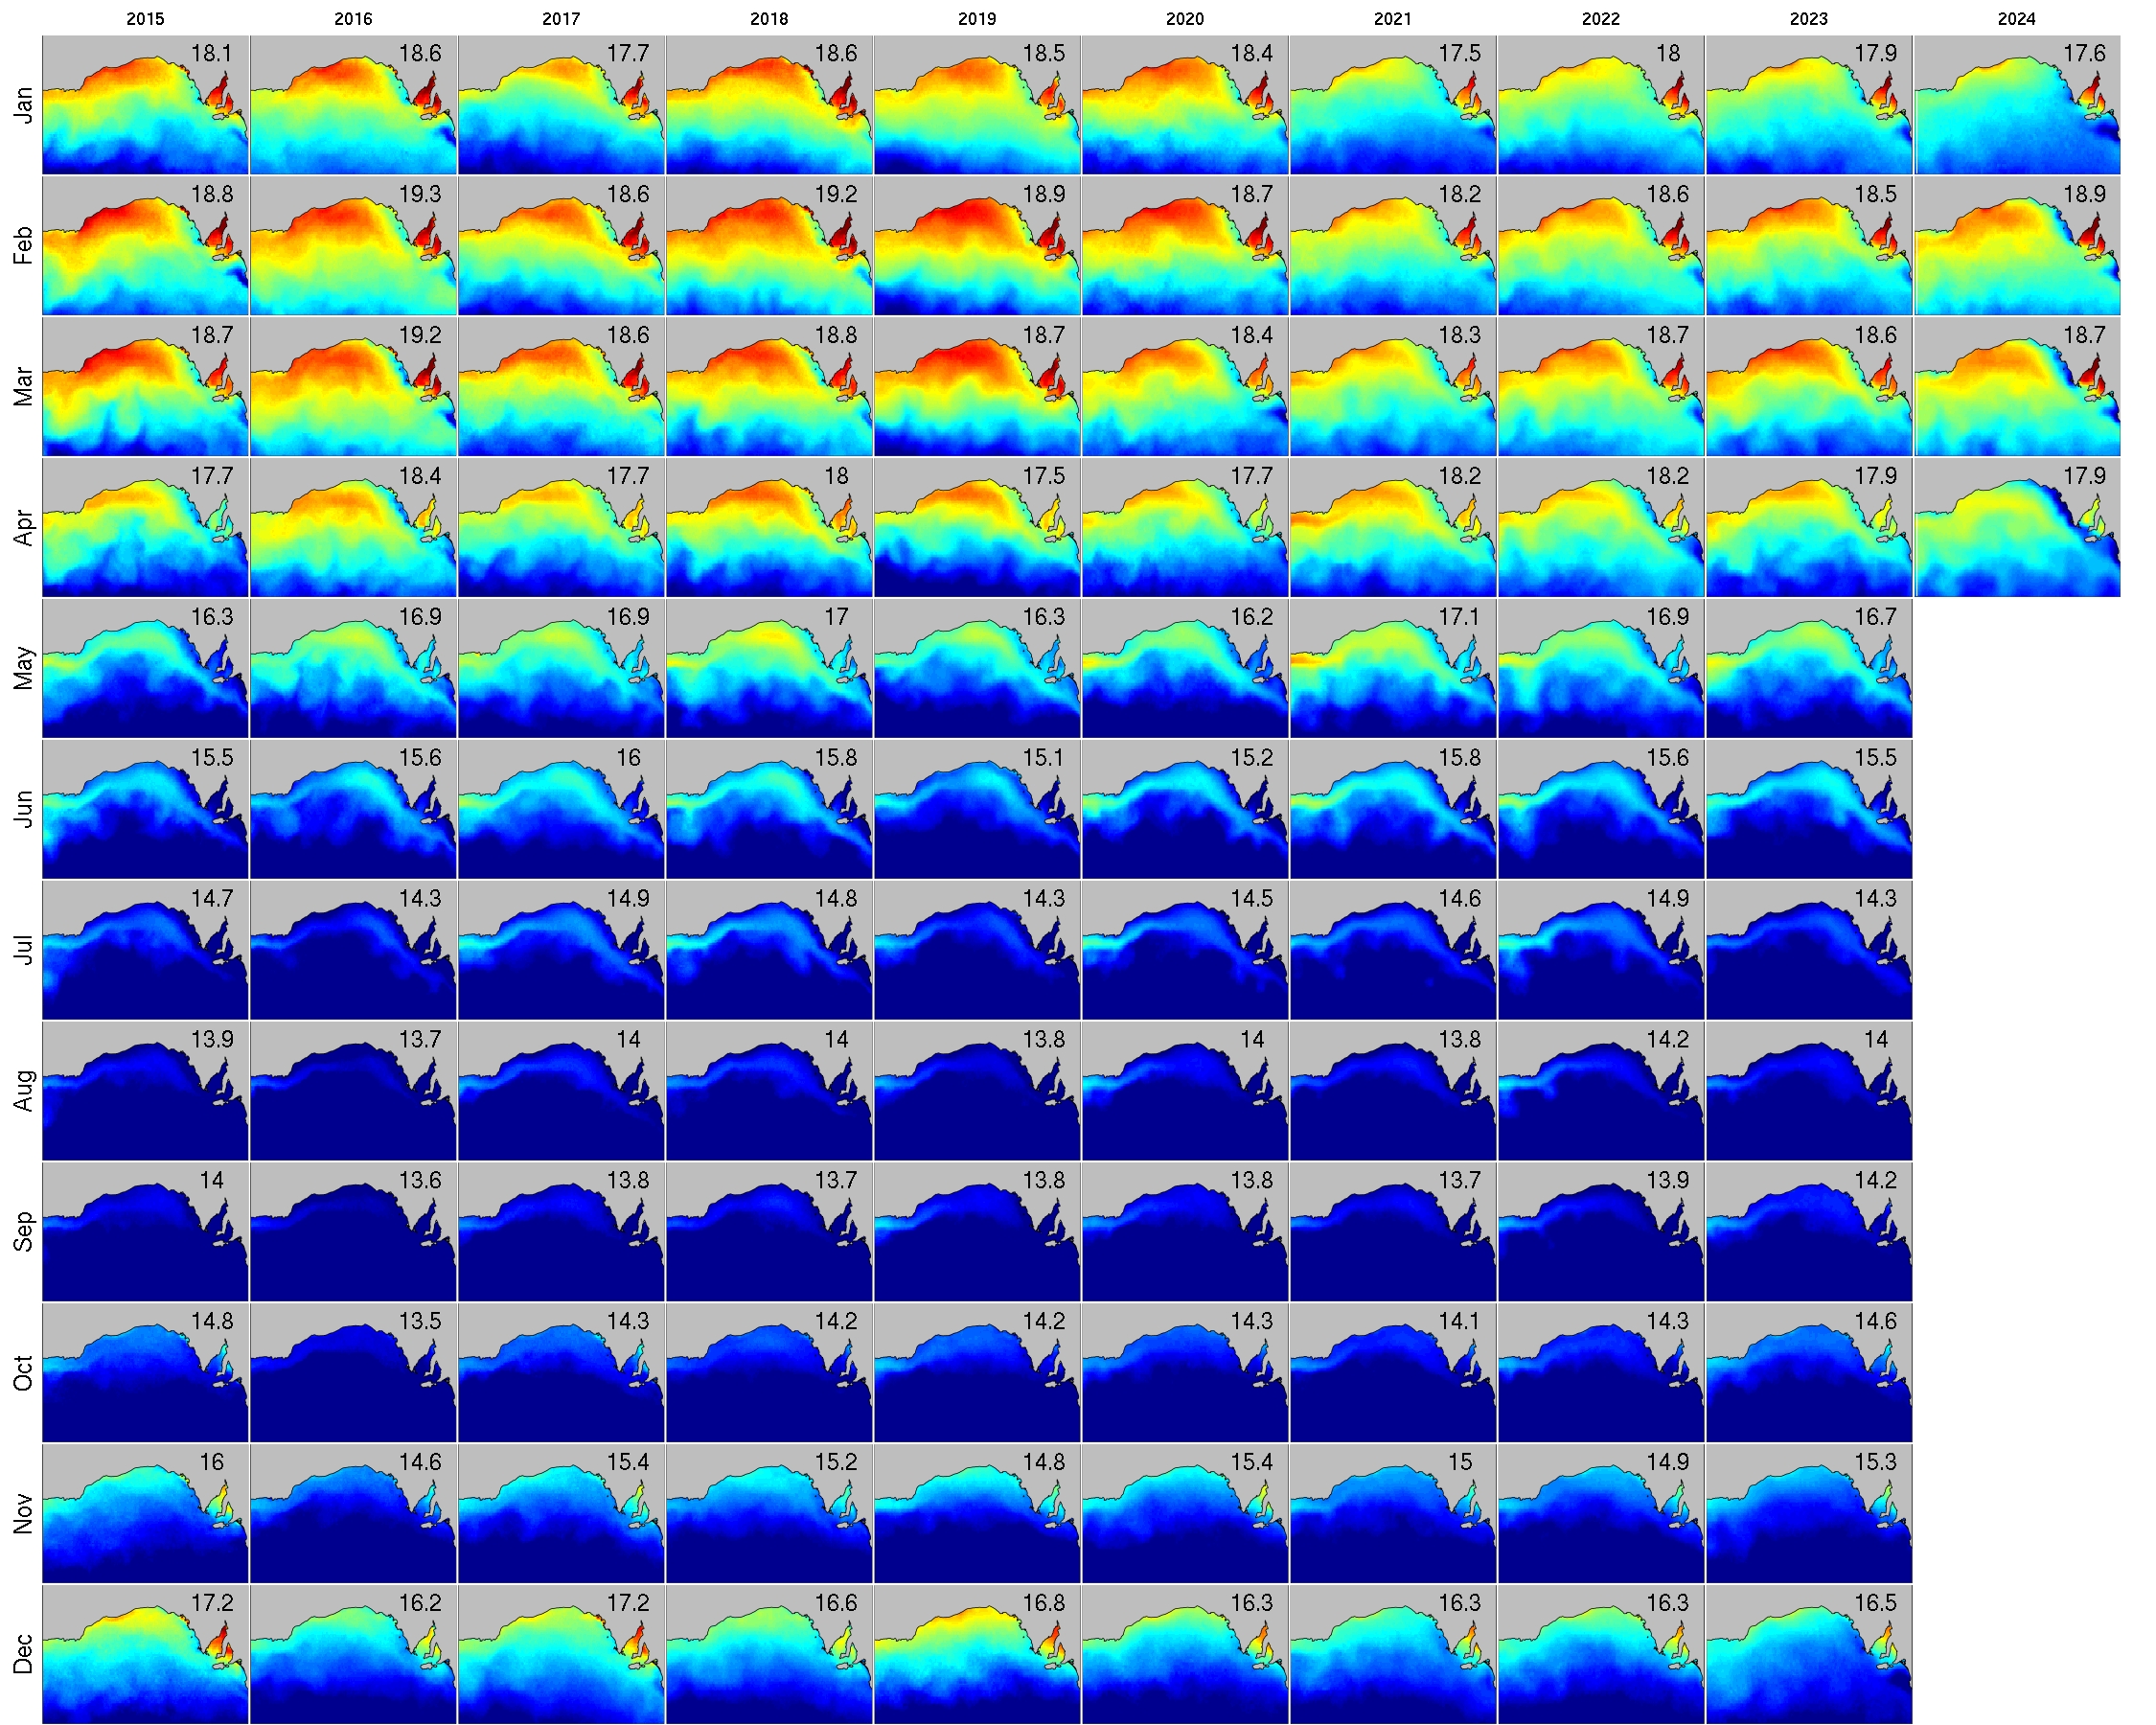
Monthly SST over past 10 years
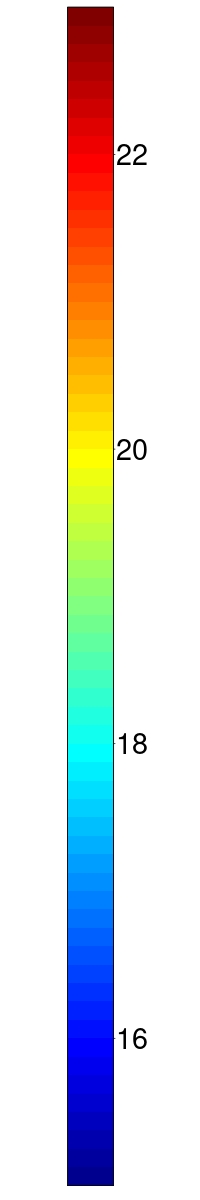
Maps showing historical SST in the GAB by month (rows) and year (columns) over the past 10 years. The number in the top right corner gives the mean SST (°C) over the month and area shown.
Back