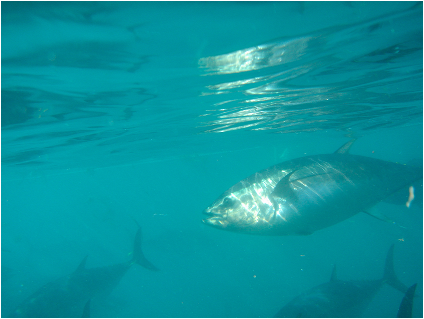
Observed conditions in the Great Australian Bight
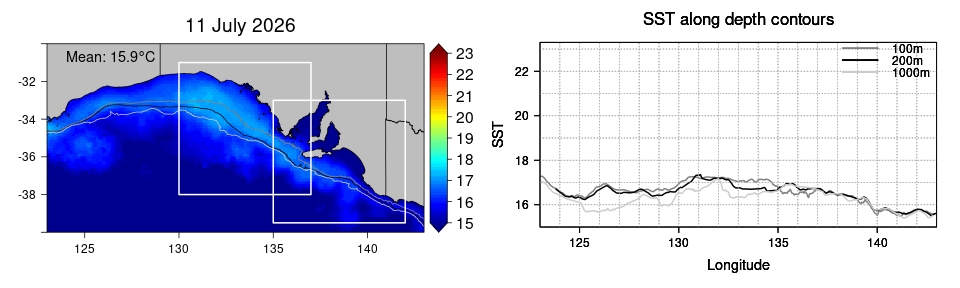
Sea surface temperature:
Left: SST (°C) for the most recent day available (source: GHRSST ). White boxes outline areas shown in close-up maps. Right: SST along the 100 m (dark grey), 200 m (black) and 1000 m (light grey) depth contours.
 Close-ups
The bigger picture
Close-ups
The bigger picture
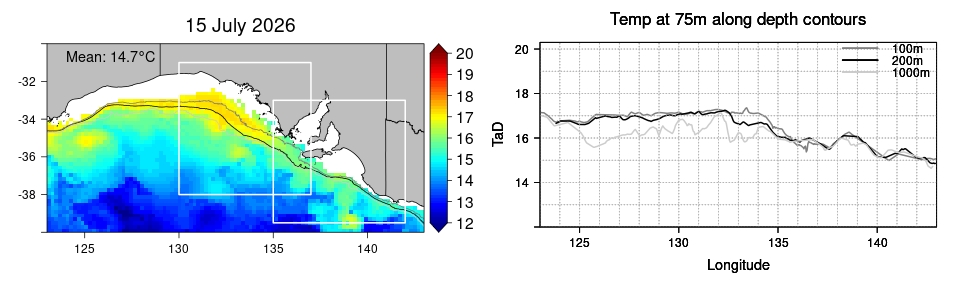
Temperature at 75 m depth:
Left: Temperature at 75 m depth (°C) for the most recent day available (source: CSIRO synTS ). White boxes outline areas shown in close-up maps. Right: Temperature at 75 m depth along the 100 m (dark grey), 200 m (black) and 1000 m (light grey) depth contours.
 Close-ups
The bigger picture
Close-ups
The bigger picture
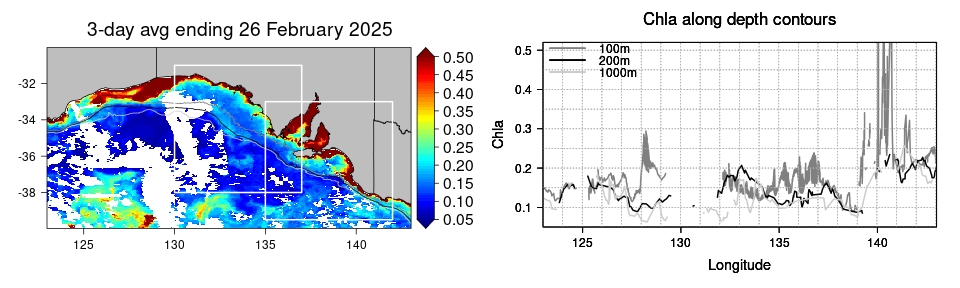
Chlorophyll a:
Left: Chlorophyll a (mg/m3) for the most recent 3-day period available (source: MODIS). White boxes outline areas for close-up maps. Note that values > 0.5 appear as dark red, and areas of white indicate no data are available. Right: Chlorophyll a along the 100 m (dark grey), 200 m (black) and 1000 m (light grey) depth contours.
 Close-ups
The bigger picture
Close-ups
The bigger picture
Ocean currents:
For a map of the most recently available ocean currents in the eastern GAB, provided by the Bureau of Meteorology, click here.