Survey details and related metadata, reports, events and data.
SO 5/85 (alternative identifier: SO198505)
Period: 1985-09-12 00:00 to 1985-10-09 00:00 Local
Duration: 27.00 days
Region: Tasmania, Bass Strait, Vic, NSW, Qld
Ship: Soela [details]
Description: Soela cruise SO 5/85 was undertaken for a fish and larval survey including biological oceanography in waters off the Tasmanian coast, Bass Strait, Victorian, New South Wales and Queensland coasts. Leg 1 cruise objectives were to conduct deployment trials and testing of CTD. Ichthyoplankton sampling on established transects around Tasmania and routine hydrology and plankton studies on those transects. In addition, two thermosalinograph transects 10 nm either side of and parallel to transect 5 (off Sandy Cape). Additional sampling in the vicinity of Gabo Island and at selected stations on the west coast of Tasmania and in Storm Bay. To examine the surface temperature - salinity structure in the vicinity of Sandy Cape. To sample ripe Blue Grenadier on the west coast for larval rearing studies and demersal fish on the west coast for taxonomic purposes. To sample demersal fish for MSL as part of an ongoing biological programme and to carry out routine seabird observations. Leg 2 cruise objectives were to measure 14 C production by autotrophs in oligotrophic temperate and subtropical waters, and heterotrophic production rates in temperate and subtropical waters. To measure the levels of chlorophyll, POC, DOC, and nutrients and correlate these with the autotrophic and heterotrophic productivity results. To compare particle size distributions of phytoplankton and zooplankton in oligotrophic temperate and subtropical waters. To determine the latitudinal distribution of pontellid copepods and foraminifera along 155 E. To continue routine seabird observations, and to conduct a brief census of seabirds on Cato Island.
Leader: B. Bruce & F.B. Griffiths (CSIRO)
Project: "Soela" fish surveys, 1980s [details]
Voyage extents: 43° 34.4' S to 18° 08.0' S 143° 40.1' E to 156° 13.6' E
Marlin Metadata:-
Metadata from OBIS Australia datasets:- biological data is published via the OBIS-AU IPT server and delivered to one or more of OBIS, ALA and GBIF
Download from OBIS Australia IPT View at - Ocean Biodiversity Information System (OBIS) Atlas of Living Australia (ALA) GBIF
Participants:- no records
Marine National Facility Reports - plans, summaries and data processing
- View the Survey plan - includes objectives, investigator details, proposed data collection, voyage track and equipment to be used.
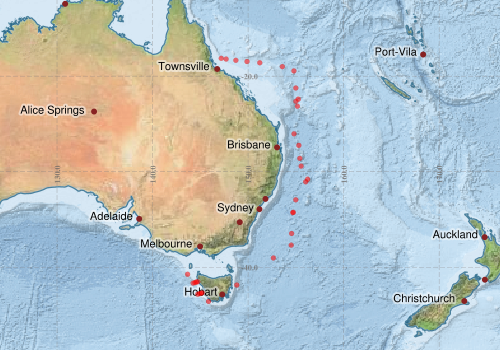
- There is no map for this survey.
Search for publications, reports and datasets from this and other voyages
Data publishing
This is a list of online datasets hosted by CSIRO. Other processed datasets hosted by collaborating organisations may be found on the 'Metadata' or "Reports, Publications and Maps' tab.
Use the Get data link on the right to extract data using the NCMI Data Trawler.
| Data Stream | Data Summary | Get data | ||||||||||||
|---|---|---|---|---|---|---|---|---|---|---|---|---|---|---|
| Marine biodiversity observations and/or samples |
|
Get Data from Trawler |
||||||||||||
| CTD profile |
|
Get Data from Trawler |
||||||||||||
| Hydrology |
|
Get Data from Trawler |
Deployments by start time:- Click on column header to sort. Use link on 'Deployment' to see full details. Use the CSV button at the bottom to export data (tab delimited).
Search for deployments from this voyage and others
| Deployment | Operation | Station | Cast | Gear | Project | Start and end times | Start Location | End Location | Depth range | Max Depth | Description | |||
|---|---|---|---|---|---|---|---|---|---|---|---|---|---|---|
| Hydrology Cast [details] | 1 | 35 | 1985-09-13 07:53 | 1985-09-13 08:22 | -43.5730 | 145.8577 | 203 | |||||||
| Hydrology Cast [details] | 1 | 35 | 1985-09-13 19:35 | 1985-09-13 20:00 | -42.6828 | 145.2038 | 73 | |||||||
| Hydrology Cast [details] | 1 | 35 | 1985-09-13 21:24 | 1985-09-13 21:48 | -42.7148 | 145.0635 | 93 | |||||||
| Hydrology Cast [details] | 1 | 35 | 1985-09-14 03:35 | 1985-09-14 03:57 | -42.8252 | 144.7268 | 493 | |||||||
| Hydrology Cast [details] | 1 | 35 | 1985-09-14 16:15 | 1985-09-14 16:56 | -41.6598 | 144.2410 | 976 | |||||||
| Hydrology Cast [details] | 1 | 35 | 1985-09-14 20:30 | 1985-09-14 20:55 | -41.6095 | 144.4398 | 136 | |||||||
| Hydrology Cast [details] | 1 | 35 | 1985-09-14 23:10 | 1985-09-14 23:34 | -41.5452 | 144.5778 | 75 | |||||||
| Hydrology Cast [details] | 1 | 35 | 1985-09-14 23:55 | 1985-09-15 00:26 | -42.7520 | 144.9503 | 206 | |||||||
| Hydrology Cast [details] | 1 | 35 | 1985-09-15 01:03 | 1985-09-15 01:20 | -41.5157 | 144.7318 | 54 | |||||||
| Hydrology Cast [details] | 1 | 35 | 1985-09-16 00:50 | 1985-09-16 01:35 | -40.7347 | 143.6683 | 95 | |||||||
| CTD Cast / Hydrology [details] | 1 | Cast 11 | CTD 3,Conductivity CTD 3,Pressure CTD 3,Temperature CTD 3 | 35 | 1985-09-22 07:28 | 1985-09-22 07:50 | -41.8653 | 148.8130 | -41.8500 | 148.8000 | 972 | |||
| CTD Cast / Hydrology [details] | 1 | Cast 12 | CTD 3,Conductivity CTD 3,Pressure CTD 3,Temperature CTD 3 | 35 | 1985-09-28 06:05 | 1985-09-28 06:21 | -39.0298 | 152.6467 | -39.0303 | 152.6473 | 987 | |||
| Hydrology Cast [details] | 1 | 35 | 1985-09-28 20:04 | 1985-09-28 21:05 | -37.6863 | 154.5137 | -37.6865 | 154.5137 | 921 | |||||
| CTD Cast / Hydrology [details] | 1 | Cast 14 | CTD 3,Conductivity CTD 3,Pressure CTD 3,Temperature CTD 3 | 35 | 1985-09-29 05:07 | 1985-09-29 05:26 | -36.4638 | 154.5560 | -36.4642 | 154.5565 | 975 | |||
| Hydrology Cast [details] | 1 | 35 | 1985-09-29 18:33 | 1985-09-29 19:21 | -34.2853 | 154.6740 | -34.2862 | 154.6763 | 951 | |||||
| CTD Cast / Hydrology [details] | 1 | Cast 16 | CTD 3,Conductivity CTD 3,Pressure CTD 3,Temperature CTD 3 | 35 | 1985-09-29 19:47 | 1985-09-29 20:06 | -34.2497 | 154.7327 | -34.2425 | 154.7288 | 839 | |||
| CTD Cast / Hydrology [details] | 1 | Cast 17 | CTD 3,Conductivity CTD 3,Pressure CTD 3,Temperature CTD 3 | 35 | 1985-09-30 05:21 | 1985-09-30 05:39 | -32.9368 | 154.9915 | -32.9375 | 154.9928 | 916 | |||
| CTD Cast / Hydrology [details] | 1 | Cast 18 | CTD 3,Conductivity CTD 3,Pressure CTD 3,Temperature CTD 3 | 35 | 1985-09-30 20:53 | 1985-09-30 21:12 | -31.0543 | 156.0277 | -31.0542 | 156.0277 | 1006 | |||
| CTD Cast / Hydrology [details] | 1 | Cast 19 | CTD 3,Conductivity CTD 3,Pressure CTD 3,Temperature CTD 3 | 35 | 1985-10-01 05:23 | 1985-10-01 05:27 | -30.7865 | 156.2272 | -30.7902 | 156.2148 | 243 | |||
| CTD Cast / Hydrology [details] | 1 | Cast 22 | CTD 3,Conductivity CTD 3,Pressure CTD 3,Temperature CTD 3 | 35 | 1985-10-01 20:13 | 1985-10-01 20:32 | -29.4142 | 155.5500 | -29.4147 | 155.5503 | 996 | |||
| CTD Cast / Hydrology [details] | 1 | Cast 23 | CTD 3,Conductivity CTD 3,Pressure CTD 3,Temperature CTD 3 | 35 | 1985-10-02 05:52 | 1985-10-02 06:09 | -28.6015 | 155.4135 | 999 | |||||
| CTD Cast / Hydrology [details] | 1 | Cast 26 | CTD 3,Conductivity CTD 3,Pressure CTD 3,Temperature CTD 3 | 35 | 1985-10-02 20:07 | 1985-10-02 20:29 | -27.2433 | 155.3137 | -27.2575 | 155.2603 | 990 | |||
| CTD Cast / Hydrology [details] | 1 | Cast 27 | CTD 3,Conductivity CTD 3,Pressure CTD 3,Temperature CTD 3 | 35 | 1985-10-03 05:14 | 1985-10-03 05:32 | -26.0333 | 154.8055 | -26.0328 | 154.8058 | 971 | |||
| CTD Cast / Hydrology [details] | 1 | Cast 30 | CTD 3,Conductivity CTD 3,Pressure CTD 3,Temperature CTD 3 | 35 | 1985-10-03 20:08 | 1985-10-03 20:29 | -22.4075 | 155.2527 | -24.3740 | 155.2528 | 873 | |||
| CTD Cast / Hydrology [details] | 1 | Cast 31 | CTD 3,Conductivity CTD 3,Pressure CTD 3,Temperature CTD 3 | 35 | 1985-10-04 05:06 | 1985-10-04 05:29 | -23.1482 | 155.1632 | -23.1468 | 155.1625 | 837 | |||
| CTD Cast / Hydrology [details] | 1 | Cast 34 | CTD 3,Conductivity CTD 3,Pressure CTD 3,Temperature CTD 3 | 35 | 1985-10-05 19:30 | 1985-10-05 19:48 | -22.6325 | 155.0040 | -22.6375 | 154.9603 | 879 | |||
| CTD Cast / Hydrology [details] | 1 | Cast 35 | CTD 3,Conductivity CTD 3,Pressure CTD 3,Temperature CTD 3 | 35 | 1985-10-06 05:12 | 1985-10-06 05:30 | -21.2368 | 154.9957 | -21.2130 | 154.9847 | 797 | |||
| CTD Cast / Hydrology [details] | 1 | Cast 36 | CTD 3,Conductivity CTD 3,Pressure CTD 3,Temperature CTD 3 | 35 | 1985-10-06 20:04 | 1985-10-06 20:21 | -19.4553 | 154.7933 | 978 | |||||
| CTD Cast / Hydrology [details] | 1 | Cast 37 | CTD 3,Conductivity CTD 3,Pressure CTD 3,Temperature CTD 3 | 35 | 1985-10-07 05:06 | 1985-10-07 05:29 | -19.0010 | 153.5847 | -18.9995 | 153.5853 | 947 | |||
| CTD Cast / Hydrology [details] | 1 | Cast 38 | CTD 3,Conductivity CTD 3,Pressure CTD 3,Temperature CTD 3 | 35 | 1985-10-07 20:08 | 1985-10-07 20:26 | -18.5963 | 151.2210 | 972 | |||||
| CTD Cast / Hydrology [details] | 1 | Cast 39 | CTD 3,Conductivity CTD 3,Pressure CTD 3,Temperature CTD 3 | 35 | 1985-10-08 05:06 | 1985-10-08 05:24 | -18.4668 | 149.8867 | -18.4667 | 149.8868 | 982 | |||
| CTD Cast / Hydrology [details] | 1 | Cast 40 | CTD 3,Conductivity CTD 3,Pressure CTD 3,Temperature CTD 3 | 35 | 1985-10-08 13:04 | 1985-10-08 13:18 | -18.3402 | 148.7173 | -18.3377 | 148.7170 | 980 | |||
| CTD Cast / Hydrology [details] | 1 | Cast 41 | CTD 3,Conductivity CTD 3,Pressure CTD 3,Temperature CTD 3 | 35 | 1985-10-08 20:04 | 1985-10-08 20:19 | -18.2080 | 147.7017 | -18.2167 | 147.7025 | 895 | |||
| Hydrology Cast [details] | 1 | 35 | 1985-10-09 05:45 | 1985-10-09 05:45 | -18.1328 | 147.1892 | -18.2137 | 147.7017 | 31 | |||||