Survey details and related metadata, reports, events and data.
SS 02/99 (alternative identifier: SS199902)
Period: 1999-02-06 00:00 to 1999-02-14 00:00 UTC
Duration: 8.00 days
From: Hobart To: Hobart
Region: W Tasmania (Cape Grim)/Southern Ocean
Ship: Southern Surveyor [details]
Description: (information from cruise plan) Southern Surveyor cruise SS 02/99 will be carried out in waters off Cape Grim and in the Southern Ocean. The cruise is designed to improve understanding of the timing and factors regulating the oceanic uptake of carbon dioxide in the sub-Antartic Zone. The cruise will focus on improving understanding of the regional variability in upper ocean biogeochemical properties (CO2, pigments, O2, and nutrients) and linking surface ocean flux estimates to atmospheric measurements of CO2 in the boundary layer near Cape Grim. Cruise objectives include to contribute to a better understanding of the carbon source/sink distributions in the region and the physical and biological controls on carbon uptake in the sub-Antartic zone. Southern Surveyor will coordinate work off Cape Grim with aircraft sampling to better understand the link between air-sea exchange and the drawdown in C02 in the atmospheric boundary layer at Cape Grim. To sample biogeochemical properties for summer conditions over a sediment trap mooring located at 46 degrees 45.52' S 142 degrees 05.38'E. CTD casts and aquashuttle tows will be carried out. This cruise will complement work done in the same region on Southern Surveyor in spring 1995 (SS 11/95), and on Aurora Australis in late summer, 1998.
Leader: B. Tilbrook (CSIRO)
Project: Marine Carbon Cycles 1997-2000 [details]
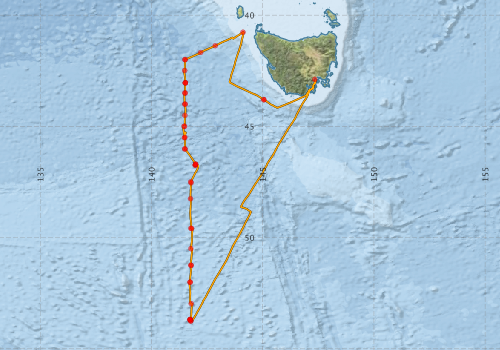
Voyage extents: 53° 45.1' S to 40° 44.9' S 141° 25.0' E to 147° 22.6' E Get voyage track shapefile Get CSV
Marlin Metadata:-
Participants - on ship:-
| Name | Role | Organisation |
|---|---|---|
| no docs found | CSIRO Oceans & Atmosphere - Hobart |
This list includes those that may have only been on part of the voyage. See voyage reports on 'Reports and Maps' tab for details.
Marine National Facility Reports - plans, summaries and data processing
-
SS199902 Voyage Summary
- includes preliminary results, voyage narrative, types of data collected with C77/ROSCOP codes.
-
SS199902 Voyage Plan
- includes objectives, investigator details, proposed data collection, voyage track and equipment to be used.
-

Publications, reports and datasets from this voyage.
Journal Article
- Baldry, Kimberlee,Johnson, Robert,Strutton, Peter G.,Boyd, Philip W. (2024) A biological ocean data reformatting effort. Scientific Data 11 pp-. 10.1038/s41597-024-03038-0
- Moy, Andrew D.,Howard, William R.,Bray, Stephen G.,Trull, Thomas W. (2009) Reduced calcification in modern Southern Ocean planktonic foraminifera. Nature Geoscience 2 pp276-280. 10.1038/ngeo460
- Rigual-Hernández, A. S.,Trull, T. W.,Bray, S. G.,Cortina, A.,Armand, L. K. (2015) Latitudinal and temporal distributions of diatom populations in the pelagic waters of the Subantarctic and Polar Frontal zones of the Southern Ocean and their role in the biological pump. Biogeosciences 12 pp5309-5337. 10.5194/bg-12-5309-2015
- Rigual-Hernández, Andrés S.,Trull, Thomas W.,Bray, Stephen G.,Armand, Leanne K. (2016) The fate of diatom valves in the Subantarctic and Polar Frontal Zones of the Southern Ocean: Sediment trap versus surface sediment assemblages. Palaeogeography, Palaeoclimatology, Palaeoecology 457 pp129-143. 10.1016/j.palaeo.2016.06.004
- Rigual-Hernández, Andrés S.,Trull, Thomas W.,McCartney, Kevin,Ballegeer, Anne-Marie,Lawler, Kelly-Anne,Bray, Stephen G.,Armand, Leanne K. (2016) Indices based on silicoflagellate assemblages offer potential for paleo-reconstructions of the main oceanographic zones of the Southern Ocean. Geo-Marine Letters 36 pp271-280. 10.1007/s00367-016-0444-8
Search for publications, reports and datasets from this and other voyages
Data publishing
This is a list of online datasets hosted by CSIRO. Other processed datasets hosted by collaborating organisations may be found on the 'Metadata' or "Reports, Publications and Maps' tab.
Use the Get data link on the right to extract data using the NCMI Data Trawler.
| Data Stream | Data Summary | Get data | ||||||||||||
|---|---|---|---|---|---|---|---|---|---|---|---|---|---|---|
| CTD profile |
|
Get Data from Trawler Download dataset 1.4 / 0.33 Mb Processing report for this dataset |
||||||||||||
| Hydrology |
|
Get Data from Trawler Download dataset 0.02/0.005 Mb Processing report for this dataset |
||||||||||||
| Underway |
|
Get Data from Trawler |
| ID | When (UTC) | Lat | Long | Instrument | Identifier | Action | Log | Subject / Comment |
|---|
Deployments by start time:- Click on column header to sort. Use link on 'Deployment' to see full details. Use the CSV button at the bottom to export data (tab delimited).
Search for deployments from this voyage and others
| Deployment | Operation | Station | Cast | Gear | Project | Start and end times | Start Location | End Location | Depth range | Max Depth | Description | |||
|---|---|---|---|---|---|---|---|---|---|---|---|---|---|---|
| Underway System [details] | Doppler speed log,Licor-UWQ 3708,RM Young 05103 wind monitor,RM Young 05103 wind monitor,RM Young 05103 wind monitor,RM Young 05103 wind monitor,RM Young 05103 wind monitor,Sperry gyrocompass,Temperature sensor-41342,ThermoSalinoGraph (TSG)-SS-SN 1777,ThermoSalinoGraph (TSG)-SS-SN 1777 | 1302 | 1999-02-05 00:00 | 1999-02-16 23:59 | -42.8860 | 147.3390 | -42.9318 | 147.3720 | ||||||
| CTD Cast [details] | 1 | Cast 1 | 1302 | 1999-02-06 02:14 | 1999-02-06 03:00 | -43.8035 | 145.0478 | -43.7953 | 145.0433 | 0 | ||||
| CTD Cast / Hydrology [details] | 1 | Cast 2 | 1302 | 1999-02-06 03:38 | 1999-02-06 04:11 | -43.7907 | 145.0425 | -43.7830 | 145.0425 | 0 | ||||
| CTD Cast / Hydrology [details] | 1 | Cast 3 | 1302 | 1999-02-07 03:34 | 1999-02-07 04:01 | -40.7668 | 144.1108 | -40.7683 | 144.1102 | 0 | ||||
| CTD Cast / Hydrology [details] | 1 | Cast 4 | 1302 | 1999-02-07 16:22 | 1999-02-07 17:09 | -41.3713 | 142.8627 | -41.3793 | 142.8483 | 0 | ||||
| CTD Cast / Hydrology [details] | 1 | Cast 5 | 1302 | 1999-02-07 21:37 | 1999-02-07 22:34 | -41.6750 | 142.2065 | -41.6858 | 142.2152 | 0 | ||||
| CTD Cast [details] | 1 | Cast 6 | 1302 | 1999-02-08 02:40 | 1999-02-08 02:58 | -42.0010 | 141.5015 | -41.9985 | 141.5052 | 0 | ||||
| CTD Cast / Hydrology [details] | 1 | Cast 7 | 1302 | 1999-02-08 03:33 | 1999-02-08 04:14 | -41.9933 | 141.5097 | -41.9888 | 141.5142 | 0 | ||||
| CTD Cast / Hydrology [details] | 1 | Cast 8 | 1302 | 1999-02-08 09:30 | 1999-02-08 10:20 | -42.4885 | 141.4883 | -42.4807 | 141.4783 | 0 | ||||
| CTD Cast [details] | 1 | Cast 9 | 1302 | 1999-02-08 14:37 | 1999-02-08 14:51 | -43.0480 | 141.5155 | -43.0440 | 141.5158 | 0 | ||||
| CTD Cast [details] | 1 | Cast 10 | 1302 | 1999-02-08 15:26 | 1999-02-08 15:39 | -43.0397 | 141.5203 | -43.0380 | 141.5213 | 0 | ||||
| CTD Cast / Hydrology [details] | 1 | Cast 11 | 1302 | 1999-02-08 16:25 | 1999-02-08 17:11 | -43.0318 | 141.5230 | -43.0202 | 141.5253 | 0 | ||||
| CTD Cast [details] | 1 | Cast 12 | 1302 | 1999-02-08 20:43 | 1999-02-08 20:54 | -43.5027 | 141.5047 | -43.4963 | 141.5043 | 0 | ||||
| CTD Cast / Hydrology [details] | 1 | Cast 13 | 1302 | 1999-02-08 21:14 | 1999-02-08 22:03 | -43.4902 | 141.5017 | -43.4772 | 141.4922 | 0 | ||||
| CTD Cast [details] | 1 | Cast 14 | 1302 | 1999-02-09 01:53 | 1999-02-09 02:07 | -44.0005 | 141.5037 | -43.9993 | 141.5075 | 0 | ||||
| CTD Cast / Hydrology [details] | 1 | Cast 15 | 1302 | 1999-02-09 02:50 | 1999-02-09 03:46 | -43.9963 | 141.5055 | -43.9943 | 141.5012 | 0 | ||||
| CTD Cast / Hydrology [details] | 1 | Cast 16 | 1302 | 1999-02-09 07:07 | 1999-02-09 07:54 | -44.5020 | 141.4975 | -44.5133 | 141.4922 | 0 | ||||
| CTD Cast [details] | 1 | Cast 17 | 1302 | 1999-02-09 11:04 | 1999-02-09 11:26 | -44.9990 | 141.4845 | -44.9972 | 141.4732 | 0 | ||||
| CTD Cast / Hydrology [details] | 1 | Cast 18 | 1302 | 1999-02-09 12:01 | 1999-02-09 12:58 | -44.9940 | 141.4562 | -44.9988 | 141.4255 | 0 | ||||
| CTD Cast [details] | 1 | Cast 19 | 1302 | 1999-02-09 16:48 | 1999-02-09 17:03 | -45.4963 | 141.4957 | -45.4992 | 141.4892 | 0 | ||||
| CTD Cast / Hydrology [details] | 1 | Cast 20 | 1302 | 1999-02-09 17:51 | 1999-02-09 18:42 | -45.5085 | 141.4743 | -45.5188 | 141.4620 | 0 | ||||
| CTD Cast [details] | 1 | Cast 21 | 1302 | 1999-02-10 01:06 | 1999-02-10 01:21 | -46.0143 | 141.5030 | -46.0140 | 141.4988 | 0 | ||||
| CTD Cast / Hydrology [details] | 1 | Cast 22 | 1302 | 1999-02-10 02:02 | 1999-02-10 02:53 | -46.0125 | 141.4920 | -46.0055 | 141.4802 | 0 | ||||
| CTD Cast [details] | 1 | Cast 23 | 1302 | 1999-02-10 08:10 | 1999-02-10 08:26 | -46.6953 | 141.9833 | -46.6985 | 141.9813 | 0 | ||||
| CTD Cast / Hydrology [details] | 1 | Cast 24 | 1302 | 1999-02-10 08:57 | 1999-02-10 09:50 | -46.7043 | 141.9768 | -46.7162 | 141.9703 | 0 | ||||
| CTD Cast [details] | 1 | Cast 25 | 1302 | 1999-02-10 11:07 | 1999-02-10 11:25 | -46.7350 | 141.9655 | -46.7408 | 141.9655 | 0 | ||||
| CTD Cast [details] | 1 | Cast 26 | 1302 | 1999-02-10 11:51 | 1999-02-10 12:48 | -46.7470 | 141.9643 | -46.7607 | 141.9580 | 0 | ||||
| CTD Cast [details] | 1 | Cast 27 | 1302 | 1999-02-11 10:01 | 1999-02-11 10:18 | -47.4952 | 141.7638 | -47.4970 | 141.7708 | 0 | ||||
| CTD Cast / Hydrology [details] | 1 | Cast 28 | 1302 | 1999-02-11 10:56 | 1999-02-11 11:50 | -47.5387 | 141.7768 | -47.5415 | 141.7973 | 0 | ||||
| CTD Cast / Hydrology [details] | 1 | Cast 29 | 1302 | 1999-02-11 16:05 | 1999-02-11 16:53 | -48.2505 | 141.7497 | -48.2528 | 141.7618 | 0 | ||||
| CTD Cast [details] | 1 | Cast 30 | 1302 | 1999-02-12 00:36 | 1999-02-12 00:49 | -49.5810 | 141.7680 | -49.5847 | 141.7782 | 0 | ||||
| CTD Cast / Hydrology [details] | 1 | Cast 31 | 1302 | 1999-02-12 01:23 | 1999-02-12 02:14 | -49.5903 | 141.8005 | -49.5973 | 141.8358 | 0 | ||||
| CTD Cast / Hydrology [details] | 1 | Cast 32 | 1302 | 1999-02-12 07:39 | 1999-02-12 08:26 | -50.4963 | 141.7665 | -50.5018 | 141.8048 | 0 | ||||
| CTD Cast [details] | 1 | Cast 33 | 1302 | 1999-02-12 12:56 | 1999-02-12 13:15 | -51.2397 | 141.7627 | -51.2442 | 141.7735 | 0 | ||||
| CTD Cast / Hydrology [details] | 1 | Cast 34 | 1302 | 1999-02-12 13:45 | 1999-02-12 14:40 | -51.2498 | 141.7843 | -51.2575 | 141.8063 | 0 | ||||
| CTD Cast [details] | 1 | Cast 35 | 1302 | 1999-02-12 19:23 | 1999-02-12 19:36 | -52.0010 | 141.7400 | -52.0028 | 141.7355 | 0 | ||||
| CTD Cast / Hydrology [details] | 1 | Cast 36 | 1302 | 1999-02-12 19:54 | 1999-02-12 20:41 | -52.0050 | 141.7278 | -52.0143 | 141.7195 | 0 | ||||
| CTD Cast / Hydrology [details] | 1 | Cast 37 | 1302 | 1999-02-13 02:26 | 1999-02-13 03:24 | -52.9675 | 141.7867 | -52.9837 | 141.8340 | 0 | ||||
| CTD Cast [details] | 1 | Cast 38 | 1302 | 1999-02-13 07:45 | 1999-02-13 08:03 | -53.6953 | 141.7288 | -53.6952 | 141.7380 | 0 | ||||
| CTD Cast / Hydrology [details] | 1 | Cast 39 | 1302 | 1999-02-13 08:42 | 1999-02-13 09:30 | -53.6945 | 141.7465 | -53.6893 | 141.7477 | 0 | ||||
| CTD Cast [details] | 1 | Cast 40 | 1302 | 1999-02-13 10:41 | 1999-02-13 10:58 | -53.6820 | 141.7378 | -53.6803 | 141.7358 | 0 | ||||
| CTD Cast [details] | 1 | Cast 41 | 1302 | 1999-02-13 11:34 | 1999-02-13 12:42 | -53.6778 | 141.7303 | -53.6703 | 141.7107 | 0 | ||||
| CTD Cast [details] | 1 | Cast 42 | 1302 | 1999-02-13 16:09 | 1999-02-13 16:49 | -53.7435 | 141.7652 | -53.7473 | 141.7815 | 0 | ||||
| CTD Cast / Hydrology [details] | 1 | Cast 43 | 1302 | 1999-02-13 17:43 | 1999-02-13 18:19 | -53.7480 | 141.7630 | -53.7507 | 141.7780 | 0 | ||||