Please login if you have access to particular applications.
Provider: All providers | |
Coastal Shelfs 0-200m | |
| Name: | 0-40 m New South Wales |
| Region: | Temperate east |
| Area: | not set |
| Data aggregated on 2026-02-20 13:10 | |
The following is the list of gear types used within this region. Click on 'gear type' for a detailed report of that gear.
| Gear Type | Code | Map colour | Layers used | Summary |
|---|---|---|---|---|
| ocean based acoustic current meter | OB_ACM | ■ |
NOAA drifting buoys (map) CSIRO NCMI Acoustic Doppler Current Profiler data - link to layer metadata |
Records - 46 Deepest: db,Records - 790 Deepest: db |
| multibeam sonar | MBS | ■ |
SBP120 sub bottom profiler MNF singlebeam TOPAS sub-bottom profiler |
Records - 86 Deepest: db |
| Water quality and chemistry | WQ_C | ■ |
CMAR Hydrology - link to layer metadata Water Sampling - Port Jackson - link to layer metadata SRS Bio Optical DataBase - link to layer metadata |
Records - 305 Deepest: db,Records - 64 Deepest: db |
| CTD sensor | CTD | ■ |
aatams sattag dm location map - link to layer metadata New Zealand Fur Seal CTD Profiles - link to layer metadata ARGO profile map - link to layer metadata Completed Realtime Glider Deployments - link to layer metadata Australian Fur Seal CTD Profiles - link to layer metadata aatams sattag dm profile map - link to layer metadata aatams sattag dm dive profile map - link to layer metadata RAN CTD data New South Wales Coastal Study Data CMAR CTD Data Overview (1982 - present) - link to layer metadata CMAR Towed CTD - link to layer metadata |
Records - 251 Deepest: db,Records - 30 Deepest: db,Records - 183 Deepest: db |
| Glider | glider | ■ |
Completed Realtime Glider Deployments - link to layer metadata |
Records - 80 Deepest: db |
| demersal trawl or sled | DT_S | ■ |
CMAR Catch Operations Data overview (1965 to current) - link to layer metadata |
Records - 13 Deepest: db |
| remote or autonomous underwater video | R.A_UV | ■ |
AUV Deployments - link to layer metadata IMOS - Autonomous Underwater Vehicle (AUV) Facility - link to layer metadata IMOS - Autonomous Underwater Vehicle (AUV) Facility trajectory map - link to layer metadata |
Records - 240 Deepest: db |
| satellite tag | ST | ■ |
aatams sattag dm location map - link to layer metadata New Zealand Fur Seal CTD Profiles - link to layer metadata Australian Fur Seal CTD Profiles - link to layer metadata aatams sattag dm profile map - link to layer metadata aatams sattag dm dive profile map - link to layer metadata |
Records - 170 Deepest: db |
| Phytoplankton sample | PP | ■ |
Phytoplankton - Sydney Harbour - link to layer metadata |
Records - 1 Deepest: db |
| eXpendable BathyThermograph | XBT | ■ |
XBT Profile Data - link to layer metadata CMAR XBT profiles - link to layer metadata |
Records - 2 Deepest: db,Records - 2 Deepest: db |
| turtle nesting locations | TN | ■ | Records - 31 Deepest: db |
|
| Zooplankton samples | ZP | ■ |
The Australian Zooplankton Database (1938 onwards) - Data - link to layer metadata SOOP AusCPR zoop trajectory map - link to layer metadata |
Records - 77 Deepest: db,Records - 7 Deepest: db |
| sediment grab and core samples | SG | ■ |
Seabed sediments sampling Sediment Data - Broken Bay to Abyssal Plain - link to layer metadata CSIRO Sediment Sampling |
Records - 282 Deepest: db,Records - 1 Deepest: db,Records - 7 Deepest: db |
| diver visual | DV | ■ |
Long Term Temperate Reef Monitoring Program Site Surveys Reef Life Survey (RLS) Sites (http://reeflifesurvey.com) - link to layer metadata |
Records - 297 Deepest: db,Records - 258 Deepest: db |
| Continuous Plankton Recorder | CPR | ■ |
CPR Plankton Colour Index Survey - link to layer metadata |
Records - 5 Deepest: db |
| midwater acoustics | MW_A | ■ |
MNF singlebeam EK60 18-333 kHz (RV Investigator) MNF singlebeam EK60 38-120 kHz (Southern Surveyor) MNF singlebeam EK60 12kHz (Southern Surveyor) |
Records - 748 Deepest: db |
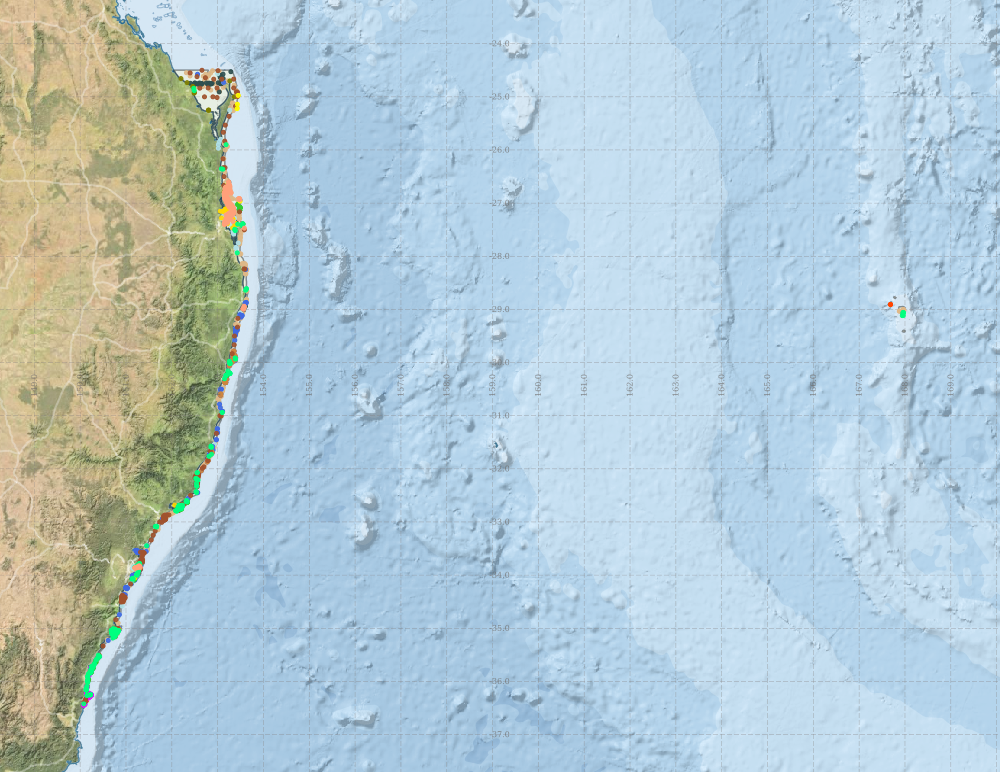
Region extents: 150° 03.2' E 36° 30.2' S to 168° 05.4' E 24° 29.9' S Refresh map
Acknowledgements: Background map - Bright Earth e-Atlas Basemap v1.0 (AIMS, GBRMPA, JCU, DSITIA, GA, UCSD, NASA, OSM, ESRI) CC BY
Time series plot (1930 to present) - Y axis is per year
Region data
Show data list
| Year | CPR | CTD | DT_S | DV | MBS | MW_A | OB_ACM | PP | R.A_UV | SG | ST | TN | WQ_C | XBT | ZP | glider |
| 1939 | 1 | |||||||||||||||
| 1940 | 1 | |||||||||||||||
| 1963 | 1 | |||||||||||||||
| 1964 | 1 | |||||||||||||||
| 1966 | 2 | |||||||||||||||
| 1968 | 2 | 7 | ||||||||||||||
| 1969 | 3 | |||||||||||||||
| 1970 | 31 | |||||||||||||||
| 1971 | 2 | 2 | ||||||||||||||
| 1972 | 34 | 1 | 19 | |||||||||||||
| 1973 | 1 | 22 | ||||||||||||||
| 1974 | 1 | 15 | ||||||||||||||
| 1975 | 2 | 12 | ||||||||||||||
| 1976 | 1 | 12 | ||||||||||||||
| 1978 | 4 | 2 | 1 | |||||||||||||
| 1980 | 1 | 1 | ||||||||||||||
| 1981 | 9 | |||||||||||||||
| 1982 | 8 | |||||||||||||||
| 1983 | 30 | 14 | ||||||||||||||
| 1984 | 20 | 22 | ||||||||||||||
| 1985 | 1 | |||||||||||||||
| 1986 | 5 | |||||||||||||||
| 1987 | 1 | |||||||||||||||
| 1988 | 8 | |||||||||||||||
| 1989 | 24 | 17 | 24 | |||||||||||||
| 1990 | 2 | 14 | 2 | 2 | 2 | |||||||||||
| 1991 | 1 | 1 | 4 | 1 | 1 | |||||||||||
| 1992 | 19 | 59 | 1 | 1 | 17 | |||||||||||
| 1993 | 17 | 2 | 61 | 17 | ||||||||||||
| 1994 | 17 | 5 | 31 | 17 | ||||||||||||
| 1995 | 8 | |||||||||||||||
| 1996 | 2 | 3 | 17 | 1 | 2 | |||||||||||
| 1997 | 2 | 6 | 1 | |||||||||||||
| 1998 | 8 | 168 | 8 | 2 | ||||||||||||
| 1999 | 21 | 48 | 1 | 21 | ||||||||||||
| 2000 | 23 | 1 | 1 | |||||||||||||
| 2001 | 24 | 13 | 1 | |||||||||||||
| 2002 | 1 | 9 | ||||||||||||||
| 2003 | 3 | 25 | 2 | 1 | 1 | |||||||||||
| 2004 | 4 | 27 | 56 | 1 | 1 | |||||||||||
| 2005 | 1 | 34 | 51 | 35 | 5 | |||||||||||
| 2006 | 1 | 49 | 2 | 3 | 5 | |||||||||||
| 2007 | 46 | 4 | 1 | 7 | ||||||||||||
| 2008 | 25 | 2 | 75 | 7 | ||||||||||||
| 2009 | 66 | 4 | 2 | 4 | ||||||||||||
| 2010 | 12 | 78 | 179 | 73 | 10 | 3 | 32 | |||||||||
| 2011 | 48 | 39 | 4 | 28 | 5 | 48 | ||||||||||
| 2012 | 1 | 143 | 15 | 6 | 360 | 74 | 81 | 143 | ||||||||
| 2013 | 27 | 22 | 15 | 346 | 20 | 20 | 27 | 1 | ||||||||
| 2014 | 4 | 18 | 3 | |||||||||||||
| 2015 | 1 | 14 | 20 | 3 | ||||||||||||
| 2016 | 10 | 24 |