Please login if you have access to particular applications.
Provider: All providers | |
Key Ecological Features | |
| Name: | Bonney Coast Upwelling |
| Region: | South-east |
| Area: | 15,274.62 km2 |
| Data aggregated on 2025-09-17 18:04 | |
The following is the list of gear types used within this region. Click on 'gear type' for a detailed report of that gear.
| Gear Type | Code | Map colour | Layers used | Summary |
|---|---|---|---|---|
| ocean based acoustic current meter | OB_ACM | ■ |
CSIRO NCMI Acoustic Doppler Current Profiler data - link to layer metadata NOAA drifting buoys (map) |
Records - 1216 Deepest: db,Records - 52 Deepest: db |
| eXpendable BathyThermograph | XBT | ■ |
XBT Profile Data - link to layer metadata |
Records - 598 Deepest: db |
| multibeam sonar | MBS | ■ | MNF singlebeam TOPAS sub-bottom profiler | Records - 17 Deepest: db |
| Water quality and chemistry | WQ_C | ■ |
CMAR Hydrology - link to layer metadata |
Records - 191 Deepest: db |
| Zooplankton samples | ZP | ■ |
SOOP AusCPR zoop trajectory map - link to layer metadata |
Records - 85 Deepest: db |
| CTD sensor | CTD | ■ |
aatams sattag dm location map - link to layer metadata Australian Sea Lion CTD Profiles - link to layer metadata aatams sattag dm profile map - link to layer metadata aatams sattag dm dive profile map - link to layer metadata RAN CTD data CMAR CTD Data Overview (1982 - present) - link to layer metadata |
Records - 708 Deepest: db,Records - 604 Deepest: db,Records - 178 Deepest: db |
| sediment grab and core samples | SG | ■ |
Seabed sediments sampling CSIRO Sediment Sampling MNF Sediment Sampling sites - all voyages |
Records - 21 Deepest: db,Records - 8 Deepest: db |
| demersal trawl or sled | DT_S | ■ |
CMAR Catch Operations Data overview (1965 to current) - link to layer metadata |
Records - 19 Deepest: db |
| Continuous Plankton Recorder | CPR | ■ |
CPR Plankton Colour Index Survey - link to layer metadata CPR Zooplankton Abundance Survey - link to layer metadata CPR Phytoplankton Abundance Survey - link to layer metadata |
Records - 277 Deepest: db |
| diver visual | DV | ■ |
Long Term Temperate Reef Monitoring Program Site Surveys Reef Life Survey (RLS) Sites (http://reeflifesurvey.com) - link to layer metadata |
Records - 4 Deepest: db,Records - 4 Deepest: db |
| satellite tag | ST | ■ |
aatams sattag dm location map - link to layer metadata Australian Sea Lion CTD Profiles - link to layer metadata aatams sattag dm profile map - link to layer metadata aatams sattag dm dive profile map - link to layer metadata |
Records - 708 Deepest: db |
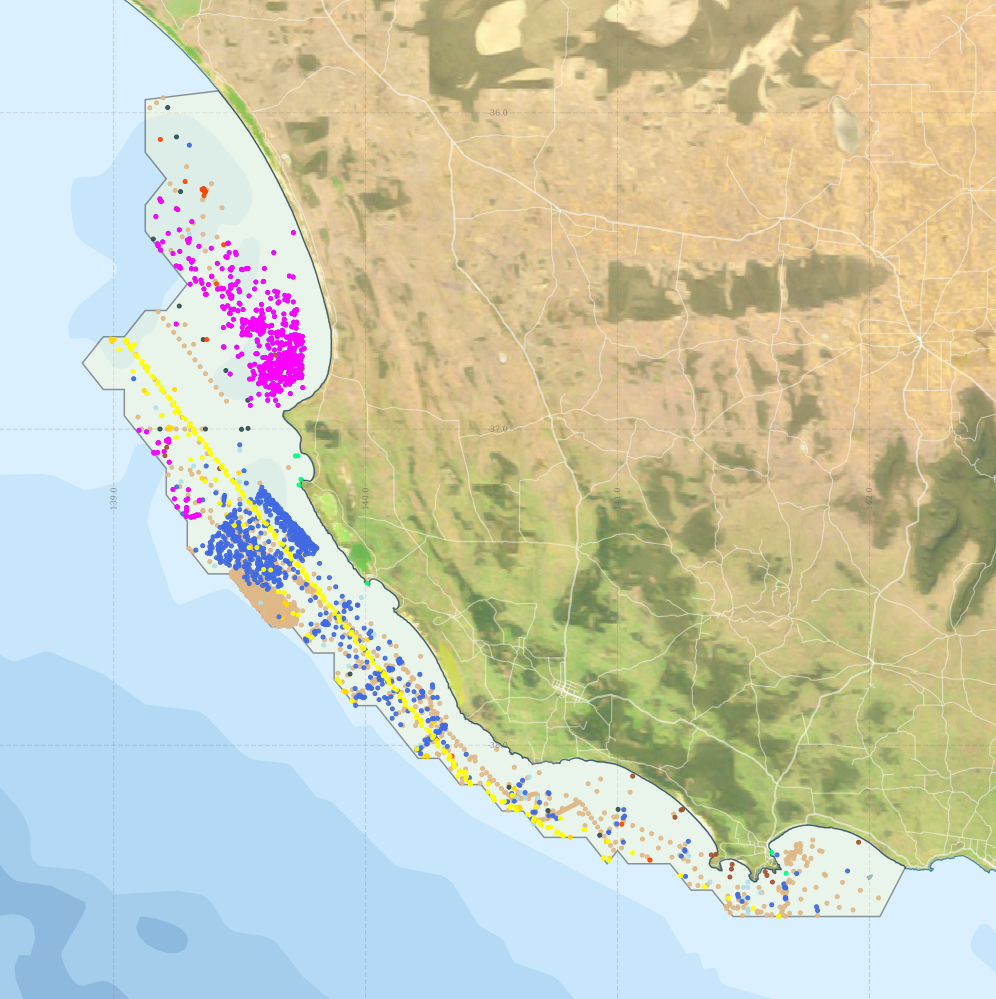
Region extents: 138° 52.5' E 38° 32.5' S to 142° 08.6' E 35° 55.8' S Refresh map
Acknowledgements: Background map - Bright Earth e-Atlas Basemap v1.0 (AIMS, GBRMPA, JCU, DSITIA, GA, UCSD, NASA, OSM, ESRI) CC BY
Time series plot (1930 to present) - Y axis is per year
Region data
Show data list
| Year | CPR | CTD | DT_S | DV | MBS | OB_ACM | SG | ST | WQ_C | XBT | ZP |
| 1961 | 4 | ||||||||||
| 1966 | 3 | ||||||||||
| 1968 | 1 | ||||||||||
| 1972 | 1 | ||||||||||
| 1973 | 1 | ||||||||||
| 1974 | 1 | ||||||||||
| 1975 | 1 | ||||||||||
| 1976 | 1 | ||||||||||
| 1977 | 1 | ||||||||||
| 1978 | 2 | 1 | |||||||||
| 1979 | 1 | ||||||||||
| 1980 | 1 | ||||||||||
| 1981 | 5 | ||||||||||
| 1982 | 20 | ||||||||||
| 1983 | 34 | ||||||||||
| 1984 | 7 | 7 | |||||||||
| 1985 | 3 | ||||||||||
| 1986 | 3 | ||||||||||
| 1987 | 10 | 10 | 2 | ||||||||
| 1988 | 25 | ||||||||||
| 1989 | 133 | 163 | 111 | 36 | |||||||
| 1990 | 13 | ||||||||||
| 1991 | 31 | 37 | |||||||||
| 1992 | 6 | ||||||||||
| 1993 | 68 | ||||||||||
| 1994 | 36 | ||||||||||
| 1995 | 35 | ||||||||||
| 1997 | 10 | 45 | 10 | 19 | |||||||
| 1998 | 14 | 105 | 14 | ||||||||
| 1999 | 1 | ||||||||||
| 2000 | 1 | 13 | 56 | 1 | 1 | ||||||
| 2001 | 3 | 2 | |||||||||
| 2002 | 3 | ||||||||||
| 2003 | 3 | ||||||||||
| 2004 | 5 | ||||||||||
| 2005 | 33 | ||||||||||
| 2006 | 5 | 17 | 89 | 3 | 2 | ||||||
| 2007 | 4 | 1 | |||||||||
| 2008 | 3 | 727 | 156 | 120 | |||||||
| 2009 | 4 | 4 | 3 | ||||||||
| 2010 | 40 | 6 | 35 | 7 | |||||||
| 2011 | 104 | 552 | 10 | 552 | 38 | 14 | |||||
| 2012 | 84 | 599 | 4 | 20 | 5 | 13 | |||||
| 2013 | 20 | 1 | 5 | ||||||||
| 2014 | 29 | 33 | 32 | ||||||||
| 2015 | 14 |