Please login if you have access to particular applications.
Provider: All providers | |
Key Ecological Features | |
| Name: | Seamounts South and east of Tasmania |
| Region: | South-east |
| Area: | 13,155.03 km2 |
| Data aggregated on 2025-11-11 22:46 | |
The following is the list of gear types used within this region. Click on 'gear type' for a detailed report of that gear.
| Gear Type | Code | Map colour | Layers used | Summary |
|---|---|---|---|---|
| ocean based acoustic current meter | OB_ACM | ■ |
CSIRO NCMI Acoustic Doppler Current Profiler data - link to layer metadata NOAA drifting buoys (map) |
Records - 799 Deepest: db,Records - 192 Deepest: db |
| eXpendable BathyThermograph | XBT | ■ |
CMAR XBT profiles - link to layer metadata XBT Realtime profile - link to layer metadata XBT Profile Data - link to layer metadata |
Records - 1 Deepest: db,Records - 70 Deepest: db |
| multibeam sonar | MBS | ■ |
RV Investigator EM122 multibeam SBP120 sub bottom profiler MNF singlebeam TOPAS sub-bottom profiler |
Records - 70 Deepest: db |
| seabed towed video and stills | S_TV | ■ | MNF Video Tows | Records - 34 Deepest: db |
| Water quality and chemistry | WQ_C | ■ |
CMAR Hydrology - link to layer metadata |
Records - 49 Deepest: db |
| Zooplankton samples | ZP | ■ |
The Australian Zooplankton Database (1938 onwards) - Data - link to layer metadata SOOP AusCPR zoop trajectory map - link to layer metadata |
Records - 2 Deepest: db,Records - 3 Deepest: db |
| CTD sensor | CTD | ■ |
CMAR CTD Data Overview (1982 - present) - link to layer metadata CMAR Towed CTD - link to layer metadata ARGO profile map - link to layer metadata Completed Realtime Glider Deployments - link to layer metadata RAN CTD data |
Records - 42 Deepest: db,Records - 114 Deepest: db,Records - 1 Deepest: db |
| Glider | glider | ■ |
Completed Realtime Glider Deployments - link to layer metadata |
Records - 77 Deepest: db |
| demersal trawl or sled | DT_S | ■ |
CMAR Catch Operations Data overview (1965 to current) - link to layer metadata |
Records - 43 Deepest: db |
| Continuous Plankton Recorder | CPR | ■ |
CPR Plankton Colour Index Survey - link to layer metadata CPR Phytoplankton Abundance Survey - link to layer metadata |
Records - 15 Deepest: db |
| midwater acoustics | MW_A | ■ |
MNF singlebeam EK60 18-333 kHz (RV Investigator) MNF singlebeam EK60 38-120 kHz (Southern Surveyor) MNF singlebeam EK60 12kHz (Southern Surveyor) |
Records - 98 Deepest: db |
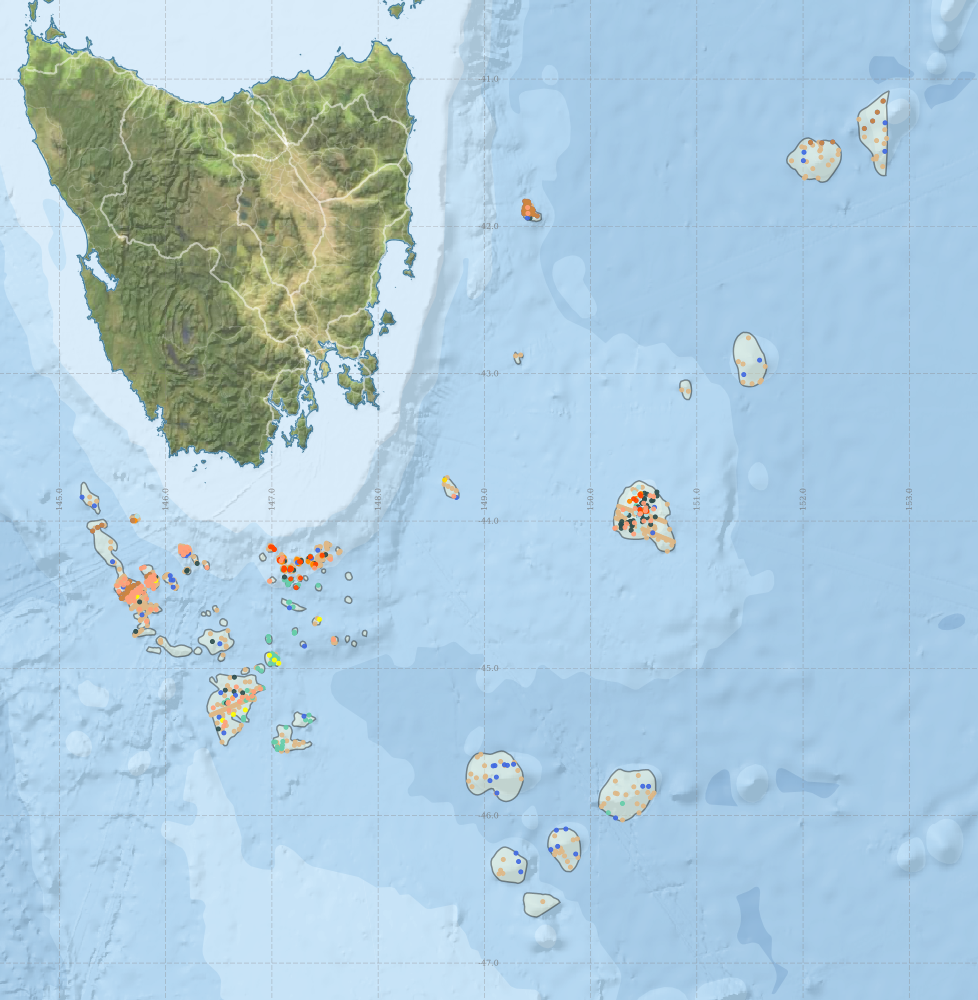
Region extents: 145° 12.1' E 46° 41.4' S to 152° 48.6' E 41° 04.8' S Refresh map
Acknowledgements: Background map - Bright Earth e-Atlas Basemap v1.0 (AIMS, GBRMPA, JCU, DSITIA, GA, UCSD, NASA, OSM, ESRI) CC BY
Time series plot (1930 to present) - Y axis is per year
Region data
Show data list
| Year | CPR | CTD | DT_S | MBS | MW_A | OB_ACM | S_TV | WQ_C | XBT | ZP | glider |
| 1938 | 1 | ||||||||||
| 1955 | 1 | ||||||||||
| 1964 | 1 | ||||||||||
| 1971 | 1 | ||||||||||
| 1984 | 1 | ||||||||||
| 1985 | 11 | ||||||||||
| 1986 | 2 | 2 | |||||||||
| 1989 | 1 | ||||||||||
| 1990 | 4 | 1 | 4 | ||||||||
| 1991 | 1 | 16 | |||||||||
| 1992 | 7 | 21 | 7 | ||||||||
| 1993 | 11 | 34 | 4 | 2 | |||||||
| 1994 | 15 | 41 | 16 | 4 | |||||||
| 1995 | 2 | ||||||||||
| 1996 | 3 | 1 | |||||||||
| 1997 | 22 | 11 | 4 | ||||||||
| 1998 | 25 | 1 | 2 | ||||||||
| 1999 | 1 | 6 | |||||||||
| 2000 | 1 | 4 | |||||||||
| 2001 | 1 | 4 | |||||||||
| 2002 | 2 | ||||||||||
| 2003 | 1 | 2 | 4 | ||||||||
| 2004 | 1 | 1 | |||||||||
| 2005 | 1 | 1 | 3 | ||||||||
| 2006 | 2 | 1 | 504 | 26 | 2 | ||||||
| 2007 | 4 | 20 | 9 | 3 | 8 | ||||||
| 2008 | 1 | 2 | 20 | ||||||||
| 2009 | 4 | 1 | 2 | ||||||||
| 2010 | 10 | 59 | 21 | 10 | 53 | ||||||
| 2011 | 1 | 1 | 14 | 1 | 1 | 1 | 24 | ||||
| 2012 | 3 | 3 | 18 | 9 | 4 | 2 | |||||
| 2013 | 2 | 34 | 64 | 4 | |||||||
| 2014 | 1 | 4 | |||||||||
| 2015 | 1 | 19 | 16 | 2 | 1 | ||||||
| 2016 | 41 | 16 |