Please login if you have access to particular applications.
Provider: All providers | |
Key Ecological Features | |
| Name: | Gulf of Carpentaria coastal zone |
| Region: | North |
| Area: | 43,131.86 km2 |
| Data aggregated on 2025-12-02 12:31 | |
The following is the list of gear types used within this region. Click on 'gear type' for a detailed report of that gear.
| Gear Type | Code | Map colour | Layers used | Summary |
|---|---|---|---|---|
| eXpendable BathyThermograph | XBT | ■ |
XBT Profile Data - link to layer metadata |
Records - 9 Deepest: db |
| ocean based acoustic current meter | OB_ACM | ■ |
CSIRO NCMI Acoustic Doppler Current Profiler data - link to layer metadata |
Records - 8 Deepest: db |
| multibeam sonar | MBS | ■ | MNF singlebeam TOPAS sub-bottom profiler | Records - 38 Deepest: db |
| Water quality and chemistry | WQ_C | ■ |
MMP Locations Depth Weighted Avg CMAR Hydrology - link to layer metadata |
Records - 2 Deepest: db,Records - 156 Deepest: db |
| Zooplankton samples | ZP | ■ |
The Australian Zooplankton Database (1938 onwards) - Data - link to layer metadata |
Records - 24 Deepest: db |
| sediment grab and core samples | SG | ■ |
CSIRO Sediment Sampling MNF Sediment Sampling sites - all voyages Seabed sediments sampling |
Records - 84 Deepest: db,Records - 225 Deepest: db |
| demersal trawl or sled | DT_S | ■ |
CMAR Catch Operations Data overview (1965 to current) - link to layer metadata |
Records - 216 Deepest: db |
| CTD sensor | CTD | ■ |
AODN Northern Territory satellite tagging Hawksbill turtle profile map - link to layer metadata CMAR CTD Data Overview (1982 - present) - link to layer metadata RAN CTD data |
Records - 40 Deepest: db,Records - 22 Deepest: db,Records - 9 Deepest: db |
| satellite tag | ST | ■ |
AODN Northern Territory satellite tagging Hawksbill turtle dive profile map - link to layer metadata AODN Northern Territory satellite tagging Hawksbill turtle haulout map - link to layer metadata AODN Northern Territory satellite tagging Hawksbill turtle profile map - link to layer metadata AODN Northern Territory satellite tagging Hawksbill turtle location map - link to layer metadata |
Records - 160 Deepest: db |
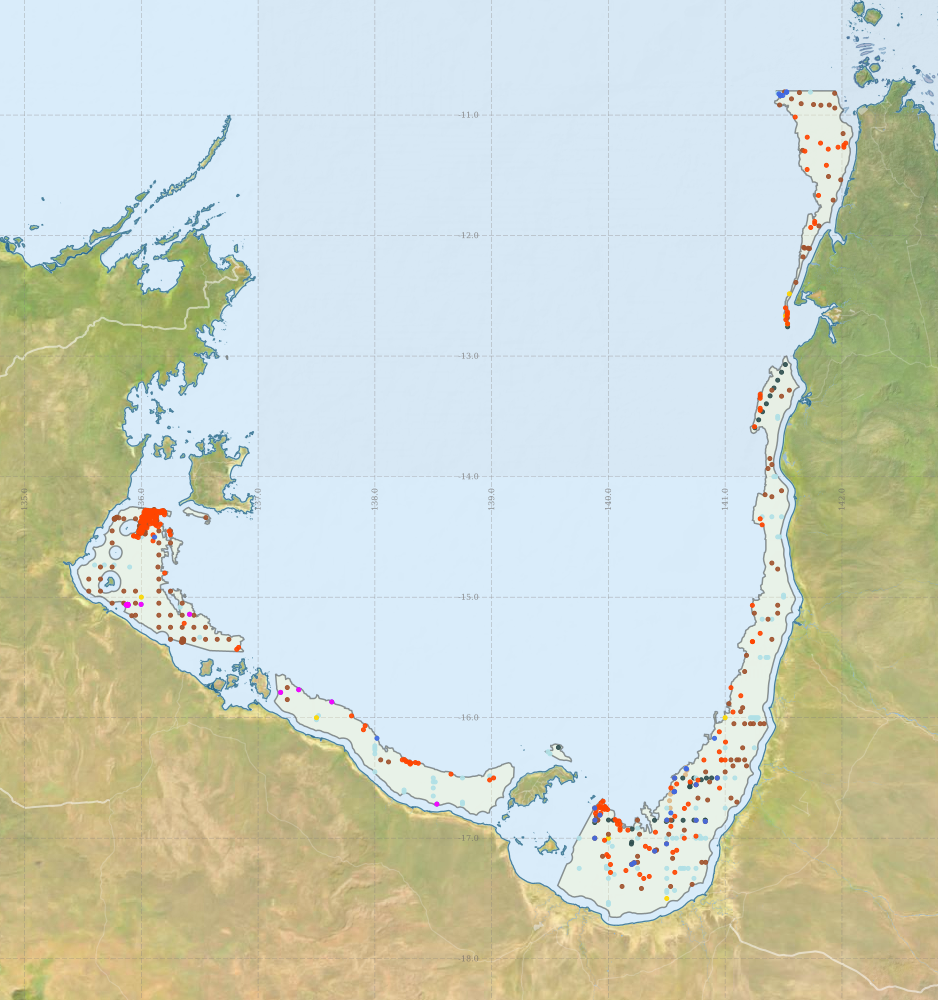
Region extents: 135° 27.2' E 17° 39.4' S to 142° 05.6' E 10° 48.0' S Refresh map
Acknowledgements: Background map - Bright Earth e-Atlas Basemap v1.0 (AIMS, GBRMPA, JCU, DSITIA, GA, UCSD, NASA, OSM, ESRI) CC BY
Time series plot (1930 to present) - Y axis is per year
Region data
Show data list
| Year | CTD | DT_S | MBS | OB_ACM | SG | ST | WQ_C | XBT | ZP |
| 1968 | 13 | ||||||||
| 1969 | 22 | ||||||||
| 1970 | 6 | ||||||||
| 1972 | 1 | ||||||||
| 1973 | 1 | ||||||||
| 1975 | 29 | 5 | |||||||
| 1976 | 38 | 5 | |||||||
| 1977 | 30 | 5 | |||||||
| 1978 | 38 | ||||||||
| 1980 | 7 | ||||||||
| 1981 | 10 | ||||||||
| 1983 | 1 | ||||||||
| 1984 | 21 | 24 | |||||||
| 1985 | 21 | ||||||||
| 1986 | 3 | ||||||||
| 1987 | 1 | 4 | |||||||
| 1988 | 6 | 8 | 11 | 5 | 1 | ||||
| 1989 | 18 | 1 | |||||||
| 1990 | 1 | ||||||||
| 1992 | 4 | 1 | |||||||
| 1993 | 2 | 2 | |||||||
| 1994 | 1 | ||||||||
| 1997 | 91 | ||||||||
| 1998 | 43 | 52 | |||||||
| 2003 | 16 | 27 | 26 | 16 | |||||
| 2005 | 11 | 7 | |||||||
| 2008 | 1 | ||||||||
| 2009 | 2 | 8 | |||||||
| 2010 | 38 | 152 | |||||||
| 2011 | 2 | ||||||||
| 2013 | 9 |