Please login if you have access to particular applications.
Provider: All providers | |
Key Ecological Features | |
| Name: | Tasmantid seamount chain |
| Region: | Temperate east |
| Area: | 23,581.74 km2 |
| Data aggregated on 2025-11-03 06:58 | |
The following is the list of gear types used within this region. Click on 'gear type' for a detailed report of that gear.
| Gear Type | Code | Map colour | Layers used | Summary |
|---|---|---|---|---|
| ocean based acoustic current meter | OB_ACM | ■ |
NOAA drifting buoys (map) CSIRO NCMI Acoustic Doppler Current Profiler data - link to layer metadata |
Records - 275 Deepest: db,Records - 5624 Deepest: db |
| eXpendable BathyThermograph | XBT | ■ |
CMAR XBT profiles - link to layer metadata XBT Realtime profile - link to layer metadata XBT Profile Data - link to layer metadata |
Records - 19 Deepest: db,Records - 31 Deepest: db |
| multibeam sonar | MBS | ■ |
RV Investigator EM122 multibeam SBP120 sub bottom profiler MNF singlebeam TOPAS sub-bottom profiler |
Records - 106 Deepest: db |
| Current meter at moorings | CM_M | ■ |
ABOS currents map - link to layer metadata |
Records - 3 Deepest: db |
| Water quality and chemistry | WQ_C | ■ |
SRS Bio Optical DataBase - link to layer metadata CMAR Hydrology - link to layer metadata |
Records - 1 Deepest: db,Records - 76 Deepest: db |
| CTD sensor | CTD | ■ |
CMAR CTD Data Overview (1982 - present) - link to layer metadata CMAR Towed CTD - link to layer metadata ARGO profile map - link to layer metadata |
Records - 122 Deepest: db,Records - 43 Deepest: db |
| demersal trawl or sled | DT_S | ■ |
CMAR Catch Operations Data overview (1965 to current) - link to layer metadata |
Records - 43 Deepest: db |
| sediment grab and core samples | SG | ■ | MNF Sediment Sampling sites - all voyages | Records - 1 Deepest: db |
| midwater acoustics | MW_A | ■ |
MNF singlebeam EK60 18-333 kHz (RV Investigator) MNF singlebeam EK60 38-120 kHz (Southern Surveyor) MNF singlebeam EK60 12kHz (Southern Surveyor) |
Records - 2478 Deepest: db |
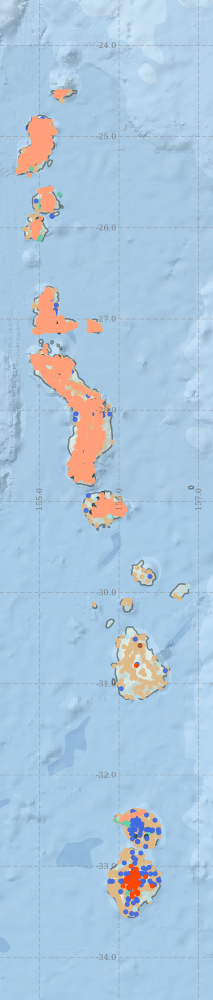
Region extents: 154° 43.5' E 33° 33.7' S to 156° 56.2' E 24° 29.9' S Refresh map
Acknowledgements: Background map - Bright Earth e-Atlas Basemap v1.0 (AIMS, GBRMPA, JCU, DSITIA, GA, UCSD, NASA, OSM, ESRI) CC BY
Time series plot (1930 to present) - Y axis is per year
Region data
Show data list
| Year | CM_M | CTD | DT_S | MBS | MW_A | OB_ACM | SG | WQ_C | XBT |
| 1954 | 2 | ||||||||
| 1958 | 1 | ||||||||
| 1960 | 5 | ||||||||
| 1962 | 1 | ||||||||
| 1963 | 1 | ||||||||
| 1964 | 3 | ||||||||
| 1965 | 3 | ||||||||
| 1966 | 1 | ||||||||
| 1967 | 1 | ||||||||
| 1968 | 4 | 8 | |||||||
| 1975 | 29 | ||||||||
| 1978 | 10 | 5 | |||||||
| 1979 | 3 | ||||||||
| 1980 | 3 | ||||||||
| 1981 | 1 | ||||||||
| 1982 | 3 | ||||||||
| 1983 | 3 | ||||||||
| 1984 | 1 | ||||||||
| 1985 | 3 | 3 | |||||||
| 1989 | 2 | 2 | |||||||
| 1990 | 2 | 14 | 2 | 1 | |||||
| 1991 | 8 | 69 | 2 | ||||||
| 1992 | 19 | ||||||||
| 1993 | 1 | ||||||||
| 1994 | 3 | ||||||||
| 1995 | 2 | ||||||||
| 1996 | 4 | ||||||||
| 1997 | 7 | ||||||||
| 1998 | 5 | ||||||||
| 1999 | 3 | 6 | 3 | 9 | |||||
| 2000 | 20 | 2 | |||||||
| 2001 | 5 | 1 | |||||||
| 2002 | 9 | ||||||||
| 2003 | 1 | 1 | |||||||
| 2004 | 1 | 316 | 1 | ||||||
| 2005 | 6 | ||||||||
| 2006 | 2 | 17 | 13 | 1 | |||||
| 2007 | 4 | 32 | |||||||
| 2008 | 4 | 2 | 62 | ||||||
| 2009 | 5 | 37 | 18 | ||||||
| 2010 | 8 | 48 | 5 | ||||||
| 2011 | 5 | 6 | 8 | ||||||
| 2012 | 1 | 3 | 85 | 2201 | 531 | 2 | 2 | ||
| 2013 | 2 | 262 | 390 | 2 | 2 | ||||
| 2014 | 3 | ||||||||
| 2015 | 1 | 1 | 16 | 15 | 1 | ||||
| 2016 | 1 | 3 | 2 |