Please login if you have access to particular applications.
Provider: All providers | |
Key Ecological Features | |
| Name: | Big Horseshoe Canyon |
| Region: | South-east |
| Area: | 319.87 km2 |
| Data aggregated on 2025-11-22 04:54 | |
The following is the list of gear types used within this region. Click on 'gear type' for a detailed report of that gear.
| Gear Type | Code | Map colour | Layers used | Summary |
|---|---|---|---|---|
| ocean based acoustic current meter | OB_ACM | ■ |
NOAA drifting buoys (map) CSIRO NCMI Acoustic Doppler Current Profiler data - link to layer metadata |
Records - 2 Deepest: db,Records - 156 Deepest: db |
| seabed towed video and stills | S_TV | ■ |
MNF Video Tows CSIRO O&A towed video camera |
Records - 5 Deepest: db |
| Water quality and chemistry | WQ_C | ■ |
CMAR Hydrology - link to layer metadata |
Records - 8 Deepest: db |
| Zooplankton samples | ZP | ■ |
SOOP AusCPR zoop trajectory map - link to layer metadata |
Records - 7 Deepest: db |
| CTD sensor | CTD | ■ |
Australian Fur Seal CTD Profiles - link to layer metadata CMAR CTD Data Overview (1982 - present) - link to layer metadata |
Records - 1 Deepest: db,Records - 6 Deepest: db |
| demersal trawl or sled | DT_S | ■ |
CMAR Catch Operations Data overview (1965 to current) - link to layer metadata |
Records - 5 Deepest: db |
| sediment grab and core samples | SG | ■ | CSIRO Sediment Sampling | Records - 3 Deepest: db |
| Continuous Plankton Recorder | CPR | ■ |
CPR Plankton Colour Index Survey - link to layer metadata CPR Zooplankton Abundance Survey - link to layer metadata CPR Phytoplankton Abundance Survey - link to layer metadata |
Records - 37 Deepest: db |
| satellite tag | ST | ■ |
Australian Fur Seal CTD Profiles - link to layer metadata |
Records - 1 Deepest: db |
| midwater acoustics | MW_A | ■ |
MNF singlebeam EK60 38-120 kHz (Southern Surveyor) MNF singlebeam EK60 12kHz (Southern Surveyor) |
Records - 2 Deepest: db |
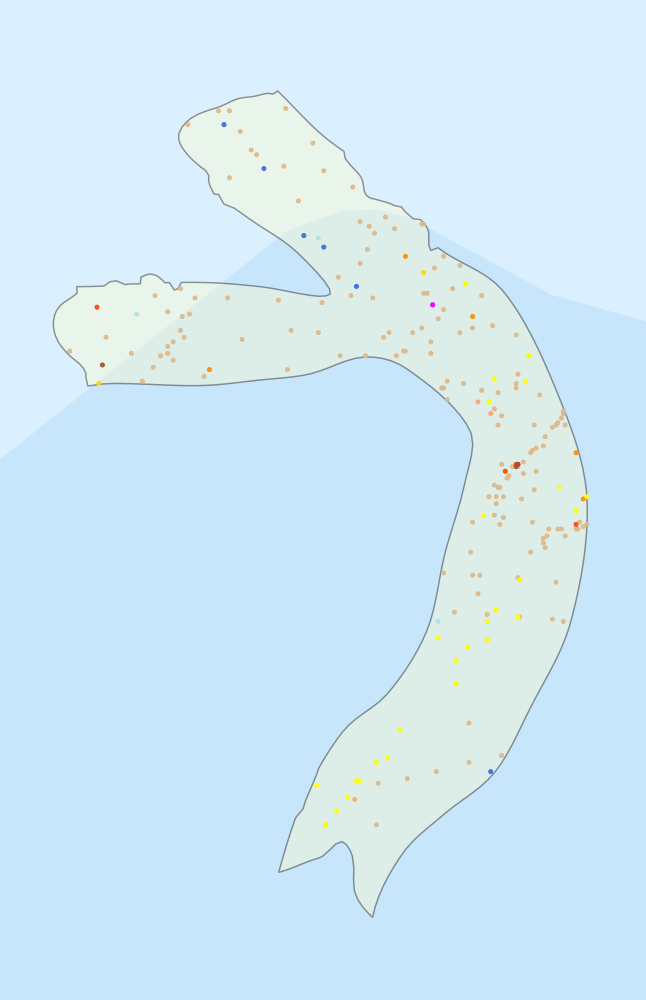
Region extents: 149° 16.3' E 38° 24.7' S to 149° 33.9' E 38° 03.2' S Refresh map
Acknowledgements: Background map - Bright Earth e-Atlas Basemap v1.0 (AIMS, GBRMPA, JCU, DSITIA, GA, UCSD, NASA, OSM, ESRI) CC BY
Time series plot (1930 to present) - Y axis is per year
Region data
Show data list
| Year | CPR | CTD | DT_S | MW_A | OB_ACM | ST | S_TV | WQ_C | ZP |
| 1976 | 1 | ||||||||
| 1981 | 2 | ||||||||
| 1991 | 1 | ||||||||
| 1994 | 1 | 1 | |||||||
| 1996 | 4 | 1 | 3 | ||||||
| 1997 | 1 | ||||||||
| 1998 | 1 | ||||||||
| 2000 | 1 | 4 | 77 | 2 | 1 | ||||
| 2001 | 2 | ||||||||
| 2004 | 65 | 3 | |||||||
| 2008 | 4 | ||||||||
| 2009 | 13 | ||||||||
| 2010 | 16 | 4 | 3 | ||||||
| 2011 | 4 | 1 | |||||||
| 2012 | 3 | 1 | 1 | 1 | |||||
| 2013 | 1 | 2 | 3 | ||||||
| 2014 | 2 |