Please login if you have access to particular applications.
Provider: All providers | |
Key Ecological Features | |
| Name: | Carbonate bank and terrace system of the Van Diemen Rise |
| Region: | North |
| Area: | 31,278.22 km2 |
| Data aggregated on 2025-12-02 13:44 | |
The following is the list of gear types used within this region. Click on 'gear type' for a detailed report of that gear.
| Gear Type | Code | Map colour | Layers used | Summary |
|---|---|---|---|---|
| eXpendable BathyThermograph | XBT | ■ |
XBT Profile Data - link to layer metadata |
Records - 513 Deepest: db |
| ocean based acoustic current meter | OB_ACM | ■ |
CSIRO NCMI Acoustic Doppler Current Profiler data - link to layer metadata |
Records - 492 Deepest: db |
| multibeam sonar | MBS | ■ | MNF singlebeam TOPAS sub-bottom profiler | Records - 9 Deepest: db |
| Water quality and chemistry | WQ_C | ■ |
CMAR Hydrology - link to layer metadata |
Records - 21 Deepest: db |
| CTD sensor | CTD | ■ |
AIMS CTD cast summary RAN CTD data AIMS CTD data CMAR CTD Data Overview (1982 - present) - link to layer metadata |
Records - 2 Deepest: db,Records - 521 Deepest: db,Records - 12 Deepest: db |
| sediment grab and core samples | SG | ■ | Seabed sediments sampling | Records - 134 Deepest: db |
| demersal trawl or sled | DT_S | ■ |
CMAR Catch Operations Data overview (1965 to current) - link to layer metadata |
Records - 19 Deepest: db |
| midwater acoustics | MW_A | ■ |
MNF singlebeam EK60 38-120 kHz (Southern Surveyor) MNF singlebeam EK60 12kHz (Southern Surveyor) |
Records - 353 Deepest: db |
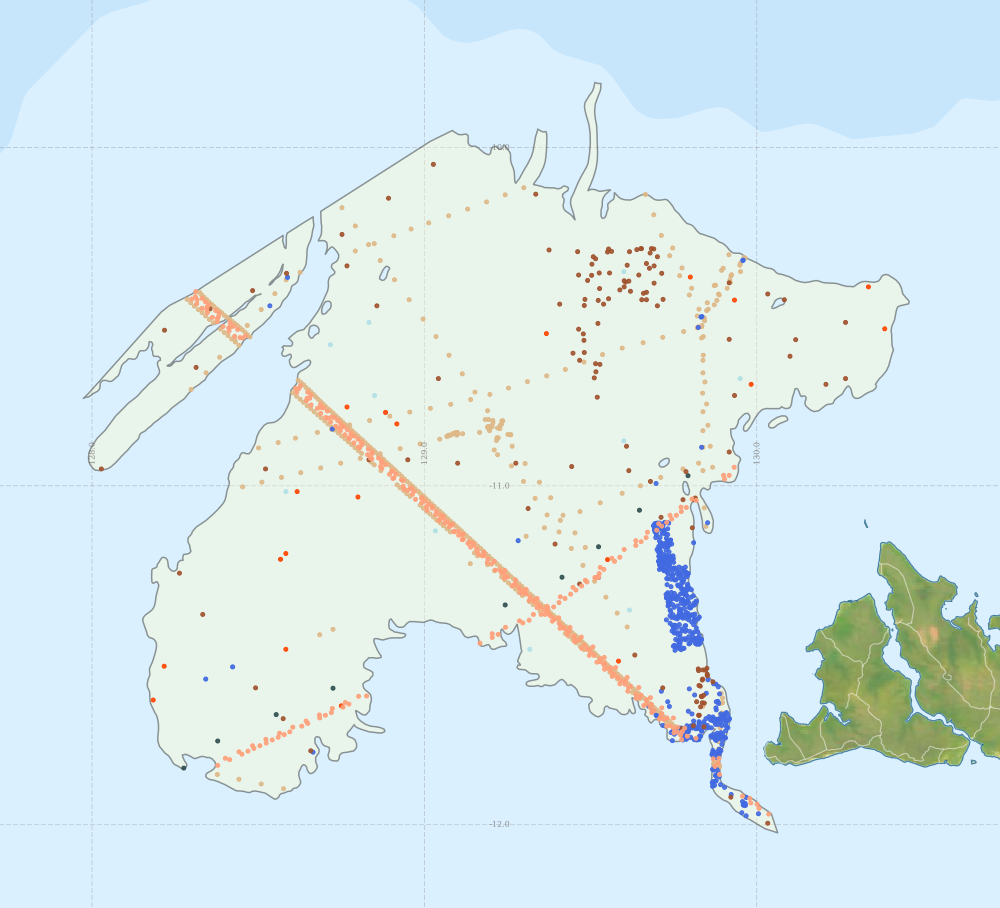
Region extents: 127° 58.3' E 12° 01.5' S to 130° 27.5' E 9° 48.5' S Refresh map
Acknowledgements: Background map - Bright Earth e-Atlas Basemap v1.0 (AIMS, GBRMPA, JCU, DSITIA, GA, UCSD, NASA, OSM, ESRI) CC BY
Time series plot (1930 to present) - Y axis is per year
Region data
Show data list
| Year | CTD | DT_S | MBS | MW_A | OB_ACM | SG | WQ_C | XBT |
| 1960 | 2 | |||||||
| 1961 | 1 | |||||||
| 1962 | 2 | |||||||
| 1967 | 1 | |||||||
| 1969 | 1 | 8 | ||||||
| 1970 | 2 | |||||||
| 1972 | 1 | |||||||
| 1973 | 2 | |||||||
| 1979 | 6 | 3 | ||||||
| 1980 | 5 | 4 | ||||||
| 1983 | 7 | |||||||
| 1984 | 1 | |||||||
| 1985 | 25 | |||||||
| 1986 | 4 | |||||||
| 1987 | 2 | 13 | 2 | 2 | ||||
| 1988 | 3 | |||||||
| 1989 | 10 | |||||||
| 1990 | 31 | |||||||
| 1991 | 54 | |||||||
| 1992 | 1 | 1 | 31 | |||||
| 1993 | 88 | |||||||
| 1994 | 4 | |||||||
| 1995 | 20 | 3 | ||||||
| 1996 | 2 | |||||||
| 1997 | 1 | 26 | ||||||
| 1998 | 1 | |||||||
| 1999 | 1 | 51 | 5 | 10 | ||||
| 2000 | 2 | 53 | 1 | |||||
| 2001 | 1 | |||||||
| 2002 | 3 | |||||||
| 2003 | 21 | 3 | ||||||
| 2004 | 24 | 1 | ||||||
| 2005 | 67 | 16 | ||||||
| 2006 | 2 | |||||||
| 2007 | 29 | |||||||
| 2008 | 61 | |||||||
| 2009 | 8 | 2 | ||||||
| 2010 | 48 | 30 | ||||||
| 2011 | 29 | |||||||
| 2012 | 8 | 268 | 267 | 3 | ||||
| 2013 | 1 | 9 | 85 | 1 | 1 | |||
| 2014 | 1 | 29 |