Please login if you have access to particular applications.
Provider: All providers | |
Key Ecological Features | |
| Name: | Exmouth Plateau |
| Region: | North-west |
| Area: | 49,314.14 km2 |
| Data aggregated on 2026-01-10 18:05 | |
The following is the list of gear types used within this region. Click on 'gear type' for a detailed report of that gear.
| Gear Type | Code | Map colour | Layers used | Summary |
|---|---|---|---|---|
| ocean based acoustic current meter | OB_ACM | ■ |
CSIRO NCMI Acoustic Doppler Current Profiler data - link to layer metadata NOAA drifting buoys (map) |
Records - 312 Deepest: db,Records - 183 Deepest: db |
| eXpendable BathyThermograph | XBT | ■ |
XBT Profile Data - link to layer metadata |
Records - 11 Deepest: db |
| Water quality and chemistry | WQ_C | ■ |
CMAR Hydrology - link to layer metadata |
Records - 13 Deepest: db |
| CTD sensor | CTD | ■ |
ARGO profile map - link to layer metadata Completed Realtime Glider Deployments - link to layer metadata CMAR CTD Data Overview (1982 - present) - link to layer metadata |
Records - 160 Deepest: db,Records - 5 Deepest: db |
| Glider | glider | ■ |
Completed Realtime Glider Deployments - link to layer metadata |
Records - 137 Deepest: db |
| sediment grab and core samples | SG | ■ |
Seabed sediments sampling Core data - Indian Ocean |
Records - 17 Deepest: db,Records - 4 Deepest: db |
| demersal trawl or sled | DT_S | ■ |
CMAR Catch Operations Data overview (1965 to current) - link to layer metadata |
Records - 8 Deepest: db |
| midwater acoustics | MW_A | ■ |
MNF singlebeam EK60 38-120 kHz (Southern Surveyor) MNF singlebeam EK60 12kHz (Southern Surveyor) |
Records - 147 Deepest: db |
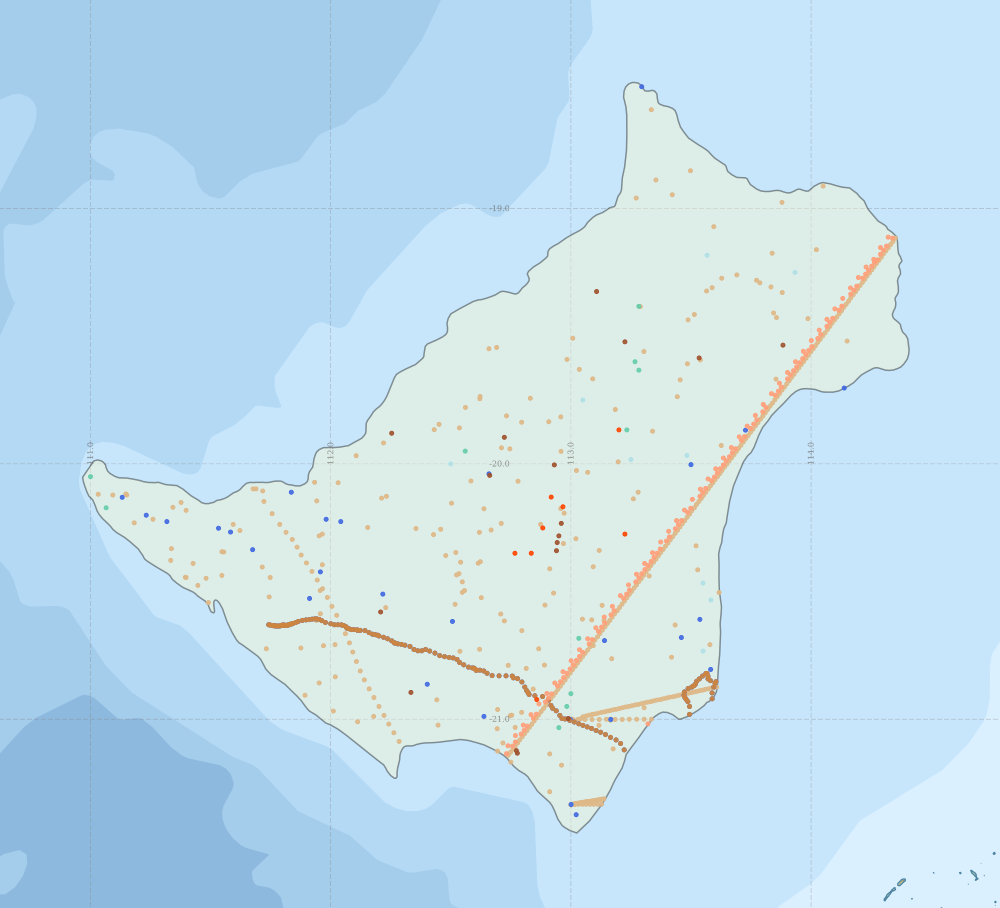
Region extents: 110° 58.0' E 21° 26.7' S to 114° 24.5' E 18° 30.4' S Refresh map
Acknowledgements: Background map - Bright Earth e-Atlas Basemap v1.0 (AIMS, GBRMPA, JCU, DSITIA, GA, UCSD, NASA, OSM, ESRI) CC BY
Time series plot (1930 to present) - Y axis is per year
Region data
Show data list
| Year | CTD | DT_S | MW_A | OB_ACM | SG | WQ_C | XBT | glider |
| 1960 | 2 | |||||||
| 1961 | 1 | |||||||
| 1962 | 1 | |||||||
| 1971 | 4 | |||||||
| 1973 | 5 | |||||||
| 1982 | 1 | |||||||
| 1986 | 1 | |||||||
| 1987 | 1 | 1 | ||||||
| 1988 | 3 | |||||||
| 1991 | 3 | 1 | ||||||
| 1995 | 1 | 1 | ||||||
| 1996 | 29 | |||||||
| 1997 | 1 | |||||||
| 1999 | 10 | |||||||
| 2002 | 2 | |||||||
| 2003 | 56 | |||||||
| 2004 | 21 | |||||||
| 2005 | 13 | |||||||
| 2006 | 2 | |||||||
| 2007 | 33 | 12 | 8 | |||||
| 2008 | 3 | 24 | 1 | |||||
| 2009 | 3 | 2 | ||||||
| 2010 | 3 | 20 | 3 | 137 | ||||
| 2011 | 2 | |||||||
| 2012 | 14 | 1 | ||||||
| 2013 | 146 | 163 | ||||||
| 2014 | 1 |