Please login if you have access to particular applications.
Provider: All providers | |
Key Ecological Features | |
| Name: | Mermaid Reef and Commonwealth waters surrounding Rowley Shoals |
| Region: | North-west |
| Area: | 4,745.78 km2 |
| Data aggregated on 2025-11-01 07:31 | |
The following is the list of gear types used within this region. Click on 'gear type' for a detailed report of that gear.
| Gear Type | Code | Map colour | Layers used | Summary |
|---|---|---|---|---|
| ocean based acoustic current meter | OB_ACM | ■ |
NOAA drifting buoys (map) CSIRO NCMI Acoustic Doppler Current Profiler data - link to layer metadata |
Records - 41 Deepest: db,Records - 1681 Deepest: db |
| eXpendable BathyThermograph | XBT | ■ |
XBT Profile Data - link to layer metadata |
Records - 4 Deepest: db |
| multibeam sonar | MBS | ■ | MNF singlebeam TOPAS sub-bottom profiler | Records - 55 Deepest: db |
| Water quality and chemistry | WQ_C | ■ |
MMP Locations Depth Weighted Avg CMAR Hydrology - link to layer metadata |
Records - 5 Deepest: db,Records - 23 Deepest: db |
| CTD sensor | CTD | ■ |
AIMS CTD cast summary RAN CTD data AIMS CTD data CMAR CTD Data Overview (1982 - present) - link to layer metadata |
Records - 9 Deepest: db,Records - 30 Deepest: db,Records - 42 Deepest: db |
| demersal trawl or sled | DT_S | ■ |
CMAR Catch Operations Data overview (1965 to current) - link to layer metadata |
Records - 16 Deepest: db |
| sediment grab and core samples | SG | ■ |
MNF Sediment Sampling sites - all voyages Seabed sediments sampling |
Records - 13 Deepest: db,Records - 8 Deepest: db |
| Continuous Plankton Recorder | CPR | ■ |
CPR Plankton Colour Index Survey - link to layer metadata |
Records - 2 Deepest: db |
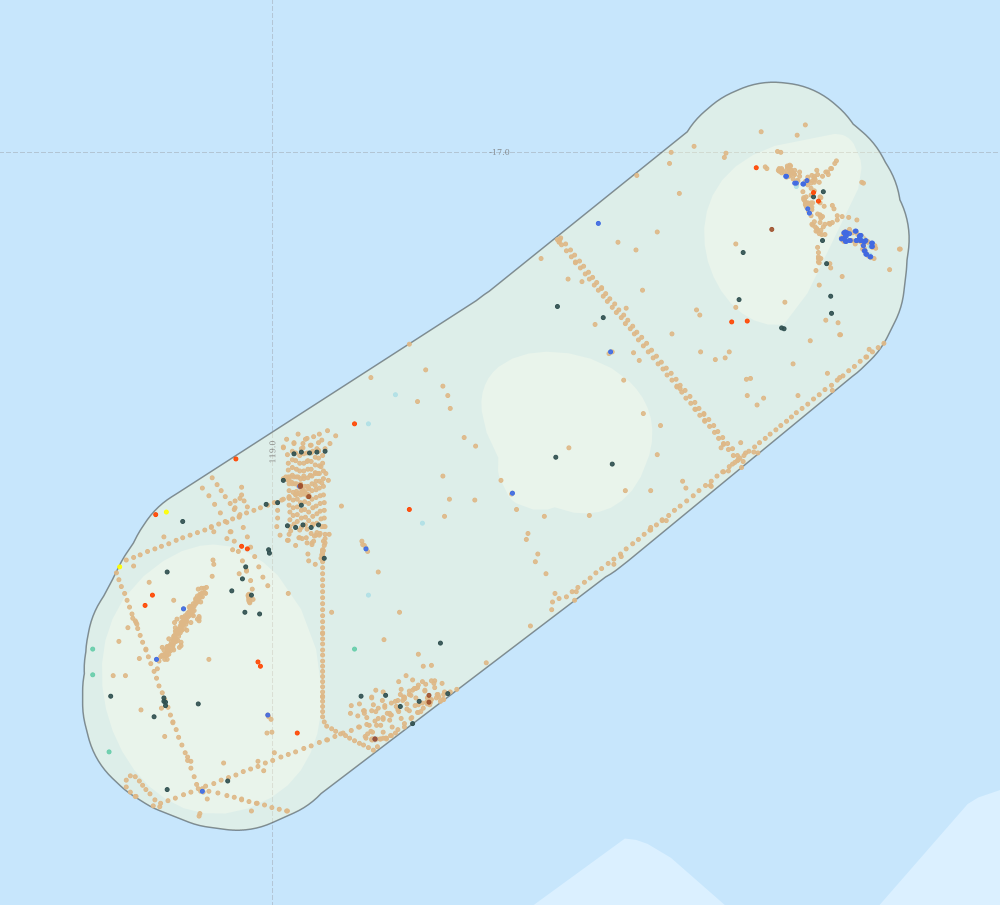
Region extents: 118° 46.1' E 17° 47.5' S to 119° 46.7' E 16° 55.1' S Refresh map
Acknowledgements: Background map - Bright Earth e-Atlas Basemap v1.0 (AIMS, GBRMPA, JCU, DSITIA, GA, UCSD, NASA, OSM, ESRI) CC BY
Time series plot (1930 to present) - Y axis is per year
Region data
Show data list
| Year | CPR | CTD | DT_S | MBS | OB_ACM | SG | WQ_C | XBT |
| 1976 | 1 | |||||||
| 1982 | 1 | |||||||
| 1983 | 2 | |||||||
| 1984 | 2 | 2 | ||||||
| 1987 | 1 | 1 | 1 | |||||
| 1992 | 1 | |||||||
| 1993 | 19 | 1 | ||||||
| 1995 | 9 | 140 | 5 | 1 | ||||
| 1996 | 2 | 46 | ||||||
| 1999 | 2 | |||||||
| 2000 | 8 | 4 | 8 | |||||
| 2006 | 2 | 39 | 393 | 3 | ||||
| 2007 | 12 | 16 | ||||||
| 2008 | 18 | |||||||
| 2011 | 2 | 1 | 823 |