Please login if you have access to particular applications.
Provider: All providers | |
Key Ecological Features | |
| Name: | Tasmantid seamount chain |
| Region: | Coral Sea |
| Area: | 8,718.78 km2 |
| Data aggregated on 2025-10-12 07:43 | |
The following is the list of gear types used within this region. Click on 'gear type' for a detailed report of that gear.
| Gear Type | Code | Map colour | Layers used | Summary |
|---|---|---|---|---|
| ocean based acoustic current meter | OB_ACM | ■ |
NOAA drifting buoys (map) CSIRO NCMI Acoustic Doppler Current Profiler data - link to layer metadata |
Records - 65 Deepest: db,Records - 479 Deepest: db |
| eXpendable BathyThermograph | XBT | ■ |
CMAR XBT profiles - link to layer metadata XBT Profile Data - link to layer metadata |
Records - 5 Deepest: db,Records - 2 Deepest: db |
| multibeam sonar | MBS | ■ | MNF singlebeam TOPAS sub-bottom profiler | Records - 31 Deepest: db |
| Water quality and chemistry | WQ_C | ■ |
CMAR Hydrology - link to layer metadata |
Records - 46 Deepest: db |
| CTD sensor | CTD | ■ |
ARGO profile map - link to layer metadata CMAR CTD Data Overview (1982 - present) - link to layer metadata |
Records - 9 Deepest: db,Records - 26 Deepest: db |
| sediment grab and core samples | SG | ■ | Seabed sediments sampling | Records - 2 Deepest: db |
| diver visual | DV | ■ |
Reef Life Survey (RLS) Sites (http://reeflifesurvey.com) - link to layer metadata |
Records - 48 Deepest: db |
| midwater acoustics | MW_A | ■ |
MNF singlebeam EK60 38-120 kHz (Southern Surveyor) MNF singlebeam EK60 12kHz (Southern Surveyor) |
Records - 711 Deepest: db |
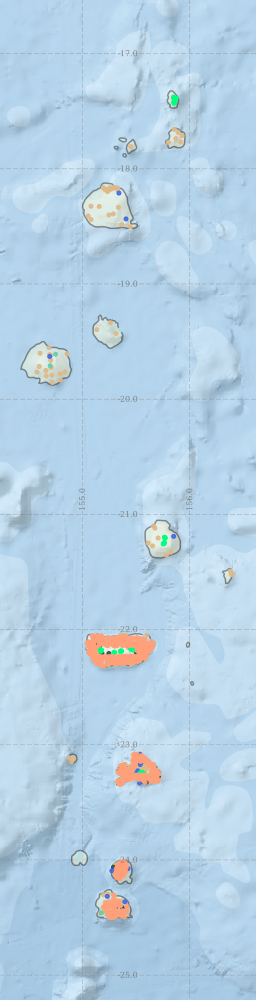
Region extents: 154° 25.7' E 24° 29.9' S to 156° 24.1' E 17° 19.4' S Refresh map
Acknowledgements: Background map - Bright Earth e-Atlas Basemap v1.0 (AIMS, GBRMPA, JCU, DSITIA, GA, UCSD, NASA, OSM, ESRI) CC BY
Time series plot (1930 to present) - Y axis is per year
Region data
Show data list
| Year | CTD | DV | MBS | MW_A | OB_ACM | SG | WQ_C | XBT |
| 1968 | 1 | |||||||
| 1980 | 4 | |||||||
| 1981 | 2 | |||||||
| 1983 | 14 | |||||||
| 1988 | 2 | |||||||
| 1991 | 2 | 5 | ||||||
| 1992 | 7 | 145 | 6 | |||||
| 1993 | 19 | 244 | 19 | |||||
| 1995 | 2 | |||||||
| 1996 | 2 | |||||||
| 1997 | 7 | |||||||
| 1999 | 7 | |||||||
| 2000 | 4 | |||||||
| 2003 | 1 | |||||||
| 2004 | 1 | 2 | ||||||
| 2005 | 5 | |||||||
| 2006 | 1 | 8 | ||||||
| 2007 | 2 | 18 | ||||||
| 2008 | 5 | |||||||
| 2009 | 2 | 1 | ||||||
| 2011 | 2 | |||||||
| 2012 | 1 | 31 | 711 | 2 | ||||
| 2013 | 48 | |||||||
| 2014 | 1 |