Please login if you have access to particular applications.
Provider: All providers | |
Key Ecological Features | |
| Name: | Albany Canyons group and adjacent shelf break |
| Region: | South-west |
| Area: | 7,824.06 km2 |
| Data aggregated on 2025-12-11 08:00 | |
The following is the list of gear types used within this region. Click on 'gear type' for a detailed report of that gear.
| Gear Type | Code | Map colour | Layers used | Summary |
|---|---|---|---|---|
| ocean based acoustic current meter | OB_ACM | ■ |
CSIRO NCMI Acoustic Doppler Current Profiler data - link to layer metadata NOAA drifting buoys (map) |
Records - 1055 Deepest: db,Records - 89 Deepest: db |
| eXpendable BathyThermograph | XBT | ■ |
CMAR XBT profiles - link to layer metadata |
Records - 10 Deepest: db |
| multibeam sonar | MBS | ■ |
RV Investigator EM122 multibeam MNF singlebeam TOPAS sub-bottom profiler |
Records - 4 Deepest: db |
| Water quality and chemistry | WQ_C | ■ |
CMAR Hydrology - link to layer metadata |
Records - 28 Deepest: db |
| Zooplankton samples | ZP | ■ |
SOOP AusCPR zoop trajectory map - link to layer metadata |
Records - 6 Deepest: db |
| CTD sensor | CTD | ■ |
ARGO profile map - link to layer metadata CMAR CTD Data Overview (1982 - present) - link to layer metadata |
Records - 21 Deepest: db,Records - 23 Deepest: db |
| sediment grab and core samples | SG | ■ |
Seabed sediments sampling MNF Sediment Sampling sites - all voyages |
Records - 22 Deepest: db,Records - 20 Deepest: db |
| demersal trawl or sled | DT_S | ■ |
CMAR Catch Operations Data overview (1965 to current) - link to layer metadata |
Records - 1 Deepest: db |
| Continuous Plankton Recorder | CPR | ■ |
CPR Plankton Colour Index Survey - link to layer metadata CPR Zooplankton Abundance Survey - link to layer metadata CPR Phytoplankton Abundance Survey - link to layer metadata |
Records - 30 Deepest: db |
| midwater acoustics | MW_A | ■ |
MNF singlebeam EK60 18-333 kHz (RV Investigator) MNF singlebeam EK60 38-120 kHz (Southern Surveyor) MNF singlebeam EK60 12kHz (Southern Surveyor) |
Records - 35 Deepest: db |
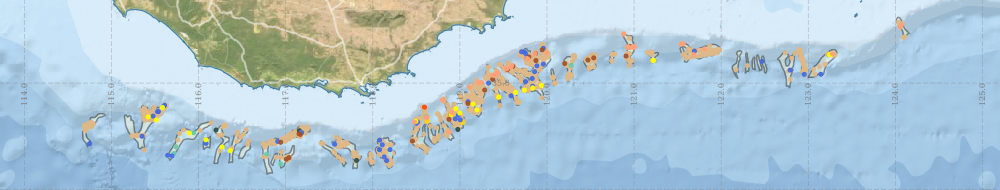
Region extents: 114° 40.1' E 35° 51.5' S to 124° 09.5' E 34° 22.9' S Refresh map
Acknowledgements: Background map - Bright Earth e-Atlas Basemap v1.0 (AIMS, GBRMPA, JCU, DSITIA, GA, UCSD, NASA, OSM, ESRI) CC BY
Time series plot (1930 to present) - Y axis is per year
Region data
Show data list
| Year | CPR | CTD | DT_S | MBS | MW_A | OB_ACM | SG | WQ_C | XBT | ZP |
| 1962 | 2 | |||||||||
| 1971 | 1 | |||||||||
| 1982 | 2 | |||||||||
| 1987 | 6 | 6 | 4 | |||||||
| 1994 | 3 | 1 | 3 | 4 | ||||||
| 1995 | 8 | |||||||||
| 1996 | 21 | |||||||||
| 1997 | 11 | |||||||||
| 1998 | 9 | |||||||||
| 2000 | 5 | |||||||||
| 2001 | 3 | |||||||||
| 2002 | 3 | |||||||||
| 2003 | 2 | 4 | 2 | |||||||
| 2004 | 4 | 20 | ||||||||
| 2005 | 1 | 1 | 2 | 34 | ||||||
| 2006 | 3 | 2 | 1 | 12 | ||||||
| 2007 | 5 | 1 | ||||||||
| 2008 | 2 | 2 | ||||||||
| 2009 | 2 | 8 | ||||||||
| 2010 | 8 | 1 | 2 | 1 | ||||||
| 2011 | 22 | 3 | 7 | 5 | 2 | 3 | ||||
| 2012 | 2 | 26 | 4 | |||||||
| 2013 | 1 | 1 | 1 | |||||||
| 2014 | 1 | |||||||||
| 2015 | 2 | |||||||||
| 2016 | 2 | 1 |