

Habitat preference NOWcasts
"Nowcasts" showing areas of preferred SBT habitat based on environmental conditions in the Great Australian Bight during the most recent week available. Age-specific habitat preferences were calculated using sea surface temperature (SST) only, and using SST and chlorophyll a combined (see Estimating habitat preferences).
Observed conditions for nowcasts
Left: Average SST (°C) over the most recent week available. Right: Average chlorophyll a (mg/m3) over available days of the corresponding week. White indicates no data were available during that period. The dark grey, black and light grey lines indicate the 100 m, 200 m and 1000 m depth contours.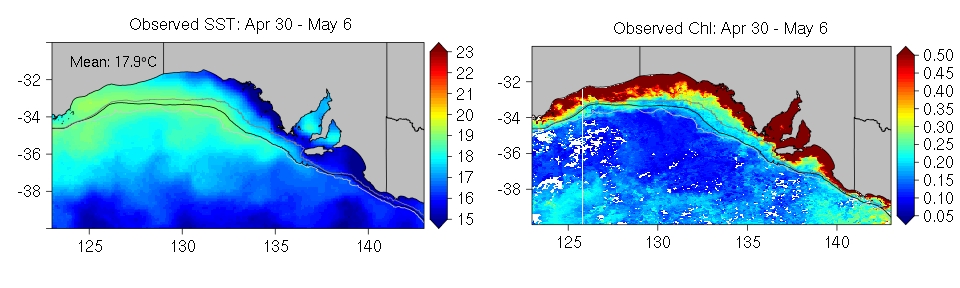 Full-size image
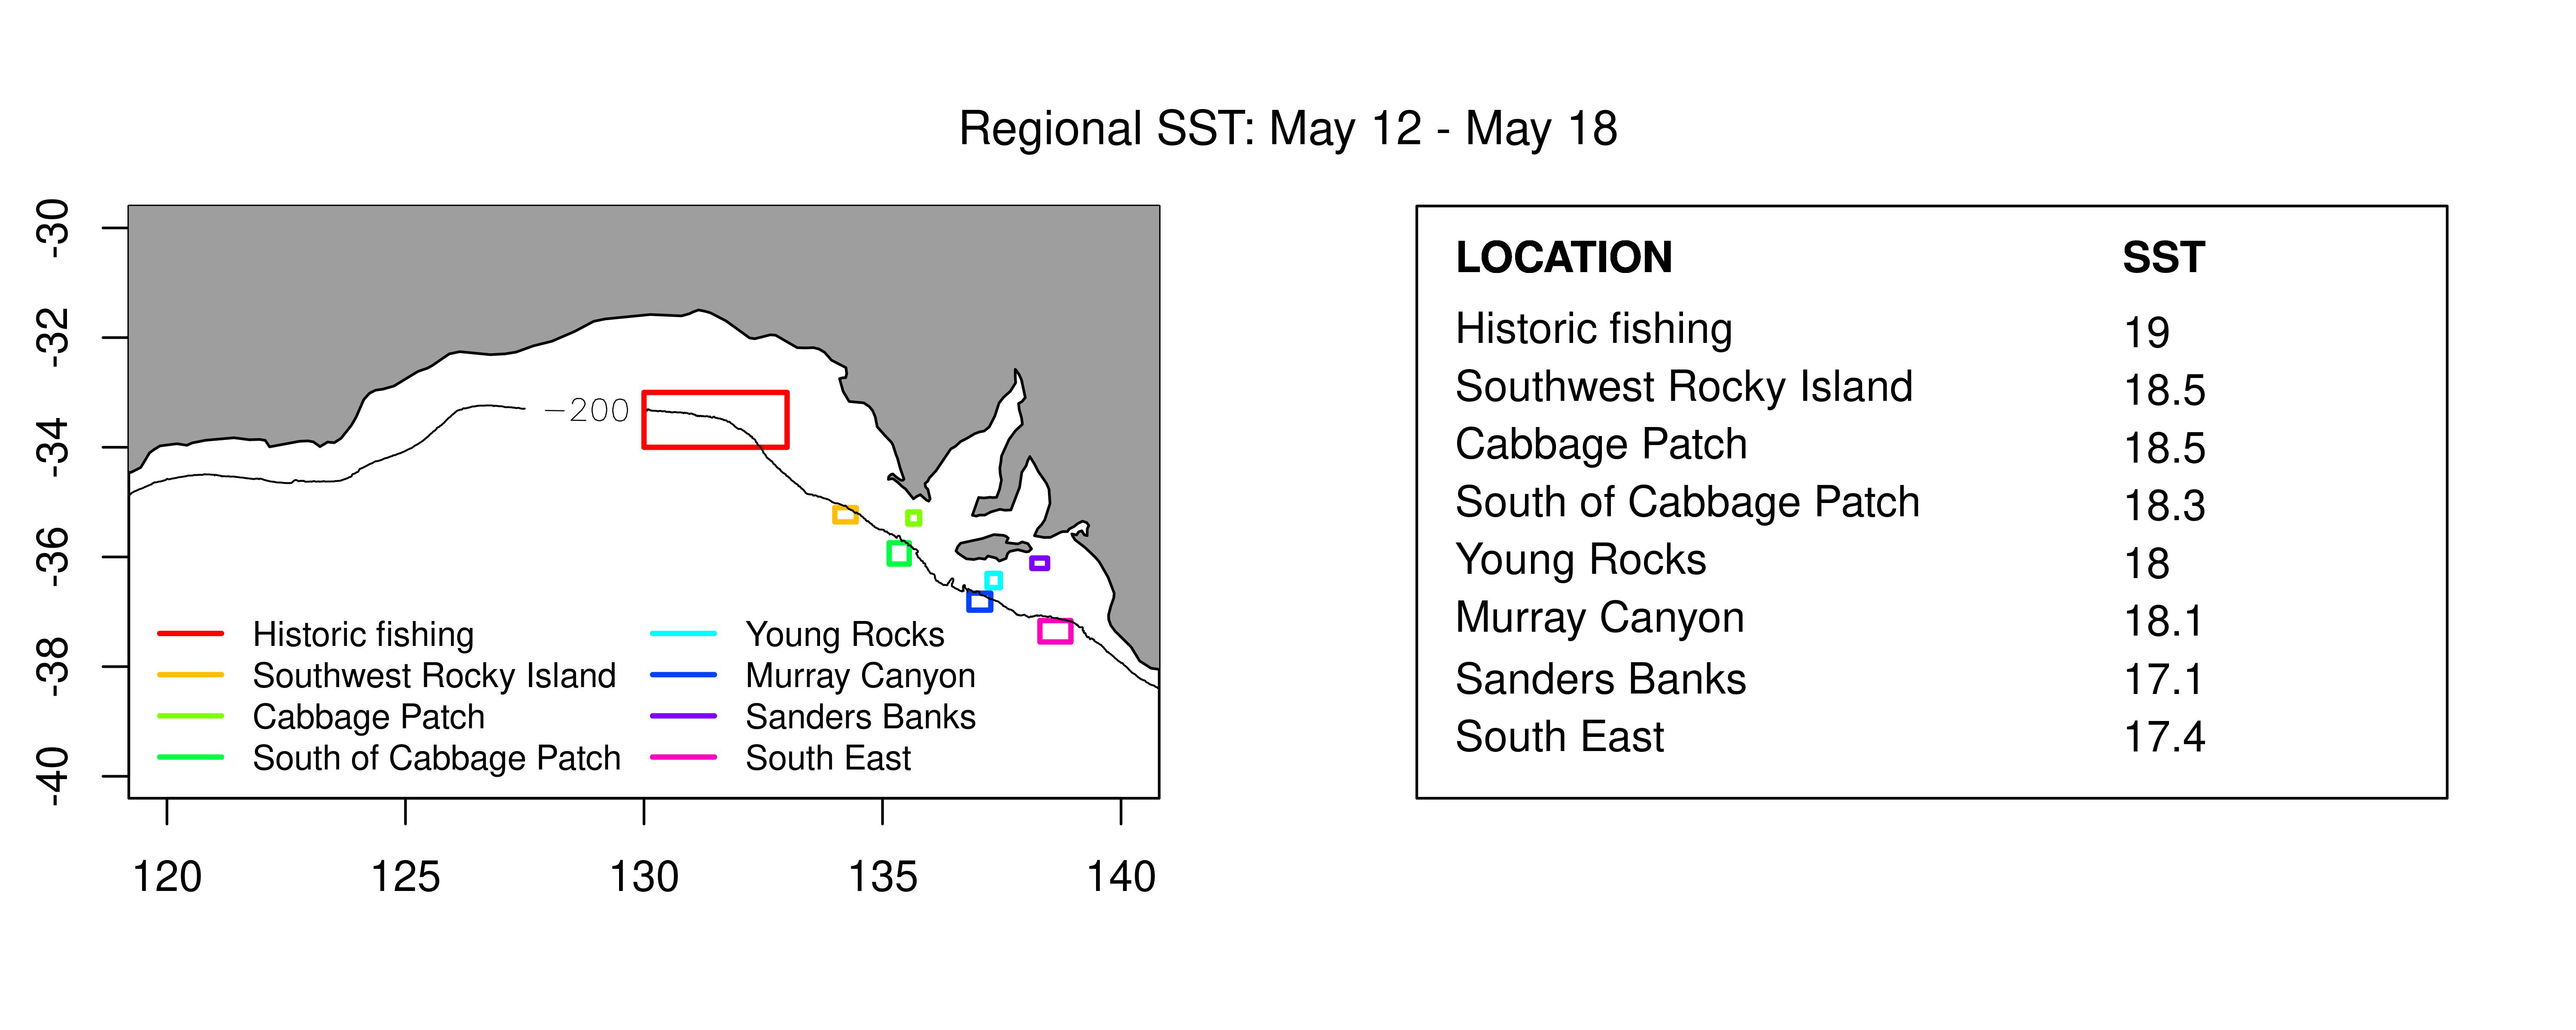
Average SST (°C) over the most recent week available in specific regions of interest.
Habitat nowcasts: SST only
Maps showing areas of preferred habitat based on SST only for age 2 fish (left) and age 3-4 fish (right). Values > 1 indicate more preferred habitat, values < 1 indicate less preferred habitat.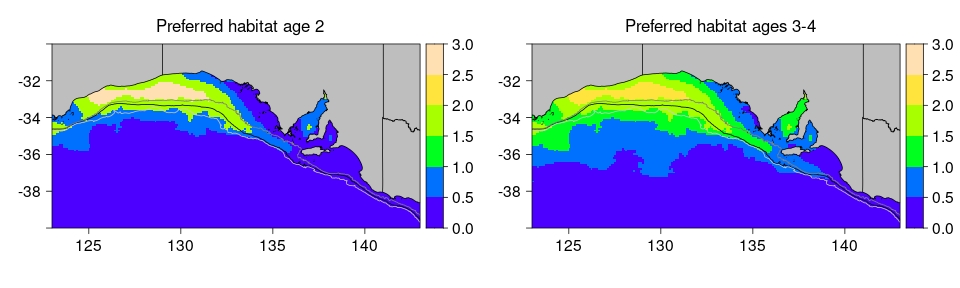 Full-size image
Habitat nowcasts: SST + chlorophyll
Maps showing areas of preferred habitat based on SST and chloropyll a combined for age 2 fish (left) and age 3-4 fish (right). Values > 1 indicate more preferred habitat, values < 1 indicate less preferred habitat. White corresponds to areas where no chlorophyll data were available.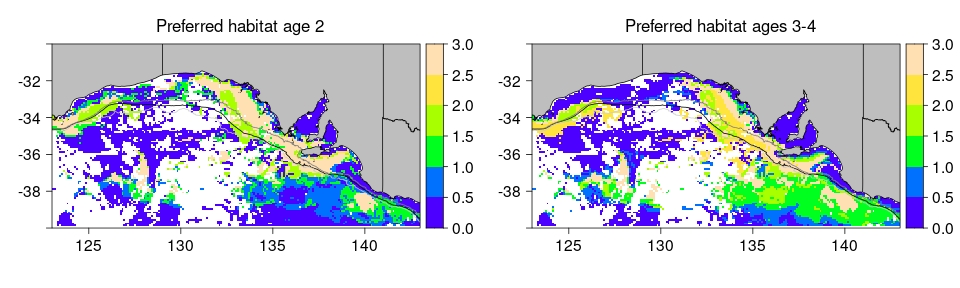 Full-size image