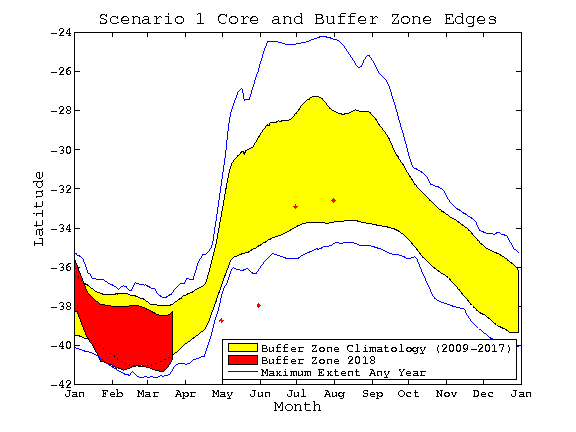
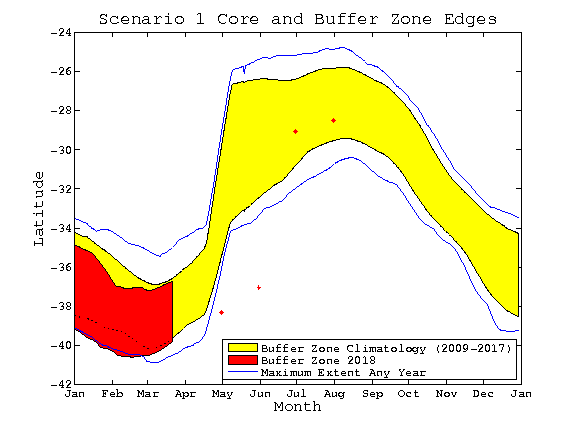
Buffer zone climatology
Climatology showing the mean position of the buffer zone throughout the year is indicated by the yellow band and is based on an analysis of satellite SST and sub-surface temperature from 1994 to the end of last year. The blue lines indicate the maximum northerly (5%) and southerly extent (5%) of buffer pixels in any year. For the climatology the position of the buffer zone is estimated as the upper and lower 5% of buffer pixels in the current year is depicted by the red band. This may not reflect the optimal placement of the buffer zone, and is intended as a guide to the seasonal movements of the SBT habitat preferences. Scenario 1 is the 80:15:5 habitat division. The red stars show the location of the core zone in this climatology for the 1 to 5 month forecasts.
Regular Mode: coast to 170°E
Inshore Mode: coast to 155°E