Production of the multi-day-average SST imagery stalled over the Christmas-New Year break.
This outage affects our large-area graphics products and the outer-zoom level of the Google Earth imagery.
We hope this may be rectified next week. 14 Jan: Fixed.
23 December, 2014: Restored production of kml files for viewing in Google Earth
 Just in time for the Sydney-Hobart yacht race, we have been able to resume publication of satellite data in kml
format. These files are viewable in Google Earth (or similar applications), allowing the user to
overlay data from other sources (such as the
positions of yachts)
on our imagery. What's new? We
used to step through the satellite imagery overpass-by-overpass. This showed great detail in cloud-free areas
but was very slow to load up because there are so many files. So we have switched to fewer images, each with data
from several satellites. These are the L3S 1-day composites produced by BoM for IMOS but you only see these when
you have zoomed in on a small enough region. When you are zoomed out, you will see the 3-day composite images
(the longer interval means fewer regions unseen through cloud). Velocity estimates from altimetry are also only
shown once you have zoomed in. Why do we show the anomaly of temperature, rather than the actual temperature?
Because a colourbar stretching from 5°C to 30°C would be too broad for local structures to show clearly.
As well as allowing use of a compressed temperature scale, showing anomaly also answers the question of whether
the water is warmer than usual or not.
Just in time for the Sydney-Hobart yacht race, we have been able to resume publication of satellite data in kml
format. These files are viewable in Google Earth (or similar applications), allowing the user to
overlay data from other sources (such as the
positions of yachts)
on our imagery. What's new? We
used to step through the satellite imagery overpass-by-overpass. This showed great detail in cloud-free areas
but was very slow to load up because there are so many files. So we have switched to fewer images, each with data
from several satellites. These are the L3S 1-day composites produced by BoM for IMOS but you only see these when
you have zoomed in on a small enough region. When you are zoomed out, you will see the 3-day composite images
(the longer interval means fewer regions unseen through cloud). Velocity estimates from altimetry are also only
shown once you have zoomed in. Why do we show the anomaly of temperature, rather than the actual temperature?
Because a colourbar stretching from 5°C to 30°C would be too broad for local structures to show clearly.
As well as allowing use of a compressed temperature scale, showing anomaly also answers the question of whether
the water is warmer than usual or not.
 Update:
we have now finished a revision of the gliders page, and activated regular updating of both the
Seaglider and Slocum glider plots. Site navigation is also improved. To dive in, start at the Notes page. Positions of the gliders can also be seen relative to
ocean current features at the satellite imagery pages. For example, the image for Tasmania on 23 November shows a Slocum glider crossing a cold north-flowing
current to reach the edge of warmer East Australian Current waters offshore.
Update:
we have now finished a revision of the gliders page, and activated regular updating of both the
Seaglider and Slocum glider plots. Site navigation is also improved. To dive in, start at the Notes page. Positions of the gliders can also be seen relative to
ocean current features at the satellite imagery pages. For example, the image for Tasmania on 23 November shows a Slocum glider crossing a cold north-flowing
current to reach the edge of warmer East Australian Current waters offshore.
We have now finished a first version of a suite of plots of all the IMOS ANFOG Slocum glider and
Seaglider data. To dive in, start at the Notes page. Apology: we
haven't yet added the tracks to all the historical SST imagery, just the two most recent Seaglider
missions (off Perth and in the eastern
Great Australian Bight).
29 Aug, 25 Sep, 2014: Deep and Shelf Array moored current-meter data
 We have
now plotted all the Deep Array ADCP data, and re-plotted all the ANMN Shelf and NRS ADCP data. See
today's note on our timeseries page for more info.
We have
now plotted all the Deep Array ADCP data, and re-plotted all the ANMN Shelf and NRS ADCP data. See
today's note on our timeseries page for more info.
8 Aug, 2014: SST geo-location errors, and loss of NOAA16
Geo-location of NOAA15 AVHRR SST imagery has had some very large (up to 50km) errors since 15 July 2014
so we are re-generating composite high-resolution imagery and animations from then to the present, using
just NOAA18 and 19. It is unclear if NOAA15 imagery will be usable in future. This news is on top of the
fact that NOAA16 data became unusable on 5 June 2014. So we are now
down to just half the number of satellites being used, which means fewer chances per day to see the
ocean between clouds, and thus poorer composite images.
The IMOS SRS has resumed processing and distributing MODIS data (from a CSIRO thredds
server), now that problems at the NCI have been overcome. We have generated our standard suite
of graphics so the archive is now complete.
11 June, 2014: Another year of ANMN moored current-meter data
The archive of Australian National Mooring Network data is growing and growing. The data-processing and
our plotting of that data has also been improved. See today's note on our timeseries
page for more info.
7 Nov, 2013: Better geo-location of SST imagery
The IMOS SRS facility recently found and corrected a bug in the CAPS software used at BoM for processing
the raw AVHRR data downlinked directly from the NOAA satellites. The result is that the geo-location of
SST images is now (since 13 Sept) much more accurate and precise (although the timeliness of the
high-precision view-angle solver is still occasionally an issue). The last month's high-resolution
animations are noticeably more stable, making the movement of ocean features easier to see, especially
for the most zoomed-in regions.
Cryosat-2 has just resumed operating after a 10-day outage (its first). Jason-2 suffered a similar-length
outage in early September.
 After a long outage due to problems at the NCI, the IMOS SRS is now about to resume production of MODIS
chlorophyll-a imagery. The processing system has been updated to SeaDAS7.0, which includes the latest
calibration, so the chlorophyll estimates are quite different to the SeaDAS6.0 estimates produced
earlier.
After a long outage due to problems at the NCI, the IMOS SRS is now about to resume production of MODIS
chlorophyll-a imagery. The processing system has been updated to SeaDAS7.0, which includes the latest
calibration, so the chlorophyll estimates are quite different to the SeaDAS6.0 estimates produced
earlier.
14 Oct update:
problems at the NCI have been continuing, so updating has not been regular at all.
Its being worked on, but the immediate problem is the federal shut-down in the US. 13 Nov update:
Recovery from the shut-down is still incomplete, as is resolution of infrastructure problems at the NCI.
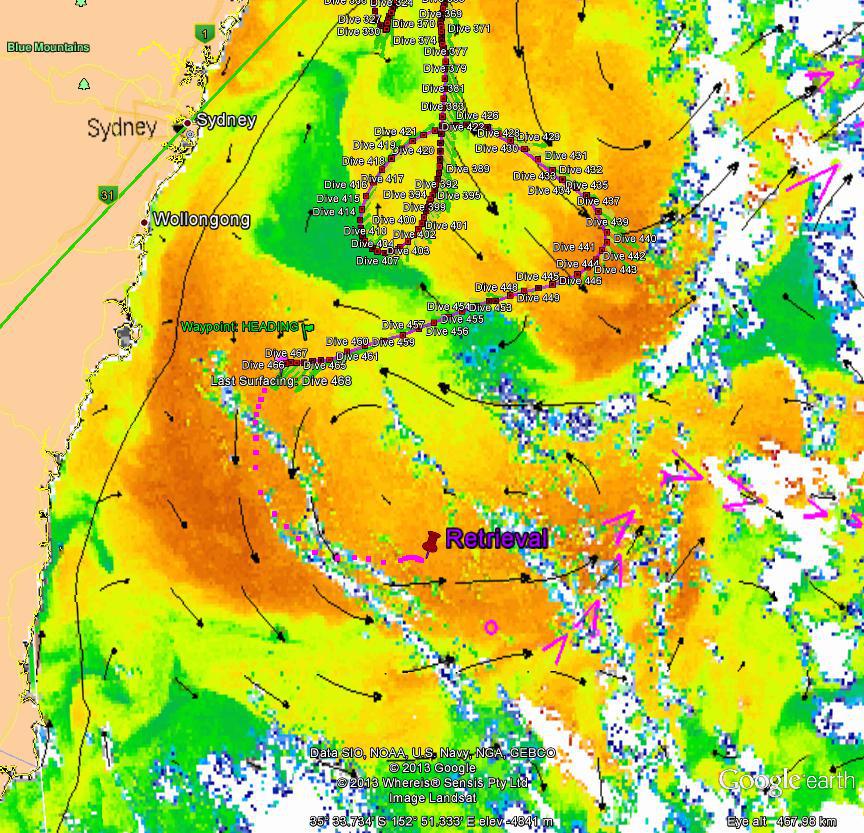
29 July 2013: Retrieval of Seaglider 130nm off Jervis Bay
 IMOS
Seaglider 516 seemed to be on track for an orderly recovery somewhere close to Jervis Bay last week. Its
ability to glide across a strong ocean current was being used to the full to get it out of a warm core
eddy off southern NSW. Suddenly, however, the battery voltage dropped faster than expected, making
glides to depth in a chosen direction impossible. Disabled, the glider drifted at the surface with the
current, being pushed back towards the centre of the eddy by strong winds that also made recovery
impossible. Faced with the very real possibility that the glider would follow a nearby satellite-tracked
surface drifter off into the Tasman, NSW-IMOS elected to charter a fishing vessel and make an overnight
trip out to the glider as soon as conditions were suitable. The strategy paid off and the glider was
retrieved early in the morning, 130nm from shore as shown at right (click to expand).
IMOS
Seaglider 516 seemed to be on track for an orderly recovery somewhere close to Jervis Bay last week. Its
ability to glide across a strong ocean current was being used to the full to get it out of a warm core
eddy off southern NSW. Suddenly, however, the battery voltage dropped faster than expected, making
glides to depth in a chosen direction impossible. Disabled, the glider drifted at the surface with the
current, being pushed back towards the centre of the eddy by strong winds that also made recovery
impossible. Faced with the very real possibility that the glider would follow a nearby satellite-tracked
surface drifter off into the Tasman, NSW-IMOS elected to charter a fishing vessel and make an overnight
trip out to the glider as soon as conditions were suitable. The strategy paid off and the glider was
retrieved early in the morning, 130nm from shore as shown at right (click to expand).
Further to below, comparison of the ANMN mooring current velocity data with the
ACORN radar estimate [e.g. Coffs, 18 Jan 2013] shows some
discrepancy in the directions.
19 August 2013 Update:
Some of the most recent CH files are corrupted and it appears that few or no
ADCP datasets have been rotated to True East and North, so the files on the EMII portal (and our plots) all
need to be corrected. The correction is negligible in WA, and small in SA, so this mainly affects NSW where
magnetic north is 15T. more...
4 July 2013: End of Jason-1's 11-year mission
As mentioned earlier, the Jason-1 altimeter fell silent on 21 June 2013, having
long-outlived its design life. It provided us with an 11-year record of the heaving ocean surface,
following on from its predecessor Topex/Poseidon, then working with its successor Jason-2 in an
optimised tandem mission until October 2011 when it was manouvered into a safer
'graveyard' orbit from where its gradually-changing ground-tracks could scan the globe for undiscovered
bathymetric features while also returning valuable information about ocean currents elsewhere.
The mission engineers have concluded that the transmitter has failed and cannot be restarted. The
satellite could still respond to commands, however, so an orderly termination of the mission was carried
out on 1 July. FFI: [AVISO
Jason-1 page] [e-mail detailing Jason-1's final days].
2 July 2013: ANMN ADCP (moored current meter) data updated
Much of the IMOS data set is only available in delayed time, but OceanCurrent does not yet have an
automatic process for updating the archive of prepared graphics. Today, we completed a refresh of how
the ANMN ADCP data is shown here (see earlier announcement). Comparison of our updated and earlier summary pages shows
that many new data files have become available since March.
Most of those are for late 2012, understandably. See also: highlights of the
new data.
25 June 2013: Inclusion of SARAL data in sea level maps
As mentioned earlier, the Indian and French space agency joint SARAL mission was
successfully launched in February 2013. The quality of the data is evidently very high so we are very
pleased to be able to use it from today in our analysis system. This is much earlier than anticipated,
which is just as well, because (the now very old) Jason-1 satellite experienced a major problem on 21
June and is not telemetering any data.
21 June 2013: New regional SST compositing method
The appearance of the Sea Surface Temperature regional maps (SE, SW ,GAB,
etc) has recently changed because we have commenced using the IMOS
L3S 3-day composite product. The IMOS SST data files are produced at the BoM from NOAA AVHRR
data downloaded directly from the satellites by a consortium of Australian agencies [details], and differs from the (legacy) CSIRO product
because the compositing, quality-control and calibration procedures are all new. In particular, the L3S
is produced as night-only and day-only composites, to retain information about the diurnal variability.
We have chosen not to show the day and night data in separate panels, however, but have merged them to
produce an image with as few gaps as possible. Night-time data is more representative of the temperature
at depth so we use this where available, then fill as many gaps as possible using the day-time data. We
are still experiencing connection problems with the AODAAC server, in which case the legacy CSIRO
product is shown instead, as happened today.
Coincidental problems with IT infrastructure at BoM, NCI and CSIRO (two sites) are preventing our
updating of all forms of SST imagery as well as the chlorophyll imagery.
11 June:
High res-SST are now updating. 12 June
composite SST images are now updating. The
only remaining problem is now at the NCI, where chl-a imagery is stored.
6, 24 May, 8 July 2013: MODIS Chlorophyll-a processing complete for 2002-2012 using
SeaDAS6.4
The IMOS Satellite Remote Sensing Facility has now processed the archive of MODIS imagery using SeaDAS
v6.4. The resulting chlorophyll-a estimates are significantly different (about twice as high) to the
v6.1 processing as shown below so we are keeping the latter on this website for
Aug 2011-now. The v6.4 chlorophyll-a imagery is now plotted for Jan 2002 - Aug 2012, which is the
complete archive. All single-pass images can be reached via the [DATE INDEX] page for each sub-region.
There is also a link to a gallery (e.g. for Brisbane) of the images
with least cloud. See also the large-area composite archive. Data for 2013 will be
available soon, and the real-time production will be switched over to v6.4. The imagery shown here is
all based on the daily-composite files available at the SRS
Thredds server at NCI. We have treated these as synoptic images taken at 0400UTC. (In truth, the
data for the eastern regions is 2h earlier, and for the west it is 2h later.)
24 April 2013:MODIS Chlorophyll-a maps are back
Due to ongoing IT infrastructure problems at the NCI, we have been without updates of MODIS imagery for
the last month. This is now fixed, and our plots are now up-to-date. HF radar data for 2013 has been
added, too.
23, 24 April 2013: Revised altimetry maps for 13-18 April
We noticed a fairly severe problem with the incoming Cryosat-2 along-track sea level data yesterday. The
cause of this has now been identified by the ESA and RADS teams, and the data has been re-issued (details). We have re-made
our sea level maps for April 13 to 18 but will not re-make all other downstream products, especially
since another re-processing may be imminent, because Jason-2 data has become very gappy.
24 April update:
NOAA (RADS) and CNES investigated the shortage of Jason-2 data while Australia
slept, and have identified and corrected the problem (details).
Our supply of real-time high-res SST has been intermittent for some time, so our maps are not updating
as frequently as usual. A new L3U data-coverage monitoring system has
now been established. The availabilty of good SST data is shown for a number of regions around
Australia, for the last 30 days. The analysis is repeated three times a day. In the upper panel, red
indicates high data density while blue can mean either cloudy conditions, or lack of data from the
satellites. The lower panel shows the availability of data from individual NOAA satellites.
23 April update:
The cause of the data scarcity has now been found, but it will be 24-48h before
the supply of data returns to normal.
With the migration of the IMOS data storage from ARCS to MU now complete, the flow of HF radar data
(from the WERA radars run by the ACORN facility) has now been restored. We have added the 2013 data to
the appropriate SST maps. Notable examples for each region are:
27 March 2013: ANMN Shelf mooring array (ADCP) data
Under IMOS, an unprecedented number of Acoustic Doppler Current Profiler moorings have been deployed in
Australian continental shelf waters. The data availability for each location (summarised in 6 pages
spanning two 3-year periods for south, east and west sectors) is now shown at our new time-series page. The quantity shown on the data-coverage summary pages is the
magnitude of the depth-average velocity. By clicking on those summary pages you can see
page-per-deployment plots of the velocity and backscatter profile data, and timeseries of the bottom
temperature, tilt and depth. To complement these time-series views of the data, arrows depicting the
layer-averages of all these ADCP velocity data have now been added to many of the regional maps (for
2011-2012 so far). Some highlights of what the ADCP data reveal about the ocean are discussed in a Ocean News Item.
26 March - 7 April 2013: Jason-2 in safehold mode - twice
Jason-2 has just done what Jason-1 did recently, and put itself into its stable sun-pointing safehold
mode. This is an automatic response triggered by a wide range of malfunctions, designed to prevent the
satellite from ever becoming uncontrollable. The CNES and NASA teams are now investigating the cause of
the incident, and will re-start normal functioning as soon as possible, which may be a day or a week or
longer, depending on the cause of the problem.
3 April update:
Jason-2 was re-started on 30 March but after a few hours it went back in to
safe-hold. Mission engineers are investigating. 5 April update:
Jason-2 is being re-started today
using the 'spare' electronics module. There is a risk of a slight mis-calibration using this unused
electronics. We will watch for a spurious height shift using our standard QC procedures: [constellation intercomparison] [ascending vs. descending track intercomparison]. 7
April update:
Jason-2 seems to be working perfectly well, with no discernible miscalibration. Since
Jason-2 is the reference mission, this comes as a big relief to the altimetry community.
14 & 21 March 2013: Jason-1 expected to be functioning again on 18 March
CNES and Thales Alenia Space have completed diagnostics of the satellite and recovery operations are
nearly complete, so normal functioning is expected to be resumed by 18 March. The interupt occurred as
the satellite passed through the South Atlantic Anomaly, where the density of energetic particles is
very high, frequently upsetting the sensitive electronics of satellites.
21 March Update
Jason-1 data is flowing again but is mostly being rejected by our automatic QC procedures. CNES and NASA warned us of this
possibility and are working on a correction. The satellite's batteries became over-charged during the
safehold, and now the payload bay has become overheated.
5 March 2013: Possible loss of Jason-1
Nearly coincidentally with the launch of SARAL, the Jason-1 satellite went in to safehold mode on 28 Feb
2013. Launched on 7 Dec 2001, the satellite is well beyond its design lifetime so it will not be a
surprise if recovery of the mission is not possible. Our sea level maps are now being made using data
from just two altimeters- Jason-2 and Cryosat-2 so users are advised to check the (dotted) locations of
track lines. A significant ocean eddy can exist undetected in the Jason-2 inter-track spacing during the
period when Cryosat-2 is sampling elsewhere.
25 Feb, 5 and 14 March, 2013): Successful launch of SARAL, the Indo-French
altimetry mission
The accuracy of the sea level maps shown on this site is critically dependent on adequate sampling of
the globe by the multi-agency constellation of altimetry missions. The SARAL satellite carries the
Altika altimeter, which operates at a higher frequency than existing altimeters, promising to give
higher along-track resolution as well as greater accuracy than previous altimeters. We will be
evaluating the data from this mission as members of the international science team, of which we are
fortunate to be a member. At the first opportunity, our published maps will benefit from this extra
supply of data. [Indian Space Research Organisation news] [AVISO news].
5 Mar Update: The altimeter was activated shortly after launch (on 26 Feb) and found immediately to
be working as expected. Orbital maneuvers are taking place to put the satellite on 13 March in its exact
orbit. 14 Mar update: Final orbit has been successfully reached.
31 Jan 2013: Southern Ocean, Timor Passage and Christmas Island regional maps
Three new rectangles on our index page take you to preliminary versions of imagery for
three new focus regions. The Southern Ocean maps are centred on the IMOS Southern Ocean Time Series mooring, to help place the data
from that mooring in a spatial context. The Timor Passage maps show the
spatial context of the Indonesian Throughflow deep water and shelf transect arrays. Mooring data (presently up to 21 July 2012 for ITF shelf) will continue to be
added to the maps. Good imagery is fairly rare for these tropical and southern regions, especially
during the wet season in the tropics. Note also that spurious current velocity estimates at the Timorese
and Indonesian coasts is because our sea level analysis system does not use coastal tide gauge data for
those coasts.
14 December 2012 (& 15 Feb 2013): Re-processed sea level maps for 1993-2012
Visitors to this website will be familiar with the maps of sea level and derived geostrophic surface
currents that we produce in near-real-time by combining the data from tide gauges and the radar
altimeters carried by the Jason/Envisat/Cryosat-family satellites. We call this data product NRT GSLA
(Near-Real Time Gridded Sea Level Anomaly). An important objective of the OceanCurrent project
is to produce higher-quality versions of GSLA based on re-processed (or 'delayed mode') altimetry data
distributed by the space agencies. The reprocessed data are superior to the near-real-time data for many
reasons that we will not attempt to summarise here. Our first re-analysis (DM00) of these data is now
complete and is available from the EMII Thredds
server. Documentation outlining the methods and validation of the processing is in preparation.
In the mean time, please see our poster and Conference Proceedings paper prepared for the 20 years of progress in radar altimetry symposium
held in Venice, Italy in September, 2012.
15 Feb 2013 update:
Plots of all the DM00
data can be seen via the [Date Index] links on the larger-scale map series, e.g.: SE
region.
12 October 2012: Persistent problems with major IT infrastructure - but all good today
Users will have noticed that many sections of this website have not been updating recently. This has been
due to IT problems at several places in addition to ARCS. We are working to reduce the occurences of
outages. HF radar and chlorophyll-a data are up-to-date today. We hope to keep it that way.
24 August 2012: Data system functioning again
An upgrade to the ARCS Data Fabric has now been completed and data is flowing again but a few issues
still need to be addressed. We apologise in advance if any outages recur while these issues are being
finalised.
8 August 2012: Data system outage
Numerous components of our data sytem have been having problems, so supply of various data streams is
interrupted. We hope that full service will be restored soon.
10 July 2012: SST, Chlor-a and radar all updating
The chlorophyll-a imagery is now updating automatically, daily at 10:30-11:00am Hobart time, which is
shortly after the data become available from the previous afternoon's overflight. Updating of SST
imagery has been restored, as has HF radar. We hope to have updating of SOOP restored soon.
6 July 2012: SST not updating
SST imagery has been largely unavailable since 25 June. The IMOS SRS is aware of this and are working on
it.
The NASA Aqua and Terra satellites carry the MODIS instrument,
which is a much more advanced type of radiometer than the AVHRR sensors that we have relied on for many
years for images of sea surface temperature. MODIS measures the radiation emitted by the ocean in many
more spectral bands, allowing many properties of the ocean to be estimated in addition to its
temperature. A key property is the colour of the water because this is an indicator of the concentration
of chlorophyll-a in the water, which is in turn an indicator of the phytoplankton biomass in the surface
layer of the ocean. Our use of the term 'indicator' is very deliberate, in both instances, but this is
not the time or place to elaborate on this. The IMOS SRS
facility has recently finished the first long (Aug 2011- now) production run of MODIS (on Aqua, but not
Terra) data products and made these available for download.
These estimates of the chlorophyll-a concentration (using the MODIS SeaDAS v6.1 OC3 algorithm) are now
shown here for Aug 2011- now, for the same set of regions for which we show single-pass SST at
high-resolution. Images for dates earlier than Aug 2011 will be shown once the IMOS SRS facility
produces the data products, which will be after they complete the implementation of SeaDAS 6.4. May 2013 Update on SeaDAS6.4
implementation
MODIS has higher spatial resolution than AVHRR but since there are more AVHRR sensors flying, and
thermal emission occurs equally in day and night, we have many more images of the ocean's temperature
than its colour, which can't be seen at night. For this reason we presently show, for all the
high-resolution regional plots, each image from the satellite separately, with gaps unfilled by earlier
data since this is probably quite old. Large-area, time-composite images are being prepared. An initial
version that uses the same technique of continuous overwriting that we use for high-res SST is shown for
the whole Australasian region (reached by clicking outside the regional
rectangles).
May 2013 Update: The following paragraphs now also includes links to the new v6.4 images.
The new
colour bar starts at 0.03mg/m3 instead of 0.02 to reduce the effect of a calibration difference which is
quite obvious if you look through the image pairs below for 2011-2012. The new images also include ANMN data and delayed mode (instead of the near-real time)
altimetry maps.
The beautiful image for 28 May 2012 off Perth [v6.4] shows that the warm Leeuwin Current water sometimes has (somewhat
paradoxically, considering its tropical origin) higher chlorophyll-a concentration than the colder
waters offshore. A few months earlier, however, when the Leeuwin was not yet flowing very strongly, the
picture is very different. A good image for 29 Feb 2012 shows the southward-flowing warmer Leeuwin
Current water having clearly lower (surface) chlorophyll [v6.4] than the shelf waters which the radar [
v6.4] sees recirculating anticyclonically over the Perth Canyon, inshore of the faster
flow. Similarly, a little farther north a month earlier, we see high
chlorophyll-a [v6.4] on the southern, cooler side of an offshore-directed meander of the Leeuwin
Current. The positive divergence of the radar velocity estimates suggest that the high chlorophyll water
is being upwelled.
Moving downstream into the
Great Australian Bight, a warm-water, high-chlorophyll
eddy of Leeuwin Current water can be seen, by stepping backwards from 12 April 2012 [
v6.4] through 2 April 2012 [v6.4] to 12 March 2012 [
v6.4], to result from meanderings of the Leeuwin Current that eventually became an isolated
eddy off the slope. The clear skies at that time also yielded a beautiful image off the Bonney Coast region [v6.4] where the ACORN radar recorded the
velocities associated with another high-chlorophyll, warm
anticyclonic eddy. Zooming out [v6.4], we see an interesting cyclonic eddy at
40S 136E with a low-chlorophyll centre. We can't leave SA, however, without seeing a beautiful image of a classic summer-time Bonney Coast upwelling event [v6.4] driven by a burst of SE wind driving water alongshore but also away from the coast, drawing
cold water up from below, fuelling the food-chain.
On the east coast, in contrast, we almost always see the usual relationship of chlorophyll [
v6.4] to temperature and sense of rotation, i.e.,
low chlorophyll in the warmer tropical-origin (EAC in this case) waters, or its anticyclonic eddies.
The high resolution of MODIS, and the fact that sometimes there are much stronger gradients of colour
than temperature gives MODIS the ability to show the ocean in greater detail than AVHRR. This is
especially true off the North West Shelf, where a beautiful sequence of chlorophyll
images for late May 2012 [v6.4] show rich
detail associated with southwestward flow along the shelf break while the
SST images for that time show the winter cooling of the coastal waters but not much else.
Another example is the 24 February image for Sydney
[v6.4] showing a small patch of 'green' water at
about 34.3S, 153.5E where there is intense cyclonic shear between the EAC and an eddy that detached from
it some time ago. Looking back through the imagery, it appears that this patch originated at the coastal
bloom. The image also shows the sharp front all along the coast between the warm, low-chlorophyll East Australian Current waters (both the
eddy and the parent current) and the more productive coastal waters.
Images of the Great Barrier Reef [v6.4] are particularly beautiful but note that
the chlorophyll algorithm is not at all accurate where the sea floor can be seen from space. This one
appears to show low-chlorophyll waters flooding north-westwards into the Capricorn Channel, in agreement
with the HF radar data.
To finish this quick introduction to the images for 2012, we draw your attention to the (initial
version, see above) large-area composite image for 20 March
2012 [v6.4] which shows the first
appearance of a cyclonically-rotating, high-chlorophyll-a eddy which is clearly the legacy of TC Lua
which developed off the NWS on 15 March 2012, pausing at the location
where the cyclonic eddy is generated in the ocean. The bloom of high surface chlorophyll can be followed
until about 13 April.
Editor's Choice images for 2011
- North West Shelf on 30 Aug [v6.4] (19S 117.5E and 19S, 116E) and Albany-Esperance on 21 Oct [v6.4](35S 121E), showing small cyclonic
eddies with 20km-diameter, cold, high chlorophyll centres
- Dongara-Perth on 10 Sep [v6.4], showing high-chlorophyll water
being drawn offshore south of a cyclonic eddy
- Recherche Archipelago-Eyre Peninsula on 21 Sep [v6.4], showing a band of low chlorophyll
water between 34S and 36S with detailed frontal structures
- Sydney-Hobart on 25 Aug [v6.4], 22 Sep [
v6.4] and 16 Nov [v6.4] showing a low-chlorophyll
anticyclonic eddy off Bass strait. This eddy is derived from the record-setting
eddy shed by the EAC in January, 2011. If you step through you will see a series of interactions
with the EAC and other eddies in April and June-August. The last image in which it is clearly
identifiable as an isolated eddy is for 6 Dec [v6.4].
- Fraser Isl - Port Stephens on 16 Sep [v6.4], showing the East Australian
Current as a laminar shelf-edge stream of low -chlorophyll tropical water
- Fraser Isl - Cape Byron on 15 Nov [v6.4], showing shear instabilities
- Southern Great Barrier Reef on 17 Sep [v6.4] and 19 Sep [
v6.4], showing the cyclonic rotation of the Capricorn Eddy in the lee of the Swain
Reefs, bringing warm EAC waters into the Capricorn Channel
21 June 2012: Daily updating of HF radar ocean current maps
The flow of HF radar data has resumed and the data are now appearing on this website.
8-13 June 2012: Daily updating of HF radar ocean current maps
The near-real-time processing and display of ACORN HF radar data is now happening routinely every day.
However, the data become available at the opendap server later
than the SST
imagery so you might not see any radar data overlain on the latest SST imagery. Today, the most
recent radar data is for 6 June but this long delay will soon be reduced. To see the radar data, go back
in time using the [PREV] link or go to the [DATE INDEX] and view the animation. Data for the radars off
Perth, Adelaide, Coffs Harbour and Gladstone have been plotted back to 1 January 2012. The
time-averaging of the radar data, and colour-coding of the surface current vectors is chosen for each
panel to be appropriate to the region and the map scale. For the maps showing the closest views of each
radar, the vectors are shown in three colours, depending on whether the radar velocity field at the base
of each arrow is divergent, neutral (|div(
v)|< 5E-6/s) or convergent (see key). On other maps the vectors are either red or blue, whichever
contrasts best with the SST background. The time averaging is described in the key as a range, e.g. 4-12h
for Rottnest, signifying that each point of the radar velocity field is the average of at least 4
1h-averaged values within a 12h interval centered at the time of the SST image. The lower limit of 4 in the
average is a simple way of detecting poor data quality. The purpose of the long upper limit (12h) of the
time-window is twofold: 1) to reduce the influence of tides, and 2) to increase the chance of finding radar
data to include on the SST image. At Coffs, however, we use a shorter time window (2-4h) for the same reason
a sports photographer uses a fast shutter speed: velocity structures often advect through the radar field so
fast that using a 12h time-window blurs all the detail. The time-averaged velocity field is shown as curved
arrows using the same technique we use for the altimetric velocity field, which is to compute Lagrangian
trajectories of particles over a chosen time interval. This time interval is shown in the velocity key of
each panel. It is 24h in some and 12h or 6h in others depending on whether strong currents prevail in the
region, and the spatial scale of the map. The advantage of this technique is that a single arrow shows
information for many locations. It is also valuable for communication, because a particle path is a more
tangible concept than a velocity expressed in m/s. Because of the inclusion of the radar and mooring data,
we have now changed the Lagrangian interval for several maps from 24h to 12h. This was because 24h-long
paths are often longer than the area spanned by the Coffs radar, resulting in an incomplete path. We have
also changed the established practice of only saving a graphic image if the latest SST imagery has at least
7% coverage, since even this low quality criterion results in long gaps due to persistent cloud, preventing
plotting of the radar (and other) data. Images are now saved even if the SST image has only 3% new pixels.
29 May 2012: Ocean current measurements from current meters and HF radars
Thanks to IMOS, there is now an unprecedented array of measurements being made of the properties of the
ocean around Australia. We are now adding more and more of these new data types to this website. Today
we have added a small graphics panel for the Coffs Harbour region, where the IMOS ACORN facility has installed a WERA radar that measures the
surface current velocity from the coast out to 100km at times. These data are new and need some
re-calibration (especially south of about 30.7S) but already it is clear that the correspondence of the
radar data with SST imagery and current meter data is good. For example, the radar, SST and ADCPs all
agree that on 30 March 2012 the East Australian Current was
taking a detour around a mass of colder, probably-upwelled water that started to occupy the continental
shelf nearly a month earlier. The EAC subsequently reasserted its dominance during the next week, when a
small cold core cyclonic feature was swept over the mooring array on 1
April 2012. The Acoustic Doppler Current Profiler current meters were installed by the IMOS ANMN facility. Off Coff's there is one on the 70m isobath and
one on the 100m isobath. The ADCP measures the current speed from near the bottom to about 15m from the
surface. Here, we compute averages within a 4h time window for three depth ranges that are shown as
three differently coloured arrows (see key). The length of these vectors is directly comparable to the
curved trajectories but remember that differences can be expected between the subsurface ADCP data and
the surface radar data, and between the ADCP point measurements and the altimetric average over ~50km.
25 May 2012: Jason-1 altimeter back in service
Re-tasking of the Jason-1 altimeter has taken NASA and CNES a little longer than hoped, and nearly ended
in the loss of the mission. Thankfully, however, the satellite is once again producing good estimates of sea level anomaly and today we
produced our first map (valid for 20 May) that included this data in
addition to the Jason-2 and Cryosat data. As mentioned in the 11 April item below, Jason-1 is now in a
different orbit. This is necessarily unsynchronized with Jason-2, and does not result in the same
ground-tracks being regularly resampled. The former orbit was carefully chosen to provide optimal
complementarity to Jason-2. The new orbit will result in a more uneven data density, resulting in an
uneven, and varying level of accuracy in the final map. Perhaps more importantly, the consequence of
being in a non-repeat mission (like Cryosat) is that occasionally the satellite will discover new
seamounts because of the effect these have on the Earth's gravity field and hence the equilibrium shape
of the sea surface. Unanticipated, however, some of these signals will be indistinguishable from sea
surface anomalies associated with ocean currents, thus causing spurious features in our maps of the
flow.
25 May 2012: earlier daily updating of imagery
As part of the recovery (see item below) from the recent SST data outage, we have implemented a data
caching system to make the thrice-daily task of updating the high-res imagery (see 14 Dec 2011 item
below) happen much more quickly. More on this next week....
22 May 2012: Website not updating
There is an upstream problem with the SST data files required for updating some of this website, so some
maps are stalled at 11 May. The high-res imagery viewable by
Google Earth is updating normally. The large-area maps stopped updating on 16 May (for an unrelated
reason) but this has been fixed today.
Update 23 May
BoM identified and fixed the problem yesterday, restoring the flow of data, so this
morning's update of this website proceeded normally. The gap in the image archive will be filled. Update
25 May
The gaps are now filled, except for the odd day, eg 21 May.
14 May 2012: Month-long animations of high-res SST
Follow the [DATE INDEX] link on any of the single-pass SST map series (e.g.:
LordHoweS) and you will find animations for each month for the whole archive of existing high-res
graphics. NB: many of these will soon be revised, with IMOS data added.
Tip
: Use animation editing software like FastMovieProcessor to make the animations just the length
you need, by adding a few of these together. A good way to import them to PowerPoint is to save as an avi
(select MS RLE encoding, quality 100%, data rate 3000kb/s, 12 fps) then in Powerpoint you can use Insert
Movie. NB this inserts a link, not the animation, so keep the avi file in the same directory as the ppt.
19 April 2012: Our URL is now oceancurrent.imos.org.au
We apologise for making yet another change to our URL, but it has been unavoidable. No more changes are
anticipated, so feel free to bookmark this one. We hope no-one bookmarked the recent temporary
'oldportal' URL. The original imos.aodn.org.au/oceancurrent will re-direct to the new URL but its better
to update your bookmark. During the transition, you might have noticed that access to the archive of
Google Earth-viewable imagery was interrupted. This has now been fixed.
11 April 2012: Envisat silent, so only two altimeters
The European Space Agency has lost contact with their Envisat satellite, raising fears that a serious
failure of the satellite has occurred. (
10 May Update:
) ESA has lost hope of recovering control of the satellite and has announced the end
of the mission). Launched in 2002, it is well past its design lifetime, and operating in a mission follow-on
mode in which it does not continuously re-sample the original ground tracks. The consequence for us is that
we are now down to just two altimeters: Jason-2 and Cryosat, since Jason-1 (also past its design life) is
still in safe-hold, a mode in which the satellite remains controllable, but does not make observations. A
series of malfunctions have occurred recently so NASA and CNES are likely to put Jason-1 into a slightly
lower orbit so that if it does fail completely, it won't become an uncontrolled navigational hazard for
Jason-2 and future Jason-class missions wishing to occupy the same orbit. Data from the new orbit might
become available in May. The accuracy of our maps of sea level and geostrophic currents will be
significantly less (on average) with only two altimeters in use compared to when we were using three or
four. The sampling pattern of Cryosat is unlike that of other altimeters. The result now, with just two
altimeters available, is that the accuracy of our maps is very variable in space and time. So please pay
attention to the density of the track lines. The next
altimeter mission, due for launch this year, is the CNES-ISRO SARAL satellite, carrying the AltiKa
altimeter.
3 April 2012: Ship-of-opportunity (SOOP) under-way temperature data now added to maps
Several merchant vessels have been equipped with instrumentation as part of IMOS. The temperature data
are now shown on our maps of high-res SST as a line of colour-filled black circles, eg: [ship passing Sydney near two Argo floats].
3 April 2012: Several recent computer-related problems are now fixed
A few computers have been replaced recently, causing various problems which have now been addressed.
- Our URL had to be changed to a temporary one: oldportal.imos.org.au. Don't bookmark it. Rely on the
redirection we are providing.
- Updating of all high-res SST maps has resumed, and the error rejection has been notably improved.
- The Google Earth viewable imagery is available again, but only for April 2012 onwards. Access to
old images will be re-instated after Easter.
4 March 2012: Cryosat data processing fixed, but Jason-1 data still missing.
The problem with Cryosat (which showed up as a 20cm difference between
ascending-pass and descending-pass estimates of sea level - see our ongoing monitoring) was traced today to a 4ms timing error in the
orbit data processing. The data stream distributed by NOAA is now fixed, so today's maps are improved.
We will re-make recent maps using the corrected data.
1 March 2012: Only two altimeters working - so our sea level maps are suffering.
We are presently only using sea level data from Jason-2 and Envisat, having lost the feed of data from
both Jason-1 and Cryosat on 17 February. Our maps of sea level anomaly and geostrophic currents are
consequently much less accurate. The problem with Jason-1 is understood and advice from CNES is that
data is expected to be good again on 7 March. The Cryosat2 problem appears to be associated with the
orbit calculations. We are awaiting advice
14 December 2011: Website updating re-scheduled
To maximise the use of the latest altimetry data available from NOAA (see 9 Dec news), we've delayed the
start of our sea level analysis slightly. It finished today at 22:14Z (09:14am EDT), about 2h later than
it used to, but this should be thought of as 22h earlier. The latency of the nominal date of the
analysis is unchanged but the distribution of data within the data window is now more symmetric,
effectively bringing the map closer to real-time. Users doing scheduled downloads of digital
data are advised to do so at 2230Z (9:30EDT). The large-scale plotting of SST will commence at
this new time. The high-res plotting will now be done twice each morning: an early update to show the
latest night-time images, then a later update using the latest estimates of currents from sea level.
9 December 2011: CryoSat added to sea level analysis
Today's sea level analysis (valid for 4 Dec 2011) is our first to
include data from the ESA
CryoSat mission. The CryoSat mission is principally focussed on the cryosphere, but its radar altimeter is also capable of measuring fluctuations of sea surface
height like Envisat, Jason-1 and Jason-2 do. Thanks to the efforts of several key individuals at NOAA Laboratory for Satellite
Altimetry, CNES and ECMWF, we now have timely access to accurate estimates of sea surface height
anomaly derived from CryoSat data. The sampling pattern is unlike the other
altimeters: two weeks of sampling yields groups of
closely-spaced tracks. Jason-1 and Envisat are both past their design lives so the value of the CryoSat
data will suddenly increase when either of the older satellites fails, at which point we will be even
more grateful to the CryoSat project team for making the data available for purposes beyond the core ice
mission.
5 December 2011: Switchover to IMOS L3U SST
We are switching over now to using the IMOS SST data products. The zoomed-in maps (left-hand map series)
will be updated from now on using the L3U data
product. One benefit of using the L3U is that we can now produce high-res maps and animations for more
regions around Australia.
4 November 2011: Move to IMOS now complete
Browser requests to http://www.cmar.csiro.au/remotesensing/oceancurrents/ will be 301 redirected by the
CSIRO server to the new IMOS address. Updating your bookmarks and hyperlinks will avoid a dependence on
the CSIRO machine.
20 October 2011: Altimetry data sets now available
The data files of gridded altimetry are now available via OPeNDAP. See the 'Access to data files'
heading.
30 September 2011: Update on our move to IMOS
The initial round of changes to the existing website are now complete but we are not quite ready to shift
the site to the new IMOS address which
presently only shows a subset of all the content.
10 October 2011: Jason-1 update
We've found we can resume using Jason-1 data if we use the less-rapidly delivered version of the data,
which seems not to be degraded, so the maps are much less-affected by the manouvers than if the data was
not used at all.
Jason-1 is close to being de-commissioned and has to burn off its reserves of fuel. The resultant changes
to its orbit are causing errors in the orbit tracking, flowing through to errors in the estimates of
sea-level. We are consequently withholding Jason-1 data from the sea level analysis until the fuel
burning is complete (16 October 2011), which will mean that the sea level maps and geostrophic currents
will be significantly less detailed for the next few weeks, but hopefully free of major errors such as
the one that caused this large disagreement
with Argo. [Jason-1 withheld].
We are very pleased to give notice that this website will soon (September) move to IMOS. Numerous improvements to the site will
be made, as you will see. Continuity of service will be a high priority during the changes and
upgrades. If something looks broken, reload the page, or wait a bit.
25 August 2011: Southern Surveyor heads out to study the oceanic larval stage of Western Rock
Lobster.
[Images] will be sent regularly to the ship so the scientists (led by Prof Anya Waite
of UWA) can choose where to sample with respect to ocean features such as fronts, warm or cold eddies.
20 May 2011: Errors in maps
The sea level maps are presently featuring some long ridges of (~20cm) high sea level that are due to
errors in the incoming data (from the satellites or one of the auxilliary systems) that are too small to
be detected by the automatic quality control. This may not be corrected, unfortunately, for several
weeks.
17 December, 2010 Unattended over Christmas.
The computer systems that update this website will be unmonitored and unmaintained from today until mid
January. If there is no power outage everything is likely to keep running. Apologies for any
inconvenience if any systems fail to keep running. Please also note that we are now down to just two
altimeters since no data is presently arriving from Envisat. Our maps are therefore more likely to be
missing or misplacing features of the flow.
28 October, 2010 Envisat change of orbit
Envisat, one of the three altimeters upon which we rely for mapping sealevel and geostrophic currents, is
no longer remaining in a repeating orbit. See the ESA website for details. This means there is an
increased risk of erroneous features occuring in our maps. Only gross errors will be trapped by our QC
procedures. Users should, as always, look for consistency of the SST and altimetry information in order
to assess the errors of the maps.
March 12, 2010 Altimetry maps now closer to real-time
A major limitation of satellite altimetry is that sea level and ocean current maps made directly from it
are valid for several days in the past, rather than just hours ago. Part of that latency is the time it
takes for the satellites to cover all points on the globe. Another contributor is the time it takes for
all the ground-segment computations to occur. It used to take several months to achieve the level of
accuracy that is now achieved operationally in just a few days. Just recently, JPL announced
availability of a new Jason-1 data product (OSDR-SSHA) with the same very-short latency of the Jason-2
GPS-OGDR. Inclusion of both these data products in our mapping has significantly improved the accuracy
and timeliness of the maps. The histograms of data availability are your way of monitoring the amount of
data going into the maps, a key factor in the resulting accuracy.
January 12, 2010 Seaglider retrieved
Retrieval of the first Seaglider to be deployed off Sydney.
This mission lasted 85days, making many dives to 1000m, sampling the properties of a cold core and a
warm-core eddy before returning to Sydney. FFI:[ANFOG]
October 1, 2009. IMOS Slocum Glider 106 launched off NSW:
Mission: to sample the cold-core eddy off [Newcastle], then rendezvous with
Southern Surveyor. [Australian National Facility for
Ocean Gliders]
April 9, 2009.
Glider 109 retrieved after sampling the eddy. It travelled 710km in 23 days and made
1900 dives.
Sarah leaves Perth, rowing to Mauritius, with refererence to our maps of [Indian
Ocean currents]
March 17, 2009. IMOS Slocum Glider 109 re-launched off NSW:
Mission: to circumnavigate the cold-core eddy off [Newcastle], then return
to the coast.
[Australian National Facility for Ocean Gliders]
February 23, 2009. Jason-1 moves into an inter-leaved orbit, improving our maps
With the intercalibration with Jason-2 now complete, Jason-1 has been moved into a new orbit so the
ground tracks interleave those from Jason-2, giving more observations so our maps can be more accurate.
The last time there were two altimeters in an interleaved orbit was October 2005, the end of the
Topex/Poseidon mission. The question now is how much longer Jason-1, launched in December 2001, will
last.
December 15, 2008. Christmas Season notice:
this website will be unmaintained for a longer-than-usual period this summer while staff are on leave.
The systems should all continue working unattended but outages may occur. We apologise in advance for
any interruption of service. We also apologise for the degraded accuracy of the velocity maps. This is a
consequence of there only being two altimetry satellites useful for inclusion in the maps, rather than
three or four in recent years. A return to three is scheduled to occur in early February 2009, when
Jason-1 moves from inter-calibrating to interleaving Jason-2.
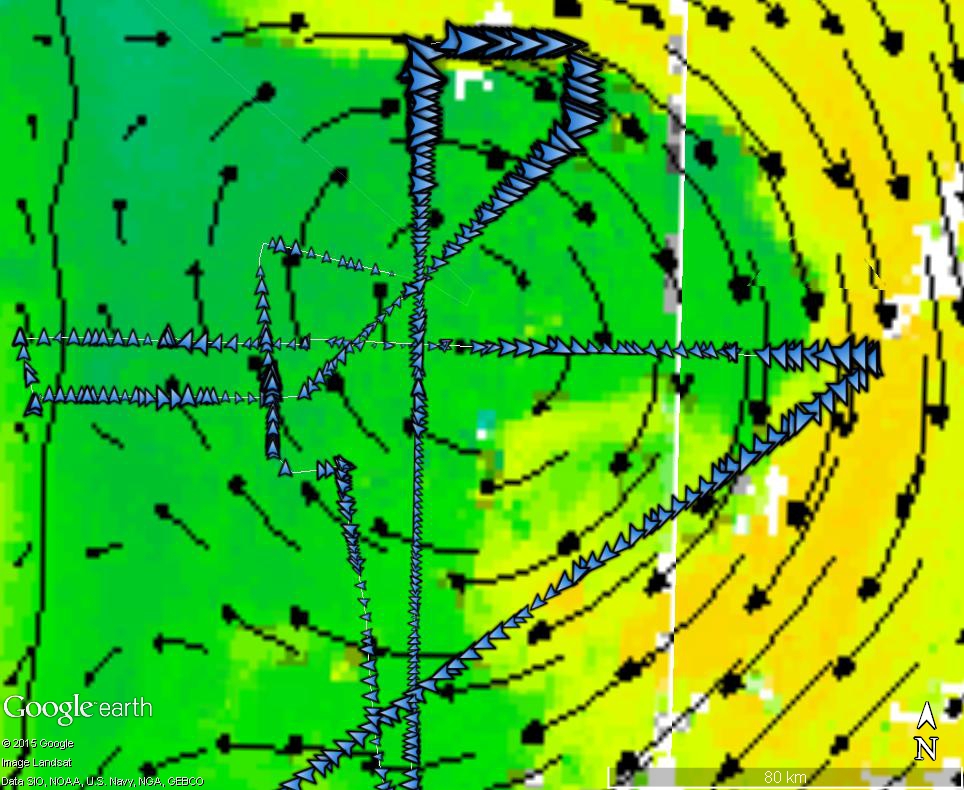
December 11, 2008. Glider 109 update
The glider was successfully retrieved 40km off Jervis Bay after travelling 989km in 15days, an average
of 0.76m/s, or 1.5kt. That's 10km on each alkaline 'c' cell! This economy was achieved principally by
drifting with the current, and using the glider's 0.25m/s horizontal glide velocity to go sideways with
respect to the currents, to get into water thought to be going in the desired direction. The satellite
data posted here helped inform these choices, even though the data quality was low during much of the
deployment due to heavy cloud cover depriving us of SST imagery, and there being only two altimeters
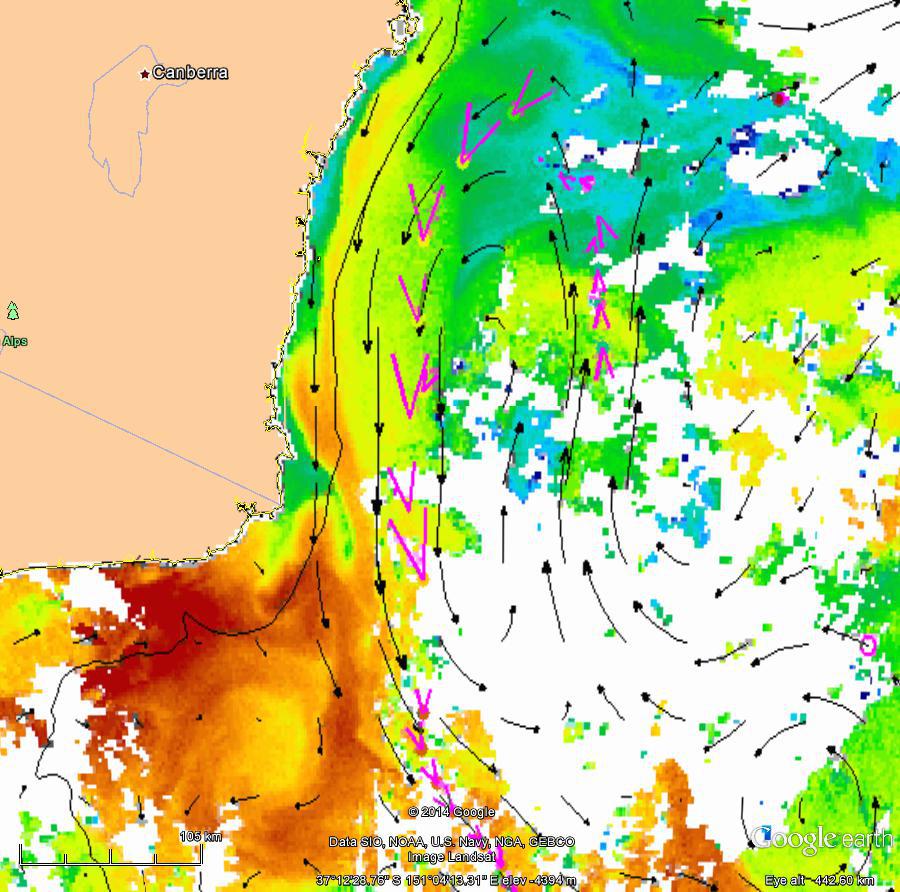
presently useful for estimating currents. The glider's total velocity is the sum of the current (two
estimates, one in black, one in magenta) and the glide velocity (shown in red), which is 0.25m/s in a
chosen direction. Glider velocities overlain on satellite data:[start][1 Dec][end]. (sorry, the glider data is temporarily unavailable)
November 26, 2008. IMOS Slocum Glider 109 ('Nemo') launched.
Mission: to circumnavigate the warm-core eddy off [southern NSW], then
return to the coast.
[Australian National Facility for Ocean Gliders]
[Nemo kmz].
November 21, 2008. Apology for outage.
Sorry about the non-updating of this website over the last 2 weeks. We have been at an altimetry meeting and a software problem occured here.
October 21, 2008: Budget cuts threaten satellites
Budget tightening in Europe and USA is threatening the continuity of space-based earth observations.
Please consider supporting the IOC
petition (
before 30 October
). If the up-coming Sentinel and Jason-3 missions are cancelled, this web site
will cease to update when the existing Envisat and Jason satellites end their missions.
June 20, 2008: Launch of Jason-2 (OSTM).
Watch this crucial event live on NASA TV. The launch
window is 5:46-5:55pm Fri 20 June AEST. Commentary commences 2h before. [more]
[kml file of track] [SST and
currents] [Possible routes]
Two brave souls paddle across the Tasman Sea, with a little help from the East Australian Current and our
maps of it.
Ocean Forecasts (currents, sea level, subsurface temperature, etc) become publicly available in
Australia for the first time.