
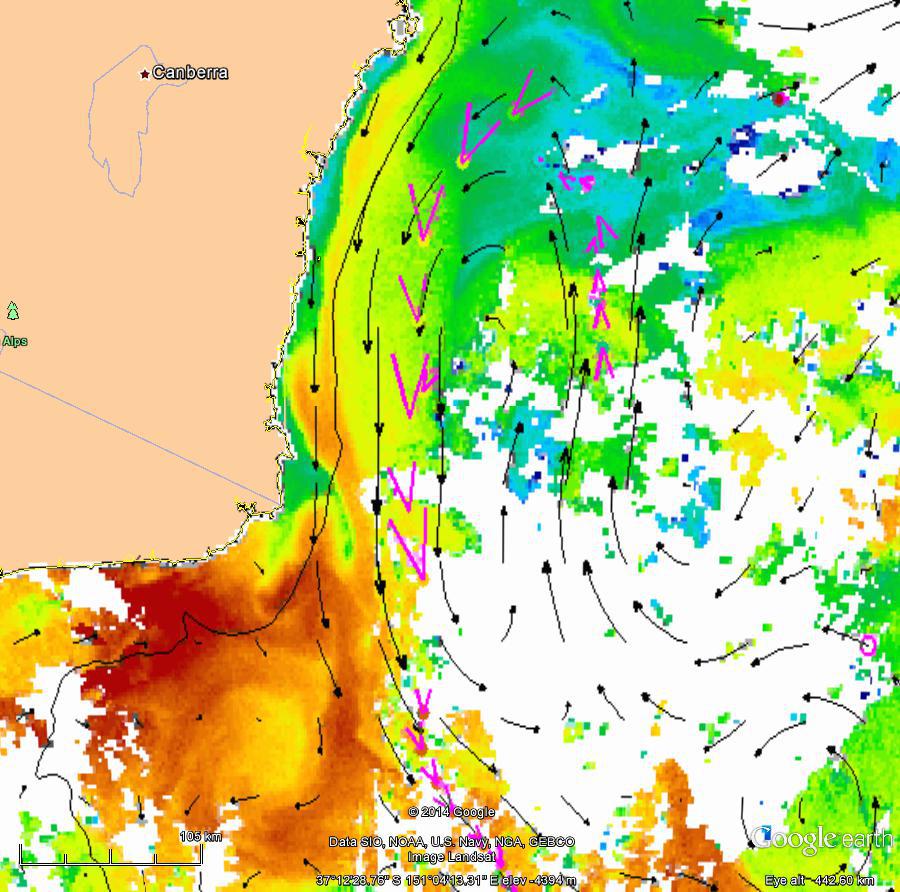
 Update: we have now finished a revision of the gliders page, and activated regular updating of both the Seaglider and Slocum glider plots. Site navigation is also improved. To dive in, start at the Notes page. Positions of the gliders can also be seen relative to ocean current features at the satellite imagery pages. For example, the image for Tasmania on 23 November shows a Slocum glider crossing a cold north-flowing current to reach the edge of warmer East Australian Current waters offshore.
17 October, 2014: Glider page debut We have now finished a first version of a suite of plots of all the IMOS ANFOG Slocum glider and Seaglider data. To dive in, start at the Notes page. Apology: we haven't yet added the tracks to all the historical SST imagery, just the two most recent Seaglider missions (off Perth and in the eastern Great Australian Bight).
 We have now plotted all the Deep Array ADCP data, and re-plotted all the ANMN Shelf and NRS ADCP data. See today's note on our timeseries page for more info.
 After a long outage due to problems at the NCI, the IMOS SRS is now about to resume production of MODIS chlorophyll-a imagery. The processing system has been updated to SeaDAS7.0, which includes the latest calibration, so the chlorophyll estimates are quite different to the SeaDAS6.0 estimates produced earlier. 14 Oct update: problems at the NCI have been continuing, so updating has not been regular at all. Its being worked on, but the immediate problem is the federal shut-down in the US. 13 Nov update: Recovery from the shut-down is still incomplete, as is resolution of infrastructure problems at the NCI.
.
.
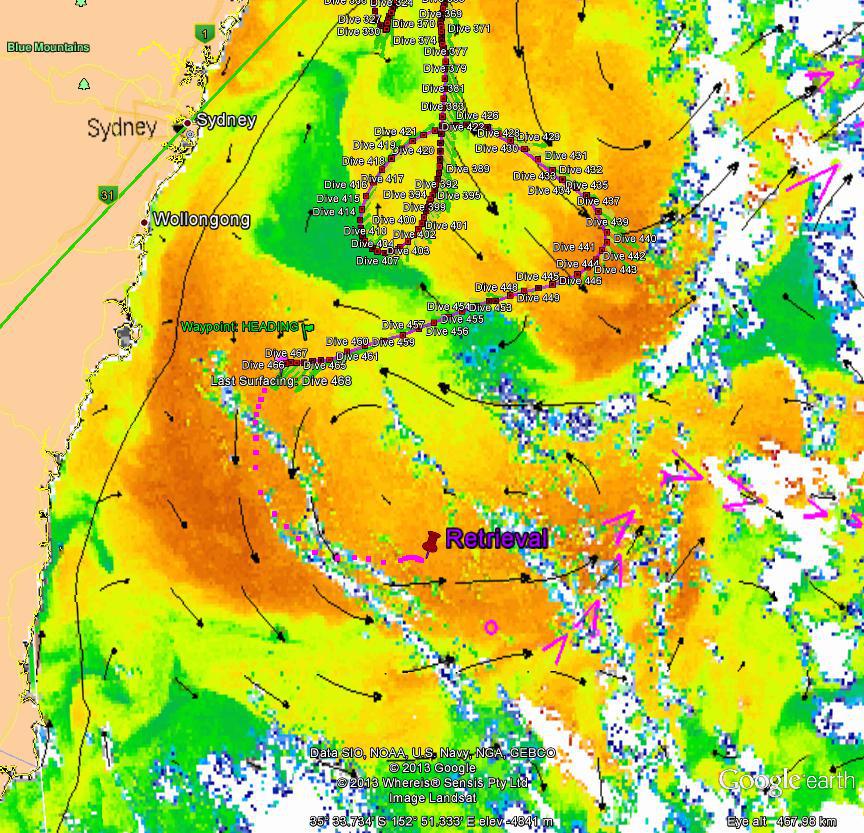 IMOS Seaglider 516 seemed to be on track for an orderly recovery somewhere close to Jervis Bay last week. Its ability to glide across a strong ocean current was being used to the full to get it out of a warm core eddy off southern NSW. Suddenly, however, the battery voltage dropped faster than expected, making glides to depth in a chosen direction impossible. Disabled, the glider drifted at the surface with the current, being pushed back towards the centre of the eddy by strong winds that also made recovery impossible. Faced with the very real possibility that the glider would follow a nearby satellite-tracked surface drifter off into the Tasman, NSW-IMOS elected to charter a fishing vessel and make an overnight trip out to the glider as soon as conditions were suitable. The strategy paid off and the glider was retrieved early in the morning, 130nm from shore as shown at right (click to expand).
MODIS has higher spatial resolution than AVHRR but since there are more AVHRR sensors flying, and thermal emission occurs equally in day and night, we have many more images of the ocean's temperature than its colour, which can't be seen at night. For this reason we presently show, for all the high-resolution regional plots, each image from the satellite separately, with gaps unfilled by earlier data since this is probably quite old. Large-area, time-composite images are being prepared. An initial version that uses the same technique of continuous overwriting that we use for high-res SST is shown for the whole Australasian region (reached by clicking outside the regional rectangles).
May 2013 Update: The following paragraphs now also includes links to the new v6.4 images. The new colour bar starts at 0.03mg/m3 instead of 0.02 to reduce the effect of a calibration difference which is quite obvious if you look through the image pairs below for 2011-2012. The new images also include ANMN data and delayed mode (instead of the near-real time) altimetry maps.
The beautiful image for 28 May 2012 off Perth [v6.4] shows that the warm Leeuwin Current water sometimes has (somewhat paradoxically, considering its tropical origin) higher chlorophyll-a concentration than the colder waters offshore. A few months earlier, however, when the Leeuwin was not yet flowing very strongly, the picture is very different. A good image for 29 Feb 2012 shows the southward-flowing warmer Leeuwin Current water having clearly lower (surface) chlorophyll [v6.4] than the shelf waters which the radar [v6.4] sees recirculating anticyclonically over the Perth Canyon, inshore of the faster flow. Similarly, a little farther north a month earlier, we see high chlorophyll-a [v6.4] on the southern, cooler side of an offshore-directed meander of the Leeuwin Current. The positive divergence of the radar velocity estimates suggest that the high chlorophyll water is being upwelled.
Moving downstream into the Great Australian Bight, a warm-water, high-chlorophyll eddy of Leeuwin Current water can be seen, by stepping backwards from 12 April 2012 [v6.4] through 2 April 2012 [v6.4] to 12 March 2012 [v6.4], to result from meanderings of the Leeuwin Current that eventually became an isolated eddy off the slope. The clear skies at that time also yielded a beautiful image off the Bonney Coast region [v6.4] where the ACORN radar recorded the velocities associated with another high-chlorophyll, warm anticyclonic eddy. Zooming out [v6.4], we see an interesting cyclonic eddy at 40S 136E with a low-chlorophyll centre. We can't leave SA, however, without seeing a beautiful image of a classic summer-time Bonney Coast upwelling event [v6.4] driven by a burst of SE wind driving water alongshore but also away from the coast, drawing cold water up from below, fuelling the food-chain.
On the east coast, in contrast, we almost always see the usual relationship of chlorophyll [v6.4] to temperature and sense of rotation, i.e., low chlorophyll in the warmer tropical-origin (EAC in this case) waters, or its anticyclonic eddies.
The high resolution of MODIS, and the fact that sometimes there are much stronger gradients of colour than temperature gives MODIS the ability to show the ocean in greater detail than AVHRR. This is especially true off the North West Shelf, where a beautiful sequence of chlorophyll images for late May 2012 [v6.4] show rich detail associated with southwestward flow along the shelf break while the SST images for that time show the winter cooling of the coastal waters but not much else.
Another example is the 24 February image for Sydney [v6.4] showing a small patch of 'green' water at about 34.3S, 153.5E where there is intense cyclonic shear between the EAC and an eddy that detached from it some time ago. Looking back through the imagery, it appears that this patch originated at the coastal bloom. The image also shows the sharp front all along the coast between the warm, low-chlorophyll East Australian Current waters (both the eddy and the parent current) and the more productive coastal waters.
Images of the Great Barrier Reef [v6.4] are particularly beautiful but note that the chlorophyll algorithm is not at all accurate where the sea floor can be seen from space. This one appears to show low-chlorophyll waters flooding north-westwards into the Capricorn Channel, in agreement with the HF radar data.
To finish this quick introduction to the images for 2012, we draw your attention to the (initial version, see above) large-area composite image for 20 March 2012 [v6.4] which shows the first appearance of a cyclonically-rotating, high-chlorophyll-a eddy which is clearly the legacy of TC Lua which developed off the NWS on 15 March 2012, pausing at the location where the cyclonic eddy is generated in the ocean. The bloom of high surface chlorophyll can be followed until about 13 April.
Editor's Choice images for 2011