

Summer is often the time when unusual ocean temperatures have the widest range of impacts, from recreational to life-threatening. Tropical Cyclones Marcia and Lam have just left trails of destruction in Queensland and the Northern Territory and, as usual, the question is whether anomalous ocean temperatures contributed to their strength. The answer to this question lies not in analysis of just the ocean's surface temperature (e.g. our maps of 6-day-average anomalies), because a cyclone needs a deep reservoir of heat for growth, not just a shallow one. That said, the Argo measurements of sub-surface temperature, like the satellite images of surface temperature, were close to normal across off NE Australia. The areas of significant temperature anomalies (not all positive) were farther west and/or south. The most conspicuous of these are the positive anomalies off the NW and SE, and some isolated negative anomalies near the coast. The Tasmanian anomaly is mainly due to the East Australian Current bringing warm water southwards. South Australia, on the other hand, has had strong wind-driven upwelling since mid-January. These are both usual occurances, but this year both are strong. Less commonly observed are the relatively cold shelf temperatures seen several times this summer as far north of Perth as Jurien, where coastal upwelling appears to have been happening.
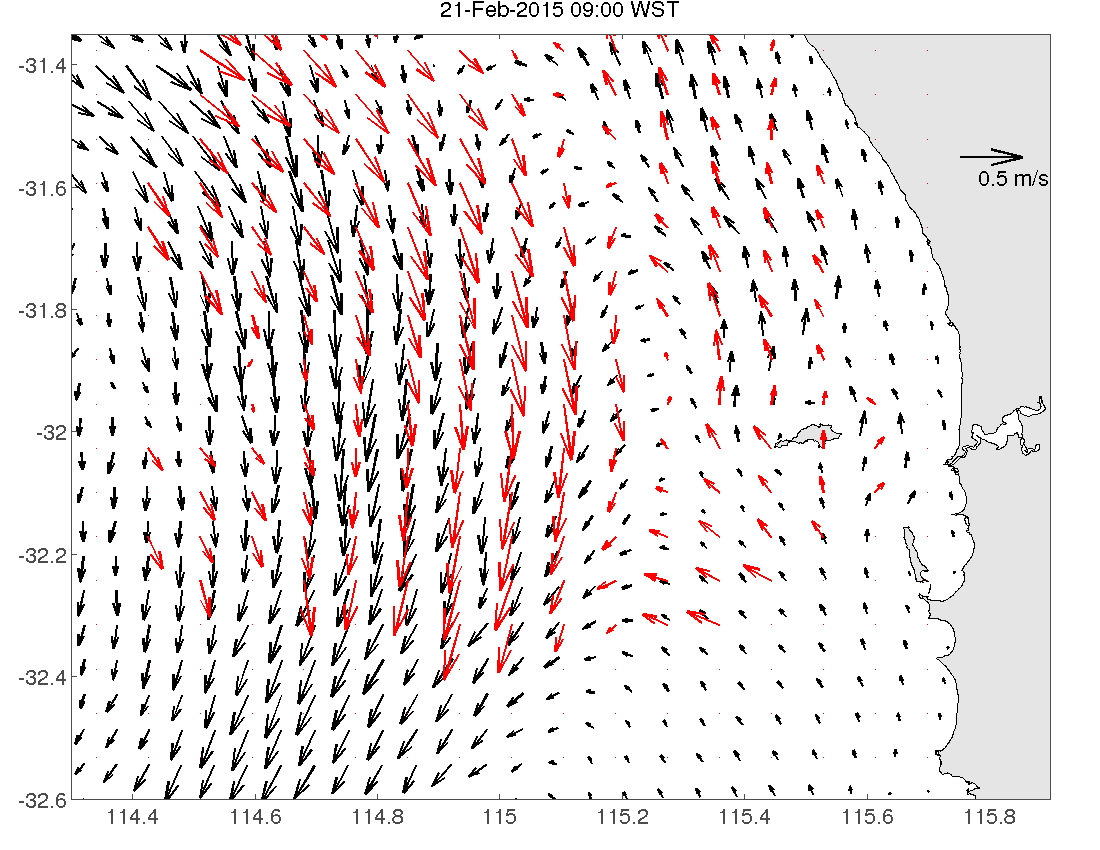
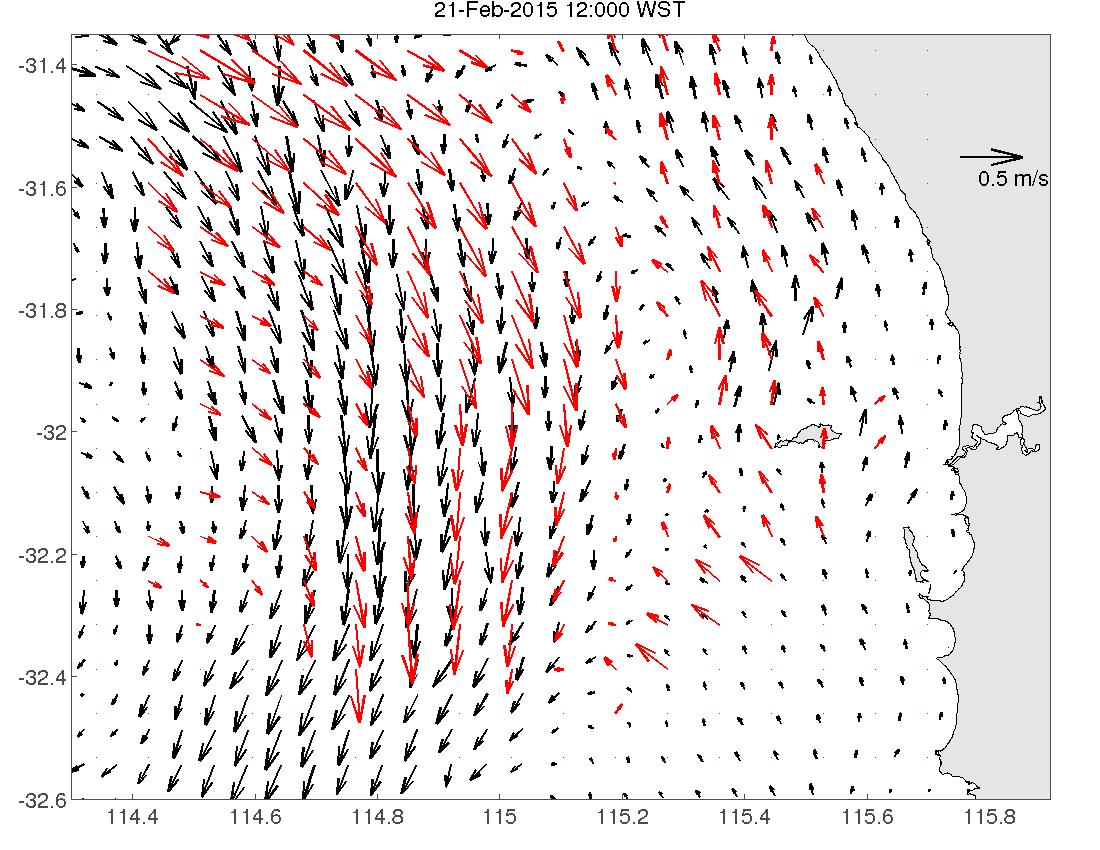
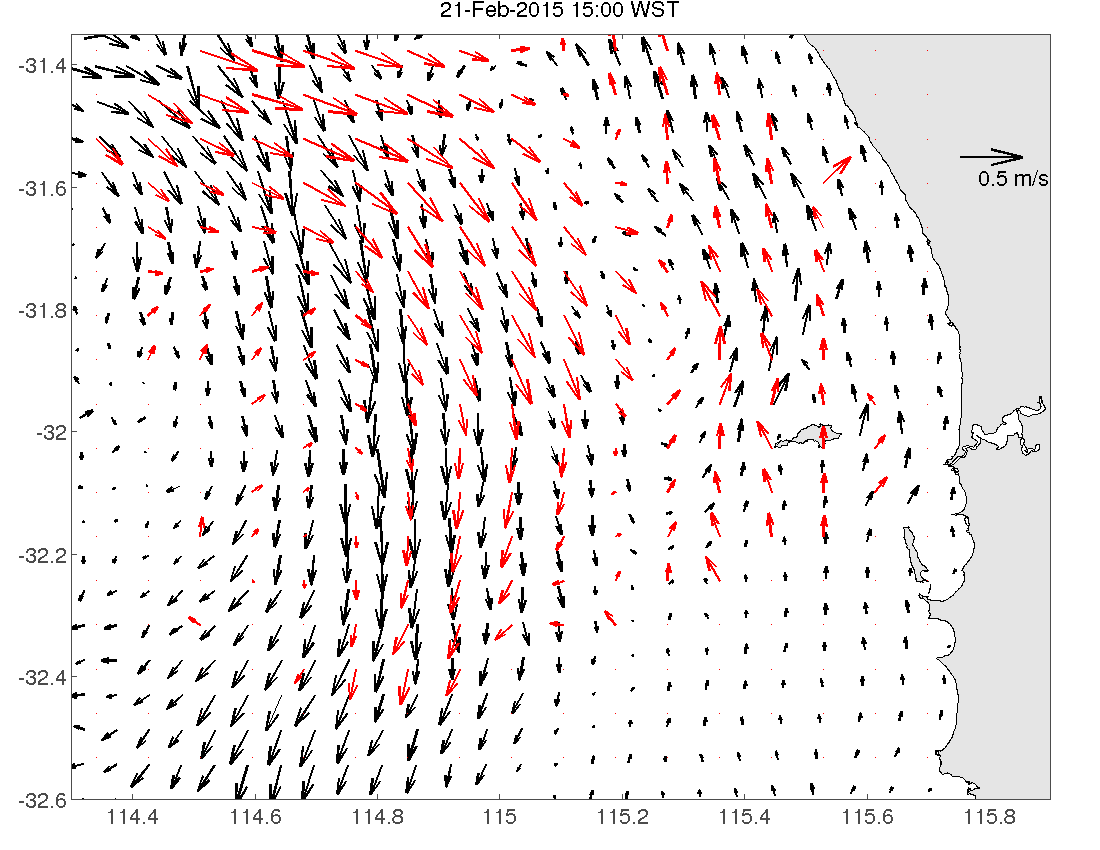
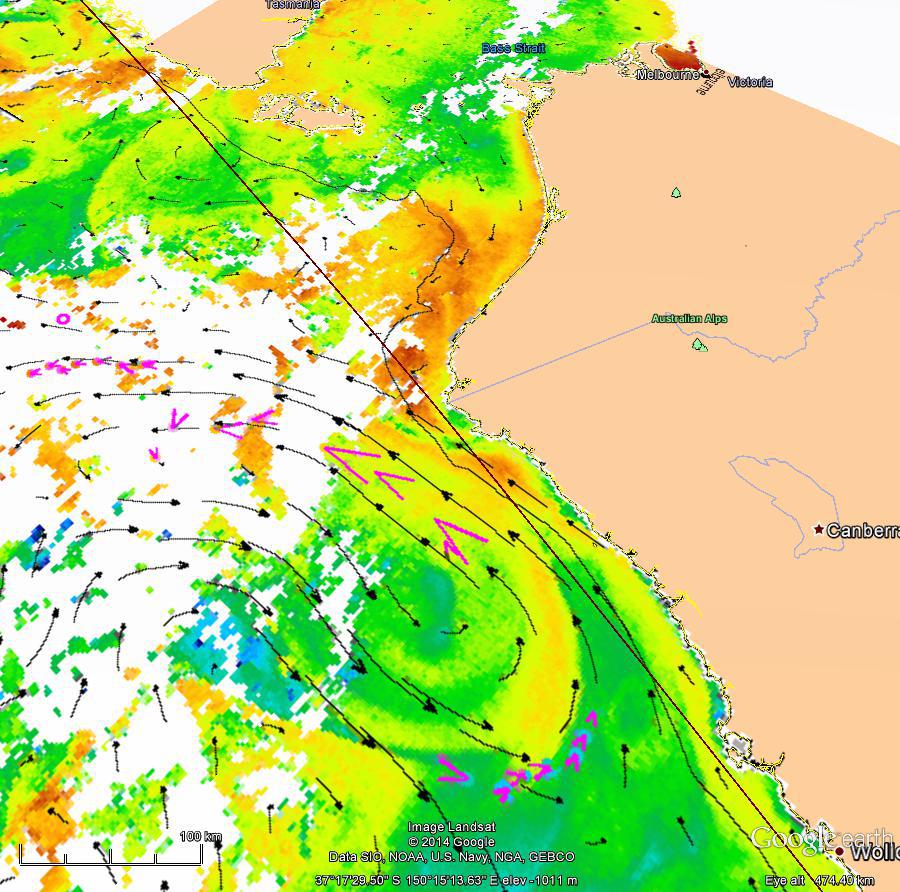
The Oceans Institute of the University of Western Australia have now compared the IMOS HF radar measurements of surface currents (made during the race) with the model forecast issued before the race. These maps below (click to see them enlarged) show the 'bigger picture', showing how the currents in the shallower waters of the continental shelf were going northwards while the currents off the continental shelf were going southwards, as is often the case. The radar does not have such fine spatial detail as the model but does confirm the general pattern, as well as the increasing northward velocities that were forecast. See also the satellite image closest to the time (06:56Z=1456WST) of the race. The radars (northern system in magenta, southern system in red) have detected the northward shelf flow. The altimetry (black vectors) is often blind to these reversals, and is not yet available for the day of the race. The thermal image confirms the usual association of northward winds and flow with upwelling of waters from depth.
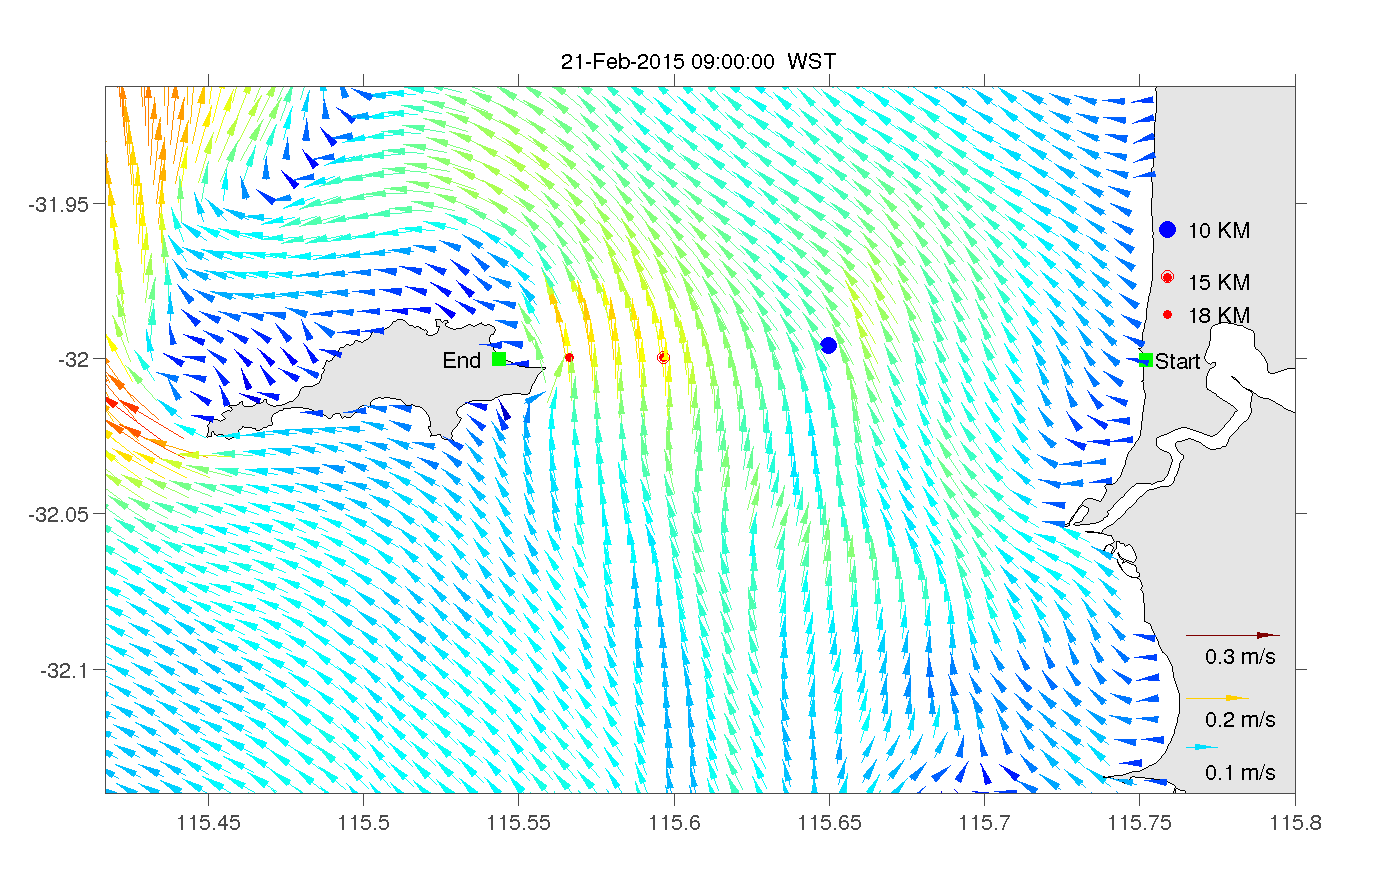
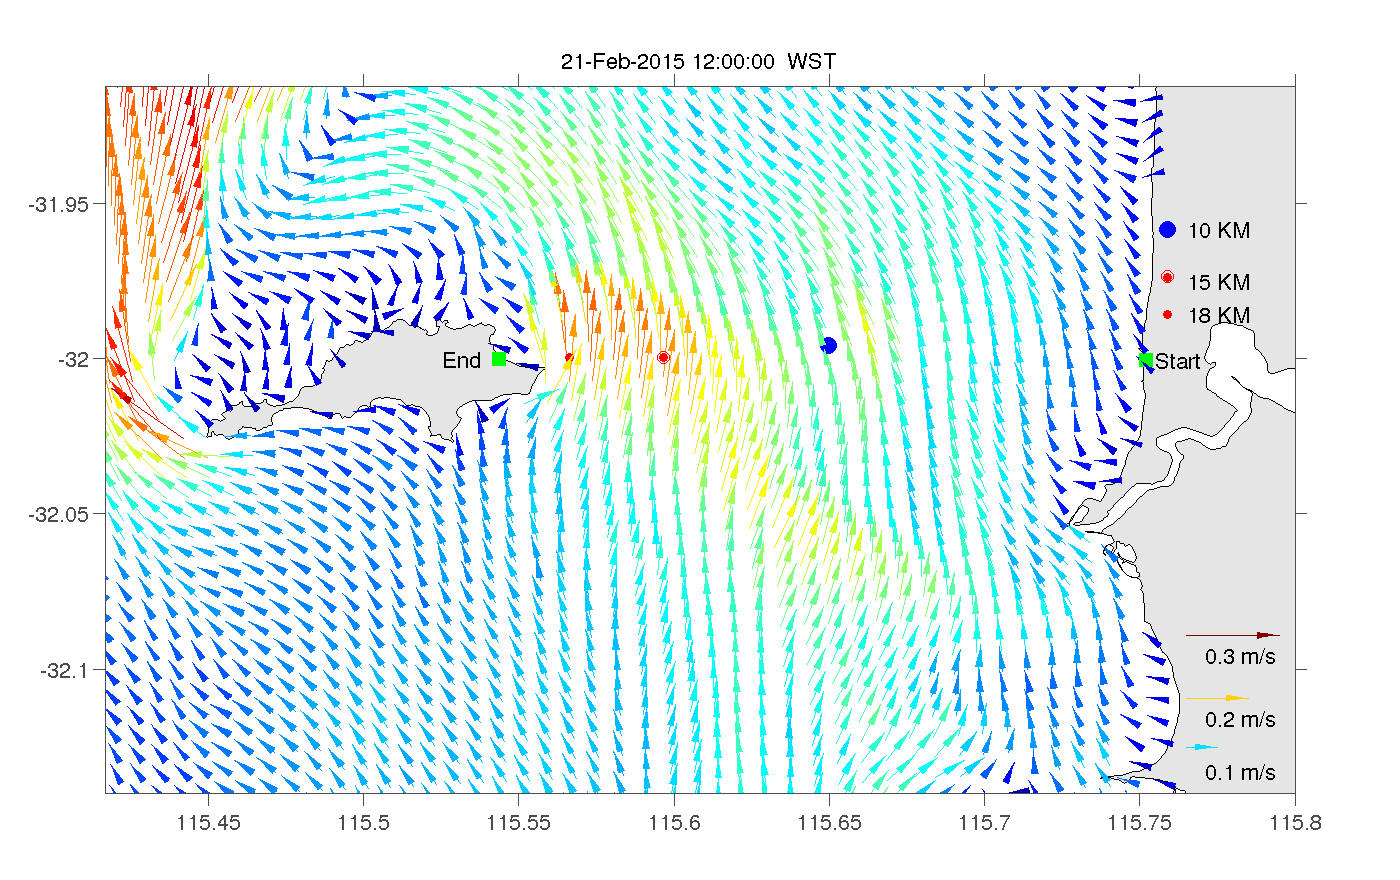
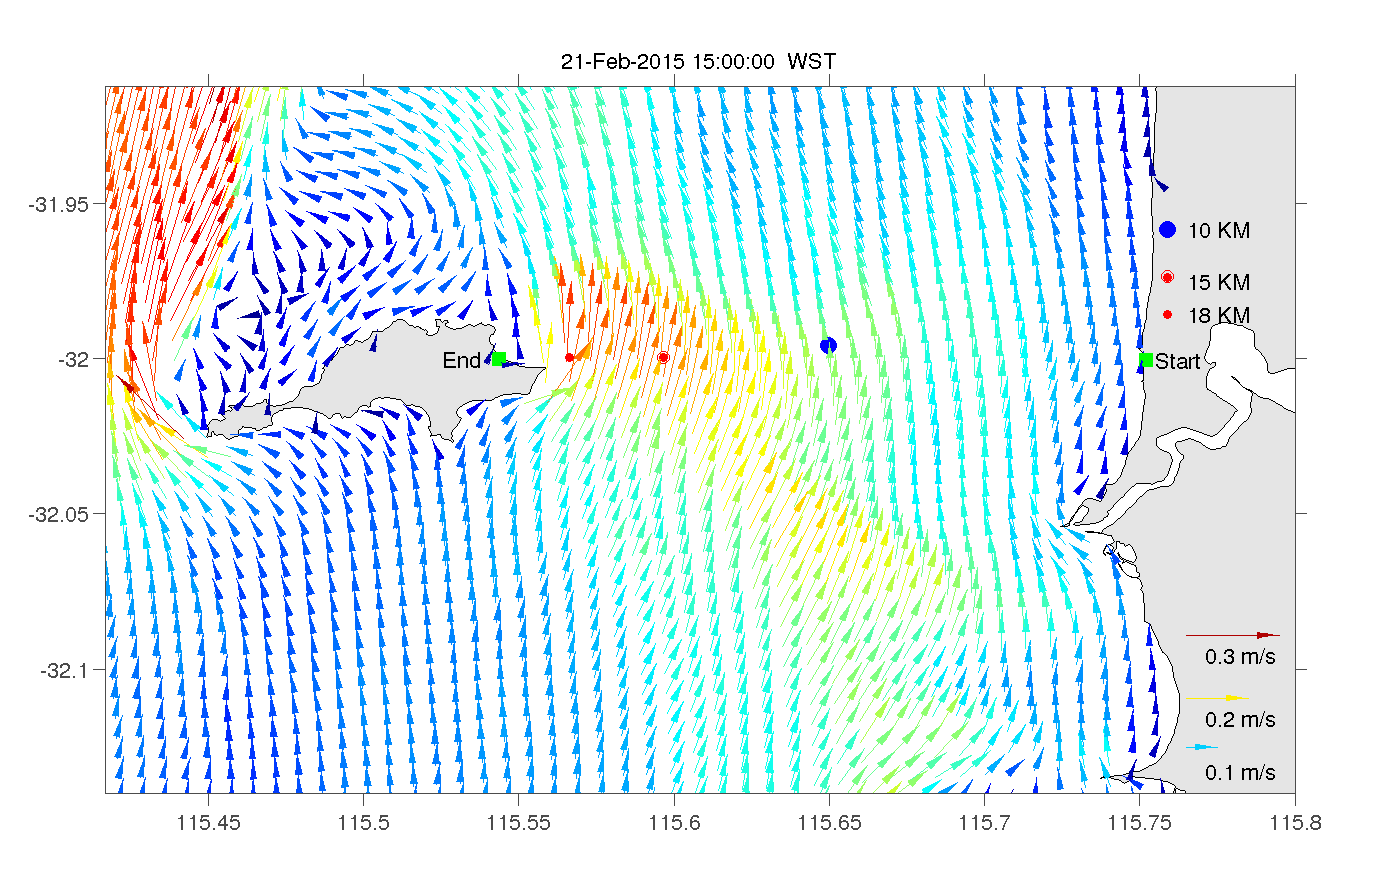
The Bureau of Meteorology is forecasting southerly winds (15-20 km/h) at dawn then turning south to south-westerly and strengthening (20-30 km/h) in the late morning. The Oceans Institute of the University of Western Australia ocean current forecast is for northward currents throughout the race, weak near the coast and strongest (0.25 m/s at midday) after the 15 km mark, as shown in the images below (click to see them enlarged). Northward currents are anticipated to increase from midday due to the sea breeze, making the approach to the island most difficult near the cutoff time.
On Friday 20 February we will show the Oceans Institute of the University of Western Australia ocean current forecast for the following day's race. In the mean time, see our constantly-updated maps of ocean data for the Rottnest Island region and the following introductory material by Prof Chari Pattiaratchi of UWA.
Currents along the Perth Metropolitan coastal area respond to wind patterns. The tides have little influence. During the summer months, the wind pattern between Cottesloe and Rottnest Island is usually dominated by the land/sea breeze system. In the morning, the wind is easterly (i.e. blows from the land to the ocean). During the late morning to early afternoon, the sea breeze changes direction to blow from the south or south-southwest. The sea breeze is usually both much stronger and longer lasting over the ocean than over the land. All of these factors mean that the prevailing currents are usually northward, particularly after several days of sea breezes. This dominant pattern is illustrated above right.
The next most common weather pattern for the region features strong easterly winds. The current at these times flows southwards (below right). This happens when we have several really hot days (i.e. high 30's+) in a row. This is what happened in last year's race .
The current accelerates locally as it flows around Rottnest Island, so currents are stronger along both ends of the island. As the swimmers start off from Cottesloe, the currents will probably be weak and not have much influence. However, as the swimmers get closer to Rottnest Island (about 2-3 km away) they are more likely to experience strong currents. The direction of the currents would depend on the prevailing wind conditions (see above). These currents may be strong (up to 1 knot or 0.5 m/s).
23 Dec: There is very little new information since yesterday, but what there is suggests that the eddy SE of Jervis bay is slipping southwards. A third (since 8 Dec) drifting buoy is passing by Montague Island just outside the 200m isobath, slightly slower than the previous two, suggesting the flow speed has reduced, and/or that farther offshore is where the strongest southward speed is to be encountered. Our imagery will continue to update (unless something goes wrong in our absence). Our Google Earth feed allows you to overlay the CYCA yacht position data on our maps of the ocean currents. The screen-grab at right (a view looking towards Tasmania from Sydney) is what you see if you do this today.
22 Dec: The latest satellite data indicates that the two eddies mentioned in our 20 Dec post have indeed merged, and now form a very elongated eddy whose northern extreme is about 75km off Jervis Bay. Its southern extreme, which is about 400km south, is less distinct because the eddy is partially attached to a third eddy (also anticlockwise-rotating) to the east, centred at about 39S 154E. This is most clearly seen in the larger-scale sea-surface height map for SE Australia. That map also shows the points where we have sea level data. These are quite sparse, and non-existent between the eddy centre and southern NSW. Evidence that our interpolation procedures have correctly estimated the eddy's shape is provided by the tracks of two drifting buoys which first did loops around the unmerged eddies, and are now looping around the merged eddies.
What should yachts do to make the most of the current? That's the navigator's job to decide. One thing is clear: ocean currents change significantly from day to day, so there can be a big difference between the information available pre-race (which can be several days old) and what the yachts experience. For example, last year the map for 18 Dec showed favourable currents along the southern NSW shelf. We now know, however, that by 27 Dec the flow had stopped or even reversed. To see how that happened, view the animations available via the [DATE INDEX] link on those pages.
20 Dec: It's possible that the ocean currents will give yachts more of a boost this year than in any of the last ten years. Indeed, if the current holds steady for the next week, which is possible but certainly not guaranteed, the Sydney-Hobart yachts could benefit from about 2kt of southward flow for about a third of the distance.
We had to look as far back as 2004 to find a year when the currents along the rhumbline appeared to be as favourable. But don't take our word for it. See for yourself how present conditions compare with 2005, 2006, 2007, 2008, 2009, 2010, 2011, 2012 and 2013.
As indicated on the map for today (20 Dec), our most-recent velocity estimates are valid for 15 December, a full 11 days before race day. The situation could become different by 26 Dec, especially considering that the favourable currents showing at present are associated with two anti-clockwise rotating eddies that are very close to each other. These may merge or they could move with respect to each other, possibly leaving a counter-rotating eddy somewhere along the rhumb line. The navigators know this, and will be watching the imagery right up until race time.
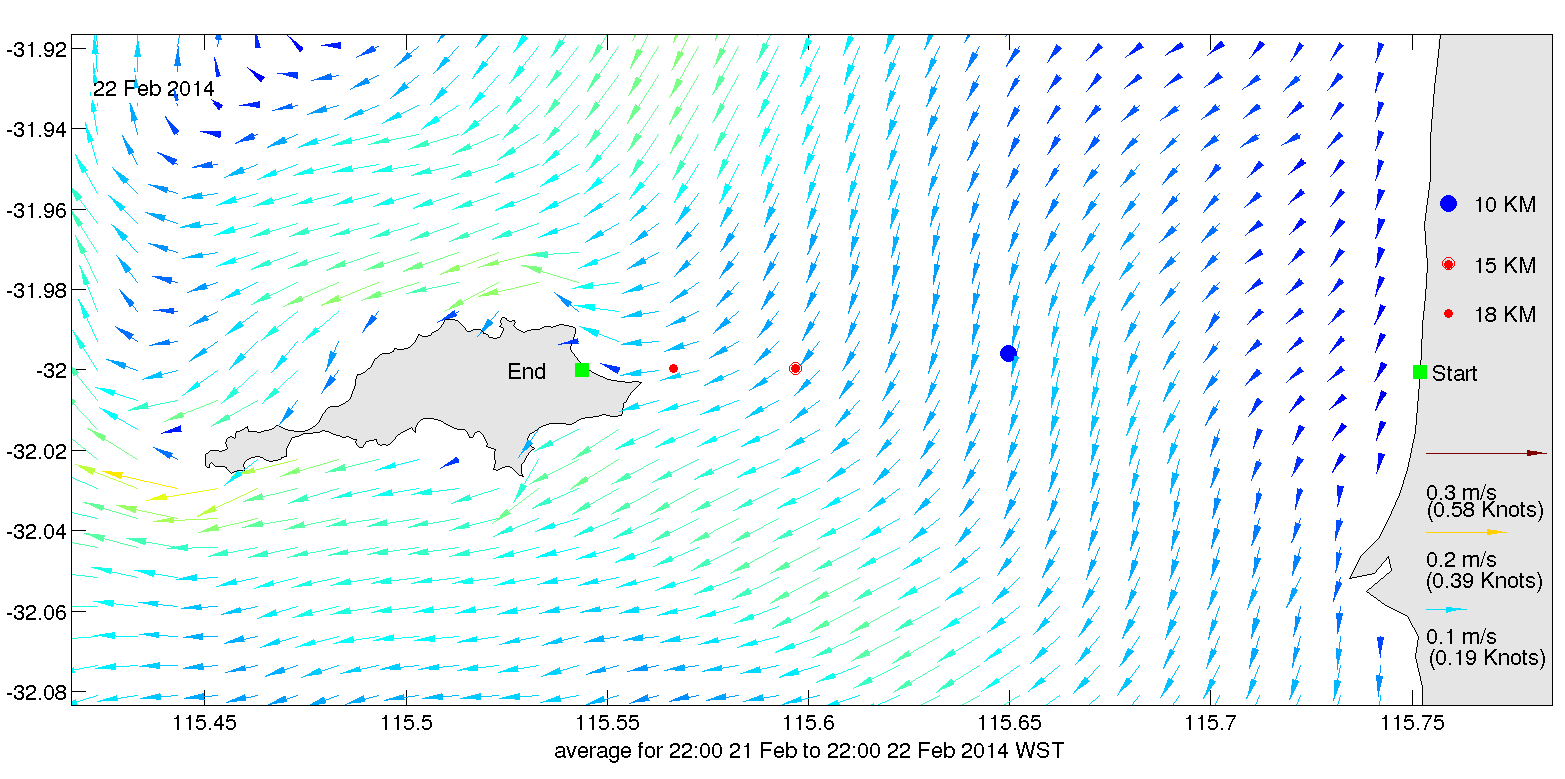
 A dead humpback whale was about to come ashore on Perth's Cottesloe Beach yesterday, in what might have been a repeat of the cause of last week's $170,000 clean-up exercise on Scarborough Beach. Referring to the image at right [zoom in] [zoom in, SST], and taking the forecast winds into account, Prof Pattiaratchi advised authorities that towing the whale 15km offshore of Rottnest Island would result in an even chance that ocean currents would take the carcass away. As far as we know, this is the first time that IMOS infrastructure has been used for an application of this nature. Media coverage: au.news.yahoo.com/thewest/video/watch/25487737/concerns-for-whale-carcass

 The Brisbane region is where the flow along the continental slope is most consistently fast and to the south, because of the East Australian Current, right? Well, yes, but sometimes the flow along the slope does turn northward (e.g. as we discussed with reference to the fate of AHS Centaur). In fact, it has now done this in three June-July periods in succession, the most recent one resulting in some striking SST imagery. The imagery shows that the EAC is not actually reversed - its just displaced offshore.
Data from the IMOS EAC current meter array, which was deployed to measure the transport of this most important of Australia's ocean currents at a critical location, are now available and not surprisingly the data are rich with interesting features. One of these is a month-long anomaly in June-July 2012 that was an example of the EAC not flowing along the continental slope. This event was monitored in real-time by satellite observations of low sea level, low surface temperatures and high chlorophyll, which all show that the flow of the EAC was displaced offshore by a cyclonic eddy. What the current meter data (e.g. from the ADCP at 80m in 2000m) reveal is that on 7 June the flow velocity off Brisbane suddenly dropped from normal values to near-zero, where it stayed until 11 July. During that period of near-zero flow along the 2000m isobath, the flow farther offshore at the other instrument moorings swung from shoreward on 21 June to northward on 2 July (as shown at right) then to seaward on 4 July before turning south on 11 July and accellerating to speeds in excess of 1m/s by 15 July. The satellite data show that this sequence of events can be explained by the movement of the cyclonic eddy that in early June was centered more than 100km NE of the array (at 26.4S 155.4E) but then moved west and subsequently south, passing through the array in early July then continuing along the continental slope.
Cyclonic eddies also appeared inshore of the EAC in October 2012 (e.g. see 25 Oct although on this occasion the eddy was quite small) and in the next two years (e.g. in 2013: 4 June, 25 June and see also the chlorophyll image, and in 2014: 15 July as mentioned above).
These reversals are important for a number of reasons. To mention just two: 1) they are responsible for a large amount of cross-shelf exchange (as can be seen in the chlorophyll images as well as the u-component velocity timeseries) with potentially major consequences for transport of fish larvae and everything else in the water - near Brisbane and farther south, and 2) turbines harvesting energy from the flow would be affected.
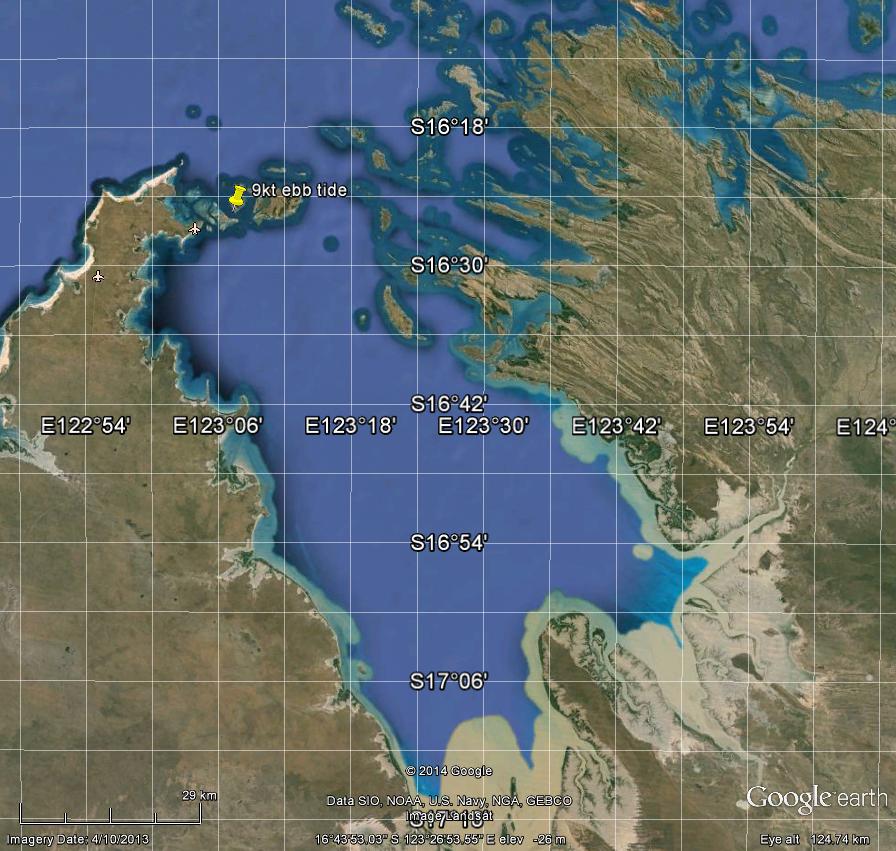 This honour probably goes to one of the passages of the Buccaneer Archipelago. Sunday Strait, for example, is the main shipping route into King Sound and the town of Derby. Hydrographic chart AUS 733 notes that flow speeds of ~10kt (~5m/s) occur there. We are unaware of any instrumental measurements to verify that estimate, but offer this observation: At 1630WST on 29 July 2014 (close to the time of maximum spring ebb tide), it took two 250hp outboards running at 2700rpm to keep the Giant Tides Tour RIB stationary in Escape Pass as dramatic whirlpools swept by. From this, the skipper estimated the flow speed to be 9kt.
 Australia coordinated the search of the sea surface for wreckage of Malaysia Airlines flight MH370 from 18 March to 28 April, 2014. The Drift Working Group assembled by the Australian Maritime Safety Authority used several techniques, throughout the search, to estimate the drift of potential wreckage as part of the optimisation of the conduct of search operations, which involved as many as 12 aircraft and 12 vessels from a number of nations. The focus of efforts shifted north-eastward along the '7th arc' from early March when it was thought the plane could have flown as far south as 45S, to 21S where the flight recorder's pinger signal was thought, in mid-April, to have been detected by Ocean Shield.
 The Australian Transport Safety Bureau's June 26 report "MH370 - Definition of Underwater Search Areas" shows what is presently believed to be the most likely region of the crash. The panel at right shows two estimates of where three types of debris might have been distributed on 18 March when the search off Australia commenced. These simulations use the ATSB estimate of the 8 March crash region, and CSIRO trajectory modelling based on the Bureau of Meteorology winds and ocean current (left panel), and IMOS OceanCurrent surface current (right panel). The red, black and blue dots represent items with three degrees of exposure to the wind, drifting downwind at 2.8%, 1% and 0% of the 10m wind velocity, in addition to the two estimates of the velocity of the water. By 28 March, when the estimated location of the crash site was close to the updated location used here, our 90km x 700km rectangle of tracked particles is dispersed into a region of approximately 300km x 500km. That 'drifted region' was searched until 4 April and again between 15 and 28 April (from 5-14 April the crash site was thought to be farther north, where potential pinger signals were detected). At the end of the search on 28 April, the tracked particles in these two simulations, combined, occupy a 1500km x 1000km expanse of ocean.
Could debris from the aircraft, if still afloat, wash up on the coast of WA? According to our simulations, this is indeed possible, but very unlikely. A few of the 2700 tracked particles are now (29 June) estimated to be at the edge of the continental shelf. Winter westerly winds could conceivably bring those ashore. The vast bulk of the tracked particles, however, are 900-2500km west of Australia.
 For several months now, the surface temperature of the Pacific Ocean between New Caledonia and Australia has been a degree or more cooler than usual, as shown at right (click to enlarge). The satellite temperature image is rich in detail but it is far from being the whole story. Firstly, note how the cool patches are all depicted as rotating clockwise. We infer this rotation from the sea level map which features depressions at those places, consistent with a positive anomaly of the depth-integrated density, which could be caused by lower temperature and/or higher salinity. One hypothesis worth exploring is that reduced rainfall in that region has increased the surface salinity (by failing to balance evaporation). This reduces the near-surface gradient of density, allowing the wind to keep the thickness of the mixed-layer deeper than usual, thereby keeping the temperature lower than usual. This hypothesis may explain the measurements by Argo float 5902084, which sampled a near-surface salinity anomaly of +0.25 in the upper 100m, but it does not explain the measurements by nearby float 5904257 which sampled a more-normal vertical profile. Here, the isotherms and isohalines are shifted down by about 100m, thus reducing the depth-integrated density anomaly and raising the surface elevation, even though the temperature anomaly at the surface is zero or even slightly negative. This downward shift could only have been caused by a local accumulation or convergence of EAC waters, such as might result from the net transport southwards along the shelf being temporarily reduced. The question is why this advective deepening of the surface layer was not accompanied by any increase of surface temperature, but a reduction instead.
 Recent satellite and HF radar observations, and forecasts of wind, waves and ocean currents (at right, click to enlarge) indicate that conditions for the 2014 Rottnest Swim (22 Feb) could contribute to relatively fast times.
Modelled ocean currents from the Oceans Institute of the University of Western Australia indicate that the recent and persistent shift to an easterly air stream over southern West Australia will produce anomalous ocean current conditions:- a weak (<0.2m/s) southward or southwestward flow (becoming weaker or slightly northward towards the end of the race) rather than the usual northward currents that are common at this time of the year.
Wave observations and forecasts indicate the swimmers will have following seas (generated by the local easterly winds).
The strong northward flow last week and more recently brought cooler water (21-22C) to the surface north of Rottnest Island, and this appears today to be coming south and into the race area. The image at right also shows the surface current estimated by the two IMOS HF radar systems near Perth; the northern one in magenta and the southern one in red. These estimates (which are also shown on mapswim) are least accurate at the edges of the coverage (as evidenced by the disagreement where they overlap) and are subject to many sources of interference. The Rottnest channel is at the very edge of the coverage, so the north/south component of the flow is very uncertain.
FFI, or to provide feedback, contact Roger Proctor 0400 153 449 or email.
 Winds associated with the combination of low atmospheric pressure over SE Australia and high pressure west of Tasmania around 4 February 2014 caused an extremely strong upwelling event stretching from the Eyre Peninsula to Portland, so this season can certainly be characterised as one that started early (see below) and included at least one extreme event. The surface velocities associated with the upwelling were measured by both the SA-IMOS HF radars, as shown at right (click to enlarge), confirming expectations from basic theory and numerical modelling that the flow is essentially alongshore in the upwelling region, with just a small component directed offshore to drive the upwelling. The dynamics is very different, and more complex, outside the continental shelf in the deep ocean, where eddies exist and the wind-driven current is not constrained to follow the coast.
 This year's fleet will negotiate three significant ocean eddies. The first, seen at right south-east of Jervis Bay on 20 Dec (click to enlarge), is unfavourable, but may dissipate or move farther offshore between now and Boxing Day. Skippers will want to keep inshore of this, other factors being equal. The 2nd is more important. Well-exploited all the way from 36S to about 39S, it could give yachts a significant advantage (1-4h) over those that do not find this river of southward flowing tropical water. Finally, an isolated warm-core eddy is off Tasmania's Freycinet Peninsula (42S), potentially giving a small boost to yachts keeping a bit farther east than others.
 The first upwelling of the 2013-14 season occurred from 11-17 November due to strong south-east winds for several days. This was a strong event, especially for so early in the season, with the NOAA satellites seeing upwelled water at 12-13° C, the HF radar seeing surface flows of 0.3m/s to the NW and tidegauges seeing coastal sea level depressed by 0.2m. This occurence of an early, strong upwelling in November is in contrast to the lack of strong upwelling until March during the previous summer. The event is quite well simulated by the Bluelink relocatable model animation of hourly surface t and v which shows excellent agreement with the HF radar data, and an upwelled plume of 15° C water.

 By chance, the southard flows of both the Leeuwin Current (LC) and the East Australian Current (EAC) are presently being strongly impeded by eddies near the continental slope. On the west coast, the opposing force is from an anticyclonic (anti-clockwise rotating, warm-core, high sea level) eddy that is diverting the LC offshore, while on the east coast it is a cyclonic (clockwise, cold-core, low sea level) eddy that is achieving a similar effect. In both cases, some of the flow continues southward after completing a detour around the eddy but it is clear that there are impacts downstream (incuding the end of the warm spell off NSW discussed last month) when these diversions occur, as well as local impacts inshore of the eddies where there is suddenly much less tropical water. Both eddies have been sampled near their centres by Argo profilers. The 70m downward displacement (compared with climatology) in the Ningaloo eddy is in good agreement with our satellite-based projection, as is the 100m upward displacement in the Brisbane eddy.
 Surface waters over the NSW continental shelf and nearby in the Tasman Sea have been much warmer than usual since early August. Shelf waters off the Sydney-Woolongong shelf are presently 22°C or more in places as shown at right, about 4°C warmer than usual. A few Argo floats have sampled these anomalous conditions at key locations, confirming the satellite estimates and showing that the warm anomaly extends down to 600m at places. As is usually the case, however, the warmth of the regions directly affected by the East Australian Current is contrasted by a nearby cold anomaly that exceeds 3° between depths of 300 and 500m in the centre of a cyclonic eddy farther offshore. The cold anomaly is not great at the surface, so its location is less obvious in the thermal imagery. It showed up more in the altimeter data, as a sea level depression exceeding 0.6m in August.
Southern GBR, April 2012: The strongest non-tidal current measured east of Heron Island occurred on 13 April 2012. This was associated with the high sea level event discussed earlier, adding to the list of locations impacted by that wave.
 Coff's Harbour, Feb 2013: Very strong upwelling and northward flow on the continental shelf near Coff's occured around 2 Feb 2013, as a small, intense cyclonic feature grew and then 'rolled' south down the coast. Two weeks earlier, the East Australian current was flowing as a nearly-laminar jet along the continental slope and shelf between Fraser Island (25S) and Newcastle (33S), where it started flowing around a large warm-core eddy forming off Sydney. Cooler nearshore surface temperatures indicate that coastal upwelling was occurring from Stradbroke Island (27.5S) southwards, e.g. near Coffs, but especially south of Port Macquarie (31.5S). On 29 Jan it is clear from the (patchy) imagery that the upwelling had greatly increased following strong upwelling-favourable winds associated with a high pressure system centered on New Zealand and a low over Queensland from 24-28 Jan. The CH070 and CH100 ADCPs recorded the low bottom temperatures (17C) on and prior to 29 Jan, offshore-directed surface-layer flow to the SE on 28 Jan(i.e.left of the wind as expected), then a strong reversal of the flow to the north on 2 Feb which the HF radar shows to be associated with a small cyclonic feature centered over the 1000m isobath. This little eddy remains within the coverage of the radar until about 5 Feb when it gets swept south. the physics of the eddy's formation is a fascinating combination of 1) geostrophic uplift of the isopycnals associated with the (essentially laminar) EAC, 2) ageostrophic uplift to balance the wind-driven surface Ekman transport, and 3) transfer of kinetic energy and cyclonic vorticity from the laminar flow to an isolated feature. This is a mechanism of first-order importance to across-shelf transport, so it is important that we obtain a more detailed understanding of it for many reasons.
 Southern shelf, May 2011, 2012 and Sept 2012: Current speeds in excess of 1m/s were recorded by the southern array of ADCPs on 21 May 2011 [map view] and 5 Sept 2012 [map view] at the SAM5 mooring in 95m off the Eyre Peninsula and on 10 May 2012 [map view] at the SAM3 and SAM7 moorings in 165m and 350m off Kangaroo Island. The ADCP data agree fairly well with the HF radar and geostrophic estimates. On all 3 occasions, the strong along-shelf flow and very high (isostatically adjusted) coastal sea level were driven by strong westerly winds in the Great Australian Bight in the previous days. The winds resulted from low pressure systems on 21 May 2011, 4 Sept 2012, and 8 May 2012 but these systems were clearly of very different nature, and the details of the history of the wind-stress field is possibly what explains the fact that the May 2011 and Sept 2012 systems drove strongest currents at the midshelf (SAM5) mooring, while the May 2012 system drove strongest currents at the outer shelf (SAM3) mooring. Aside: the SAM3 (near-bottom) temperature record reaches an annual peak shortly after the strong current event, because the South Australian Current is an extension of the Leeuwin Current, with relatively warm waters downwelling to depth along the shelf break during winter. The temperature maximum at 350m at the SAM7 mooring in 2012 is not until Sept (after the flow of the SAC has peaked) at which time SST images show a sharp front along the shelf break.
 A warm-core eddy shed recently [April-June animation AVI format, use Internet Explorer] from the East Australian Current is making life difficult for lobster fisher Steve Drake of Kiama (34.7S) because his marker buoys are being dragged under by strong flow along the shelf break near the 200m isobath [16 June map]. Mr Drake said the strong southward flow has persisted since 8 May. The image for 16 May 2013 (at right) shows the flow off Sydney-Jervis Bay in mid-May to be part of the East Australian Current going around an anticyclonic meander in the manner typical of incipient eddy-shedding. The new eddy became completely detached from the EAC around 31 May when the cyclonic eddy discussed here earlier came close to the shelf break off Newcastle (33.5S). The new warm-core eddy is likely to persist for months off the southern NSW coast, possibly reaching Tasmania in some form in summer. The presence of a warm eddy off NSW does not always result in warm coastal water temperatures, because the strong southward flow can cause coastal upwelling (due to two processes; the bottom Ekman layer and thermal wind). But if the eddy, for whatever reason, comes very close to the coast there will be no cold water to upwell. This appears to have been the case off Sydney from mid-May to now, to the delight of beach-goers. IMOS ANMN mooring data will confirm or refute this hypothesis, when available.
Mr Drake's problems did not start in early May. From the 12th to 27th of April, his buoys were dragged under by strong northward flow. This is the first time he has seen this persist for more than a few days. The image for 23 April shows that the northward flow was associated with the southern cyclonic eddy also mentioned here earlier. That cold-core eddy was sampled by IMOS glider mission sg516 [SST image for 9 May with glider track from Sydney 23 March to Narooma 28 May] so analysis of those data will be valuable for understanding the dynamics and consequences of this extraordinary event.
 The 22 June 2012 Technical News item listed some of the best MODIS Chlorophyll-a images for the initial 2011-2012 batch of MODIS imagery, and compared these with the recent re-processing using SeaDAS6.4. Here, we list some of the clearest or interesting images of the Leeuwin Current in south-west WA, for 2002-2011. The peculiar seasonality of the Leeuwin current and the associated cycle of surface chlorophyll, appearing where you might least expect it, is clear:
 There is presently a satellite-tracked drifter apparently trapped in a cold-core eddy off NSW. On 2 May 2013 it was at 33S 155.5E, doing ~30km-diameter clockwise loops in a 120km-diameter cyclonic eddy. The 'parent' cold-core eddy of the present, smaller eddy has existed for a long time but between 13 March and 16 March it became elongated to the NNW. The drifter did its first cyclonic loop at the northern limit of this feature (32S 155E) on 20 March, then proceeded to do many more as the eddy meandered about (the images around 24 April are the clearest). The MODIS image for 10 April shows that the eddy had low (near-surface) chlorophyll-a, in contrast to the other cyclonic eddy positioned a similar distance offshore, off Jervis Bay at 35S. Stepping back through time reveals that the difference between the eddies' chlorophyll concentations is explained by their different origins; the southern one having been formed over the continental shelf near Sydney-NewCastle around 13 March. The tendency of drifters to remain in eddies has been noted before but we cannot recall an instance of a drifter doing so many loops in a cyclonic eddy in this region before. Does it matter? Yes, because it tells us something about the exchange of water between the eddy and its surroundings. It also suggests there may be some convergence at the surface and therefore downwelling at the centre of the eddy, and also that the eddy is certainly not a wavelike feature, with a sea level anomaly essentially un-coupled from any particular mass of water.
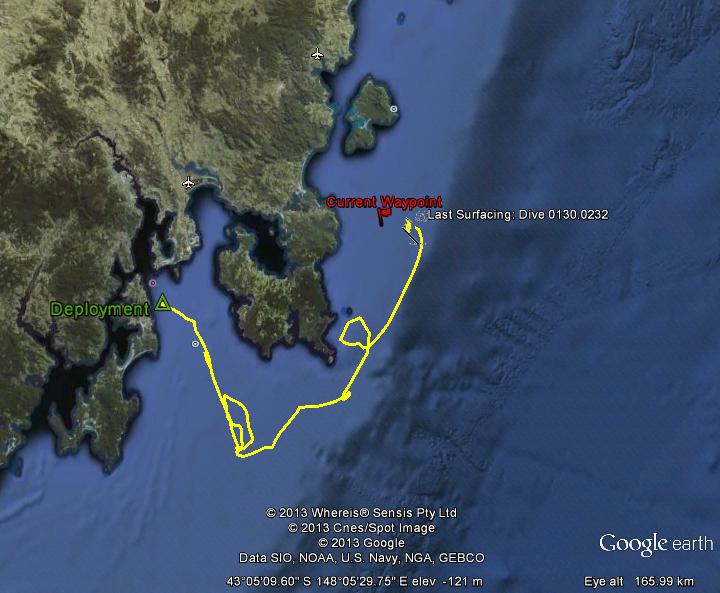 An IMOS Slocum glider sampling the Storm Bay line out from Hobart encountered extremely strong currents towards the NE recently, sweeping it up the Tasmanian coast towards Maria Island as shown at right. The glider's track also included a few unplanned loops. One of these was east of the southern tip of the Tasman Peninsula, over the mid-shelf between Tasman Island and the Hippolyte Rocks. A CSIRO experimental near-real-time model simulation has an anti-cyclonic eddy, at about the same location as the glider's loop, that appears to be a topographic lee eddy resulting from the strong (nearly 1m/s) alongshelf flow streaming past the SE tip of the Tasman Peninsula. [more about the model, and real-time output] [animation won't play?]
Tide gauges at Broome, Port Hedland and Cape Lambert have also recorded the impact on sea level but this does not appear to have been large, relative to the large tidal range of the Pilbara coast. The elevated sea level, however, is expected to travel southwards along the Australian continental margin as a Coastal Trapped Wave, raising sea level by about 0.4m above the tidal prediction at 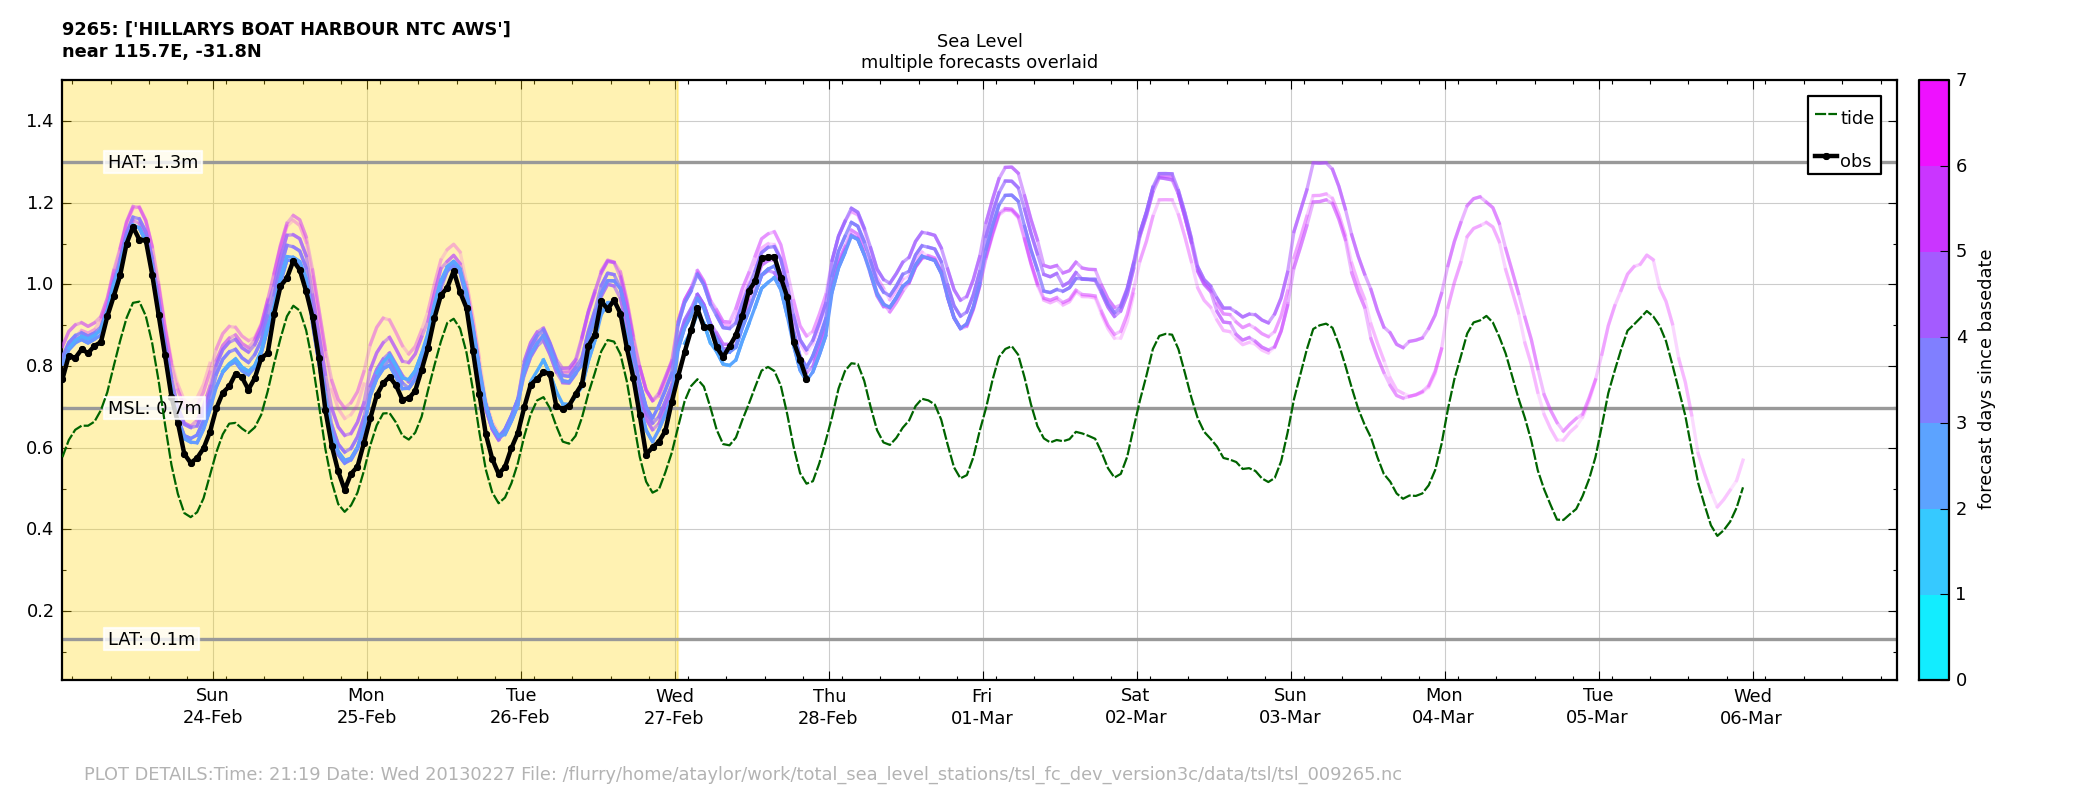 Perth on 1-3 March , according to the Bureau of Meteorology ocean model forecast, as shown at right.
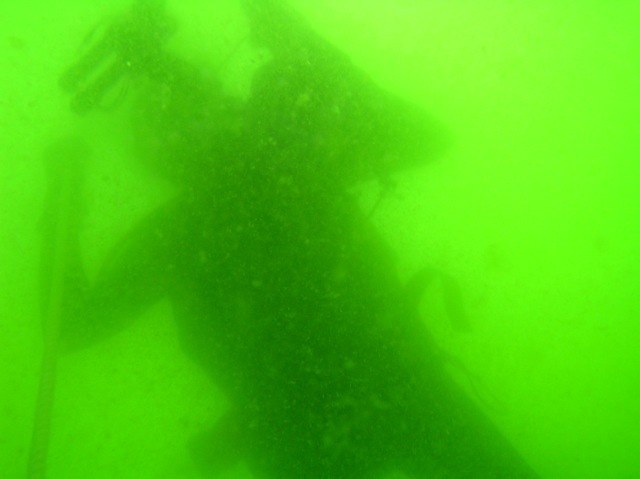 The far eastern coast of Victoria has one of Australia's upwelling 'hotspots'. An example of intense localised upwelling occurred in the last few weeks, starting on
13 Feb. The signal is clear off Marlo (longitude 148.5°E) by 15 Feb. According to satellite imagery, SST reached a minimum of 16°C on 17 Feb and the cold plume extended 80 km to the south west. Observers at nearby Beware Reef measured surface temperatures as low as 15°C. The cold upwelling triggered a phytoplankton bloom that was clearly evident in a MODIS chl-a image for 21 Feb and even more evident to the Beware Reef diver pictured, who noted only a few m visual range down to 20m where it was quite dark, and only 12°C. The upwelling event appears to be due to the combined effect of 1) the local wind which was upwelling-favourable from 10 Feb, and 2) dynamic uplift from the along-shelf flows associated with a warm-core EAC eddy. The event has been simulated quite well in near-real time using the Bluelink-developed nested-model system but the dynamics have not yet been fully explored. [model estimates of SST and currents] Photo credit: Friends of Beware Reef.
The far eastern coast of Victoria has one of Australia's upwelling 'hotspots'. An example of intense localised upwelling occurred in the last few weeks, starting on
13 Feb. The signal is clear off Marlo (longitude 148.5°E) by 15 Feb. According to satellite imagery, SST reached a minimum of 16°C on 17 Feb and the cold plume extended 80 km to the south west. Observers at nearby Beware Reef measured surface temperatures as low as 15°C. The cold upwelling triggered a phytoplankton bloom that was clearly evident in a MODIS chl-a image for 21 Feb and even more evident to the Beware Reef diver pictured, who noted only a few m visual range down to 20m where it was quite dark, and only 12°C. The upwelling event appears to be due to the combined effect of 1) the local wind which was upwelling-favourable from 10 Feb, and 2) dynamic uplift from the along-shelf flows associated with a warm-core EAC eddy. The event has been simulated quite well in near-real time using the Bluelink-developed nested-model system but the dynamics have not yet been fully explored. [model estimates of SST and currents] Photo credit: Friends of Beware Reef.
Now, the state of the East Australian current and its eddies: The 'speed hump' in Bass Strait that presented navigators with a difficult decision last year is not there this year. Instead, the rhumbline appears to be fairly free of any strong currents as far as we can tell from the latest satellite information. To the east of the rhumbline there is some favourable current clearly evident in the latest images so the warm, anticlockwise-rotating eddy is a feature worth watching in the next few days. There appears to have been a northward flow on the continental shelf of north-east Tasmania (as evidenced by the plume of cold water streaming north from Eddystone Pt) in the last few days but this feature is unlikely to persist until race day. The situation between Sydney and Cape Howe is very complex this year. There are two small cyclonic (clockwise rotating) eddies off the continental shelf, so the flow is adverse in places seaward of the 200m isobath. Over the shelf, however, there was evidently a favourable flow of about 1kt on 15 Dec, as can be seen from the southward drift of a satellite-tracked buoy. The thermal imagery for 19 Dec suggests there was a narrow warm stream flowing south past Jervis Bay over the outer continental shelf. It is unclear from the altimetry what the speed of the flow was. Navigators should watch the imagery for any evidence of this flow persisting til race time, which is quite possible but certainly not guaranteed. As usual, we wish all competitors an exciting but safe race and apologize in advance if the imagery on our website stops updating at any point due to a computer failure while our IT staff enjoy their holidays.
 [8 Aug 2012], now you don't:
  [14 Aug 2012]. What made the thin streak of warm EAC water south of Coffs Harbour suddenly disappear? Two things happened between 8 and 14 Aug, as shown in the larger-scale map for 11 Aug 2012. One is that the cold core eddy at 30S 155E, over the continental slope off Coffs Harbour, was restricting the southward flow of the East Australian Current at that point, so most of the flow went offshore around a big warm core eddy centered off Byron Bay. The consequence of this is that the thin streak of warm water south of Coffs was probably quite shallow. The other thing happening was that an atmospheric low pressure system was off NSW, centered at 34S 159E on 11 Aug. Strong southerly winds drive coastal currents northward and raise coastal sea level, as shown in the tidegauge data, but that would not change the surface temperature away from the coast. The cold southerlies cool the warm surface layer by extracting heat, but possibly more importantly, also by increasing the surface turbulence, mixing warm shallow layers with the water beneath. In summary, we think that the winds being so strong, and the flow volume so reduced, are what made the surface exression of the EAC off NSW disappear so fast. 22 August update: a fresh nose of warm surface waters can now be seen flowing south again between Coffs and the eddy offshore. April 2013 update: The CH070 and CH100 ADCPs certainly recorded the northward current pulse but no temperature rise at the bottom due to vertical mixing is evident.
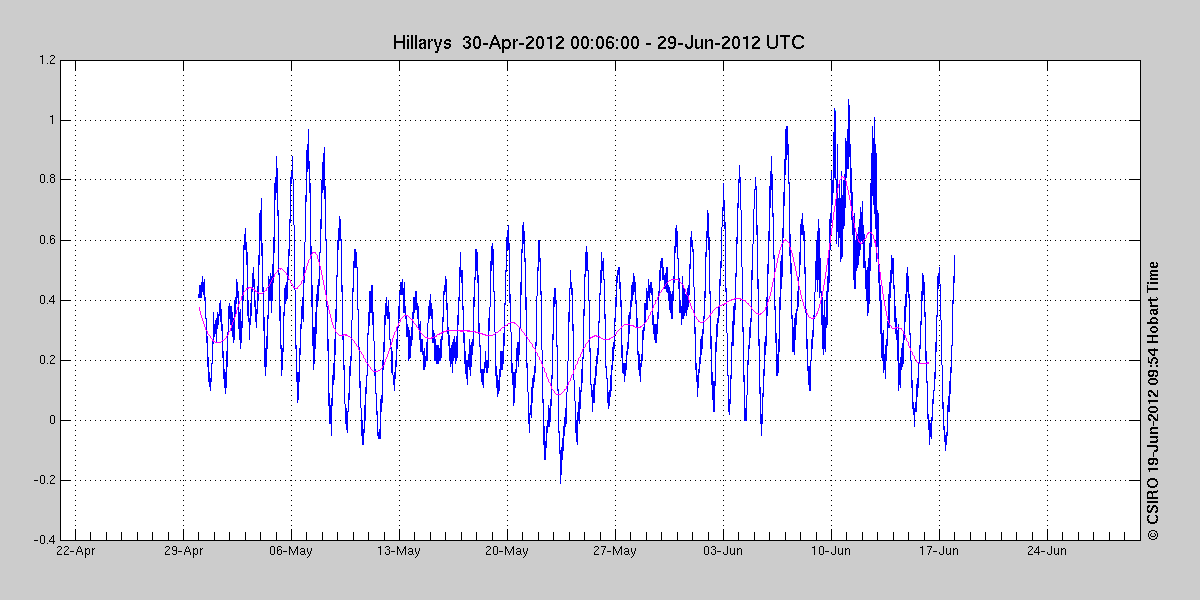
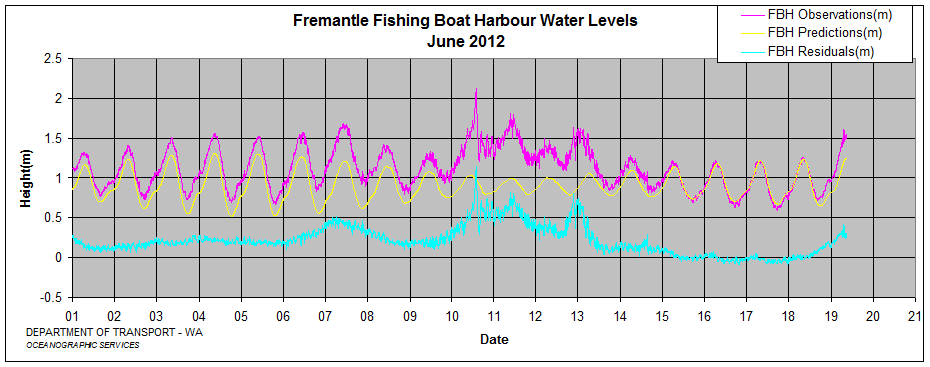 On 10, 11 and 13 June 2012, the Bureau of Meteorology National Tidal Facility tide gauge at Hillarys, Perth, recorded non-tidal sea level anomalies of up to 0.8m above mean sea level. The WA Department of Transport tide gauge at Fremantle Boat Harbour recorded a similar surge but also a ~3h-period oscillation that contributed to the highest sea level ever recorded at Fremantle: 1.35m above mean sea level. Fortunately, these surges came at neap tide (click images to expand - Hillarys data courtesy of BoM, Fremantle data and image courtesy of WA DoT). The total sea level might have been an additional 0.3m otherwise (e.g., if it had occurred during the high spring tide a few days earlier). Low atmospheric pressure was a contributor to the high sea level but strong onshore (westerly) winds associated with the low pressure systems passing south of the mainland was the main cause. A consequence of these strong winds being onshore rather than alongshore is that they would not (in contrast to the geostrophic sea level-based estimates shown on our map) have generated particularly strong along-shore currents. This will be confirmed when the radar data processing resumes. Along the southern coast of Australia, where the winds blew along the shelf rather than across it, they generated a 0.75m non-tidal sea level anomaly on 14 June 2012 at Thevenard, where such events are more common. The surge has now passed through Portland, Vic (non-tidal anomaly 0.3m) and will possibly also be measurable soon east of Bass Strait.
![[SST image for 9 May with glider track from Sydney 23 March to Narooma 28 May]](misc/Dory4_2013050903.jpg)