Research
Key greenhouse and ozone depleting gases
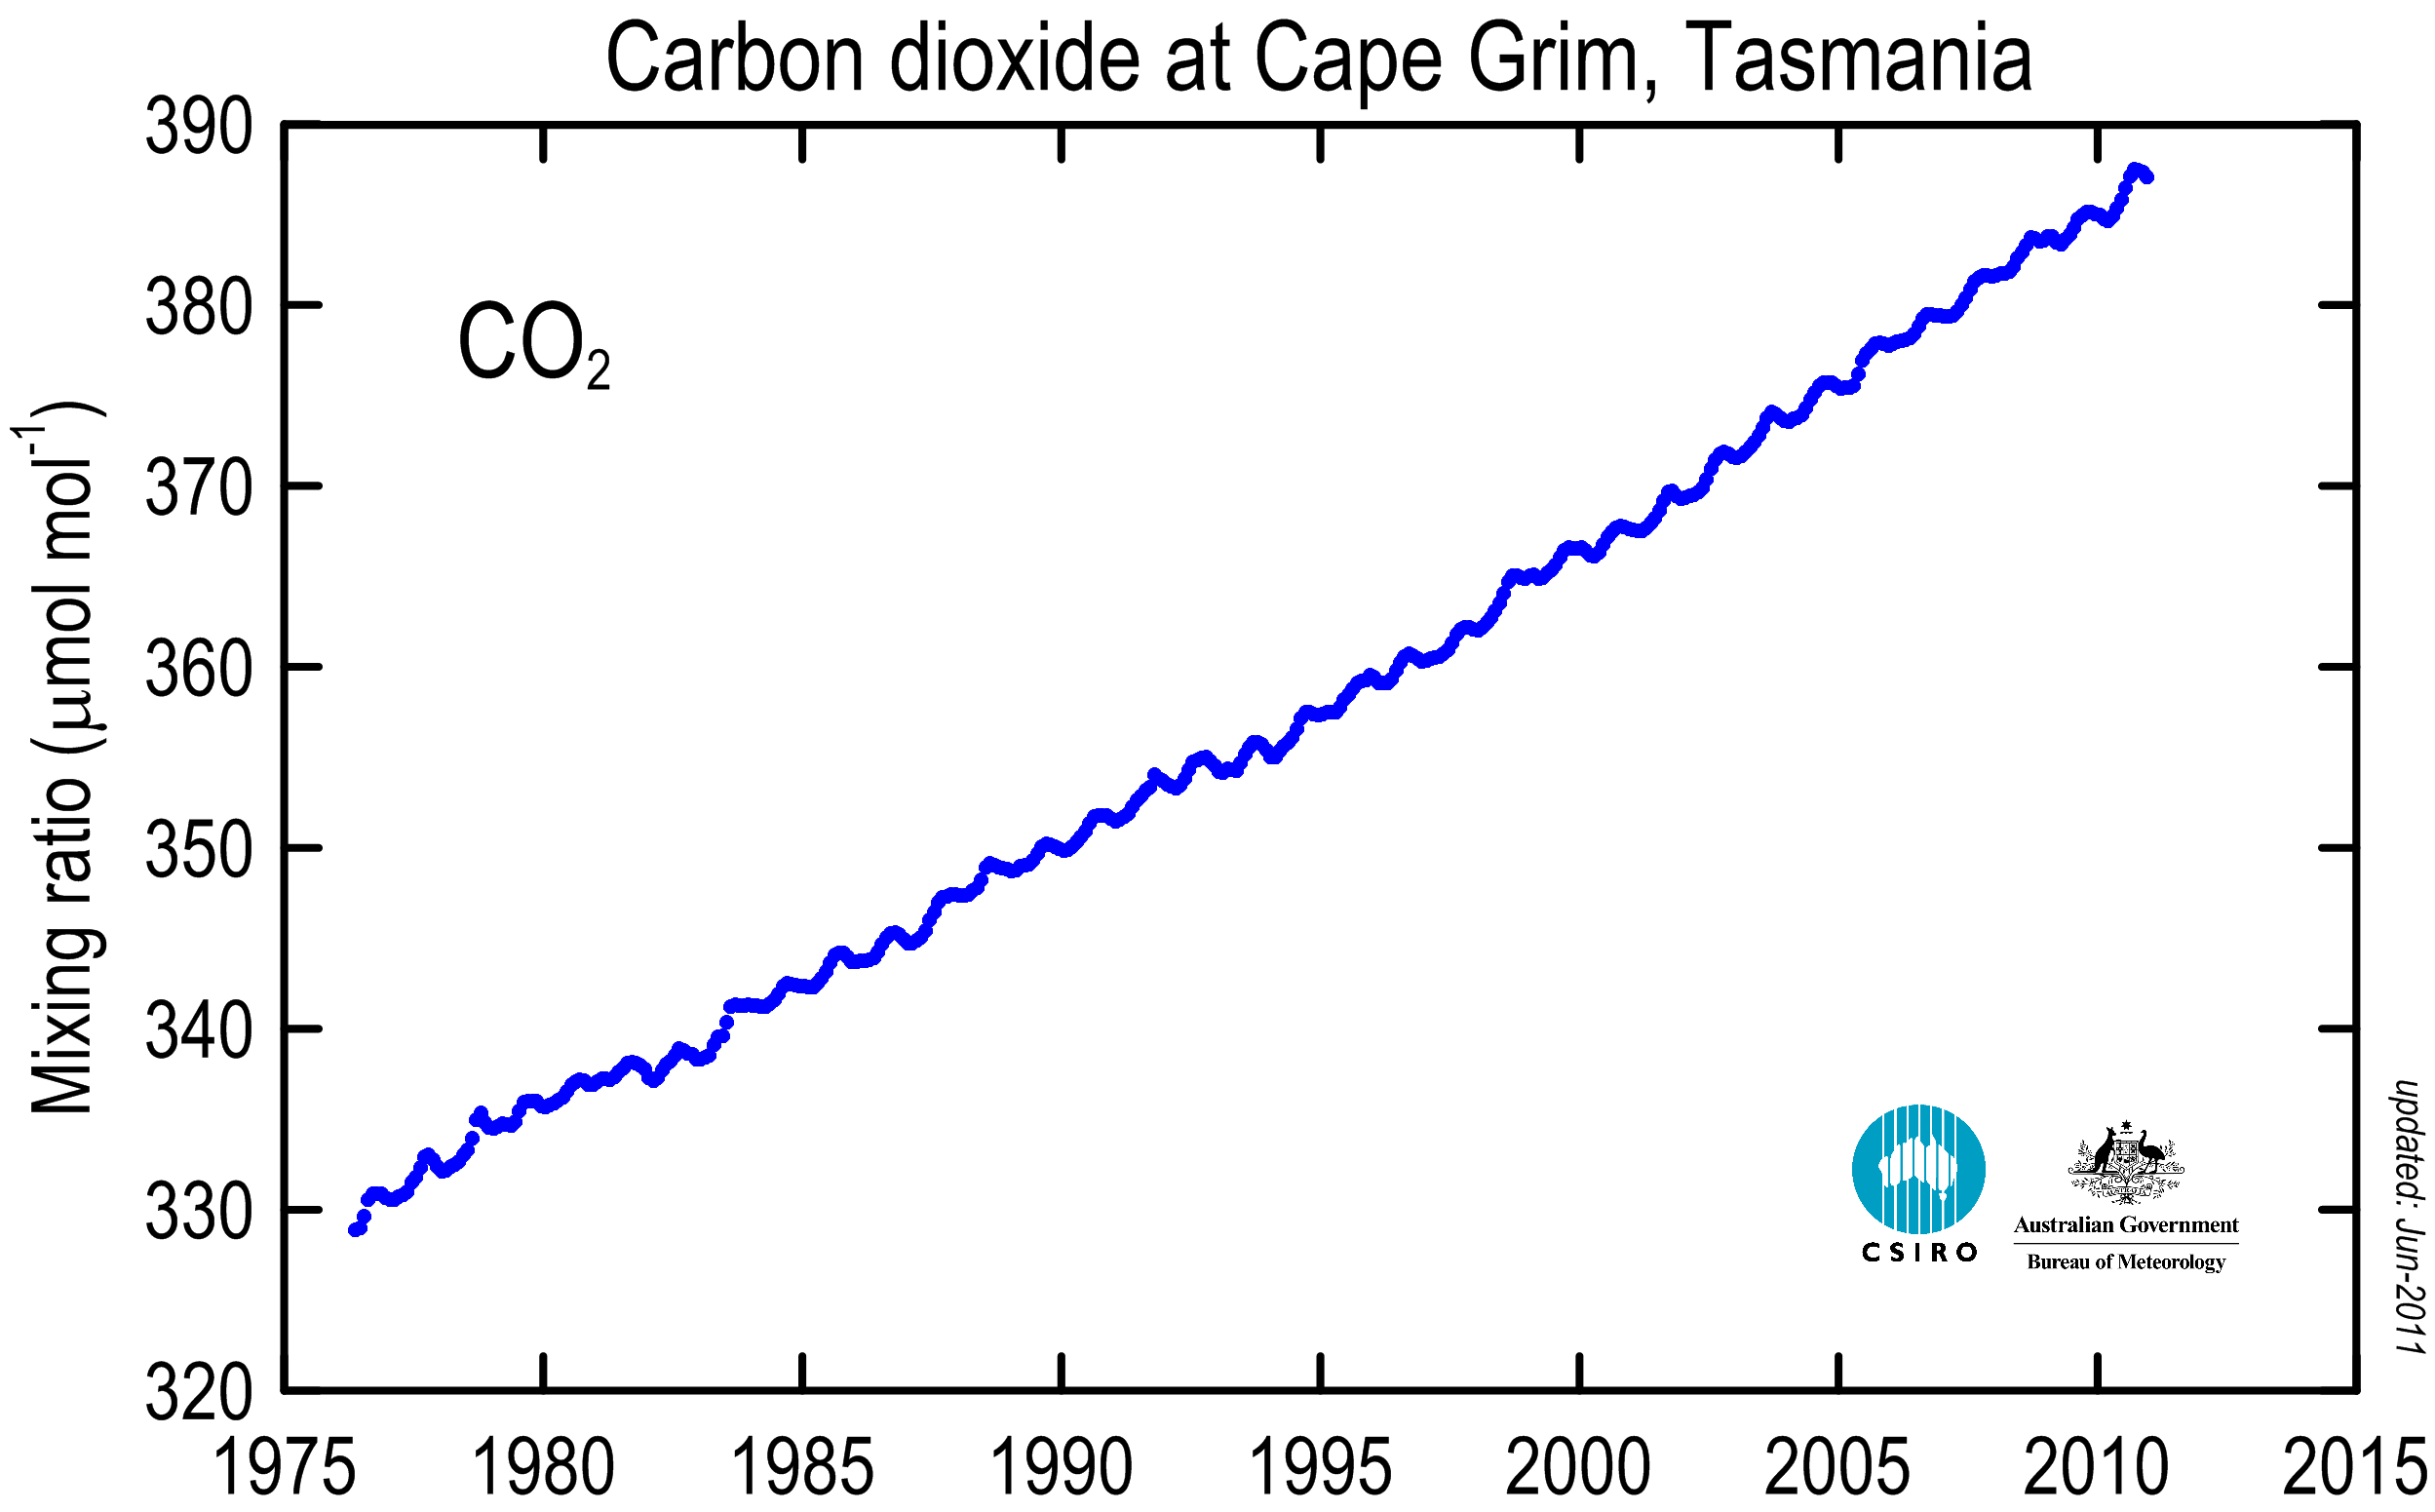
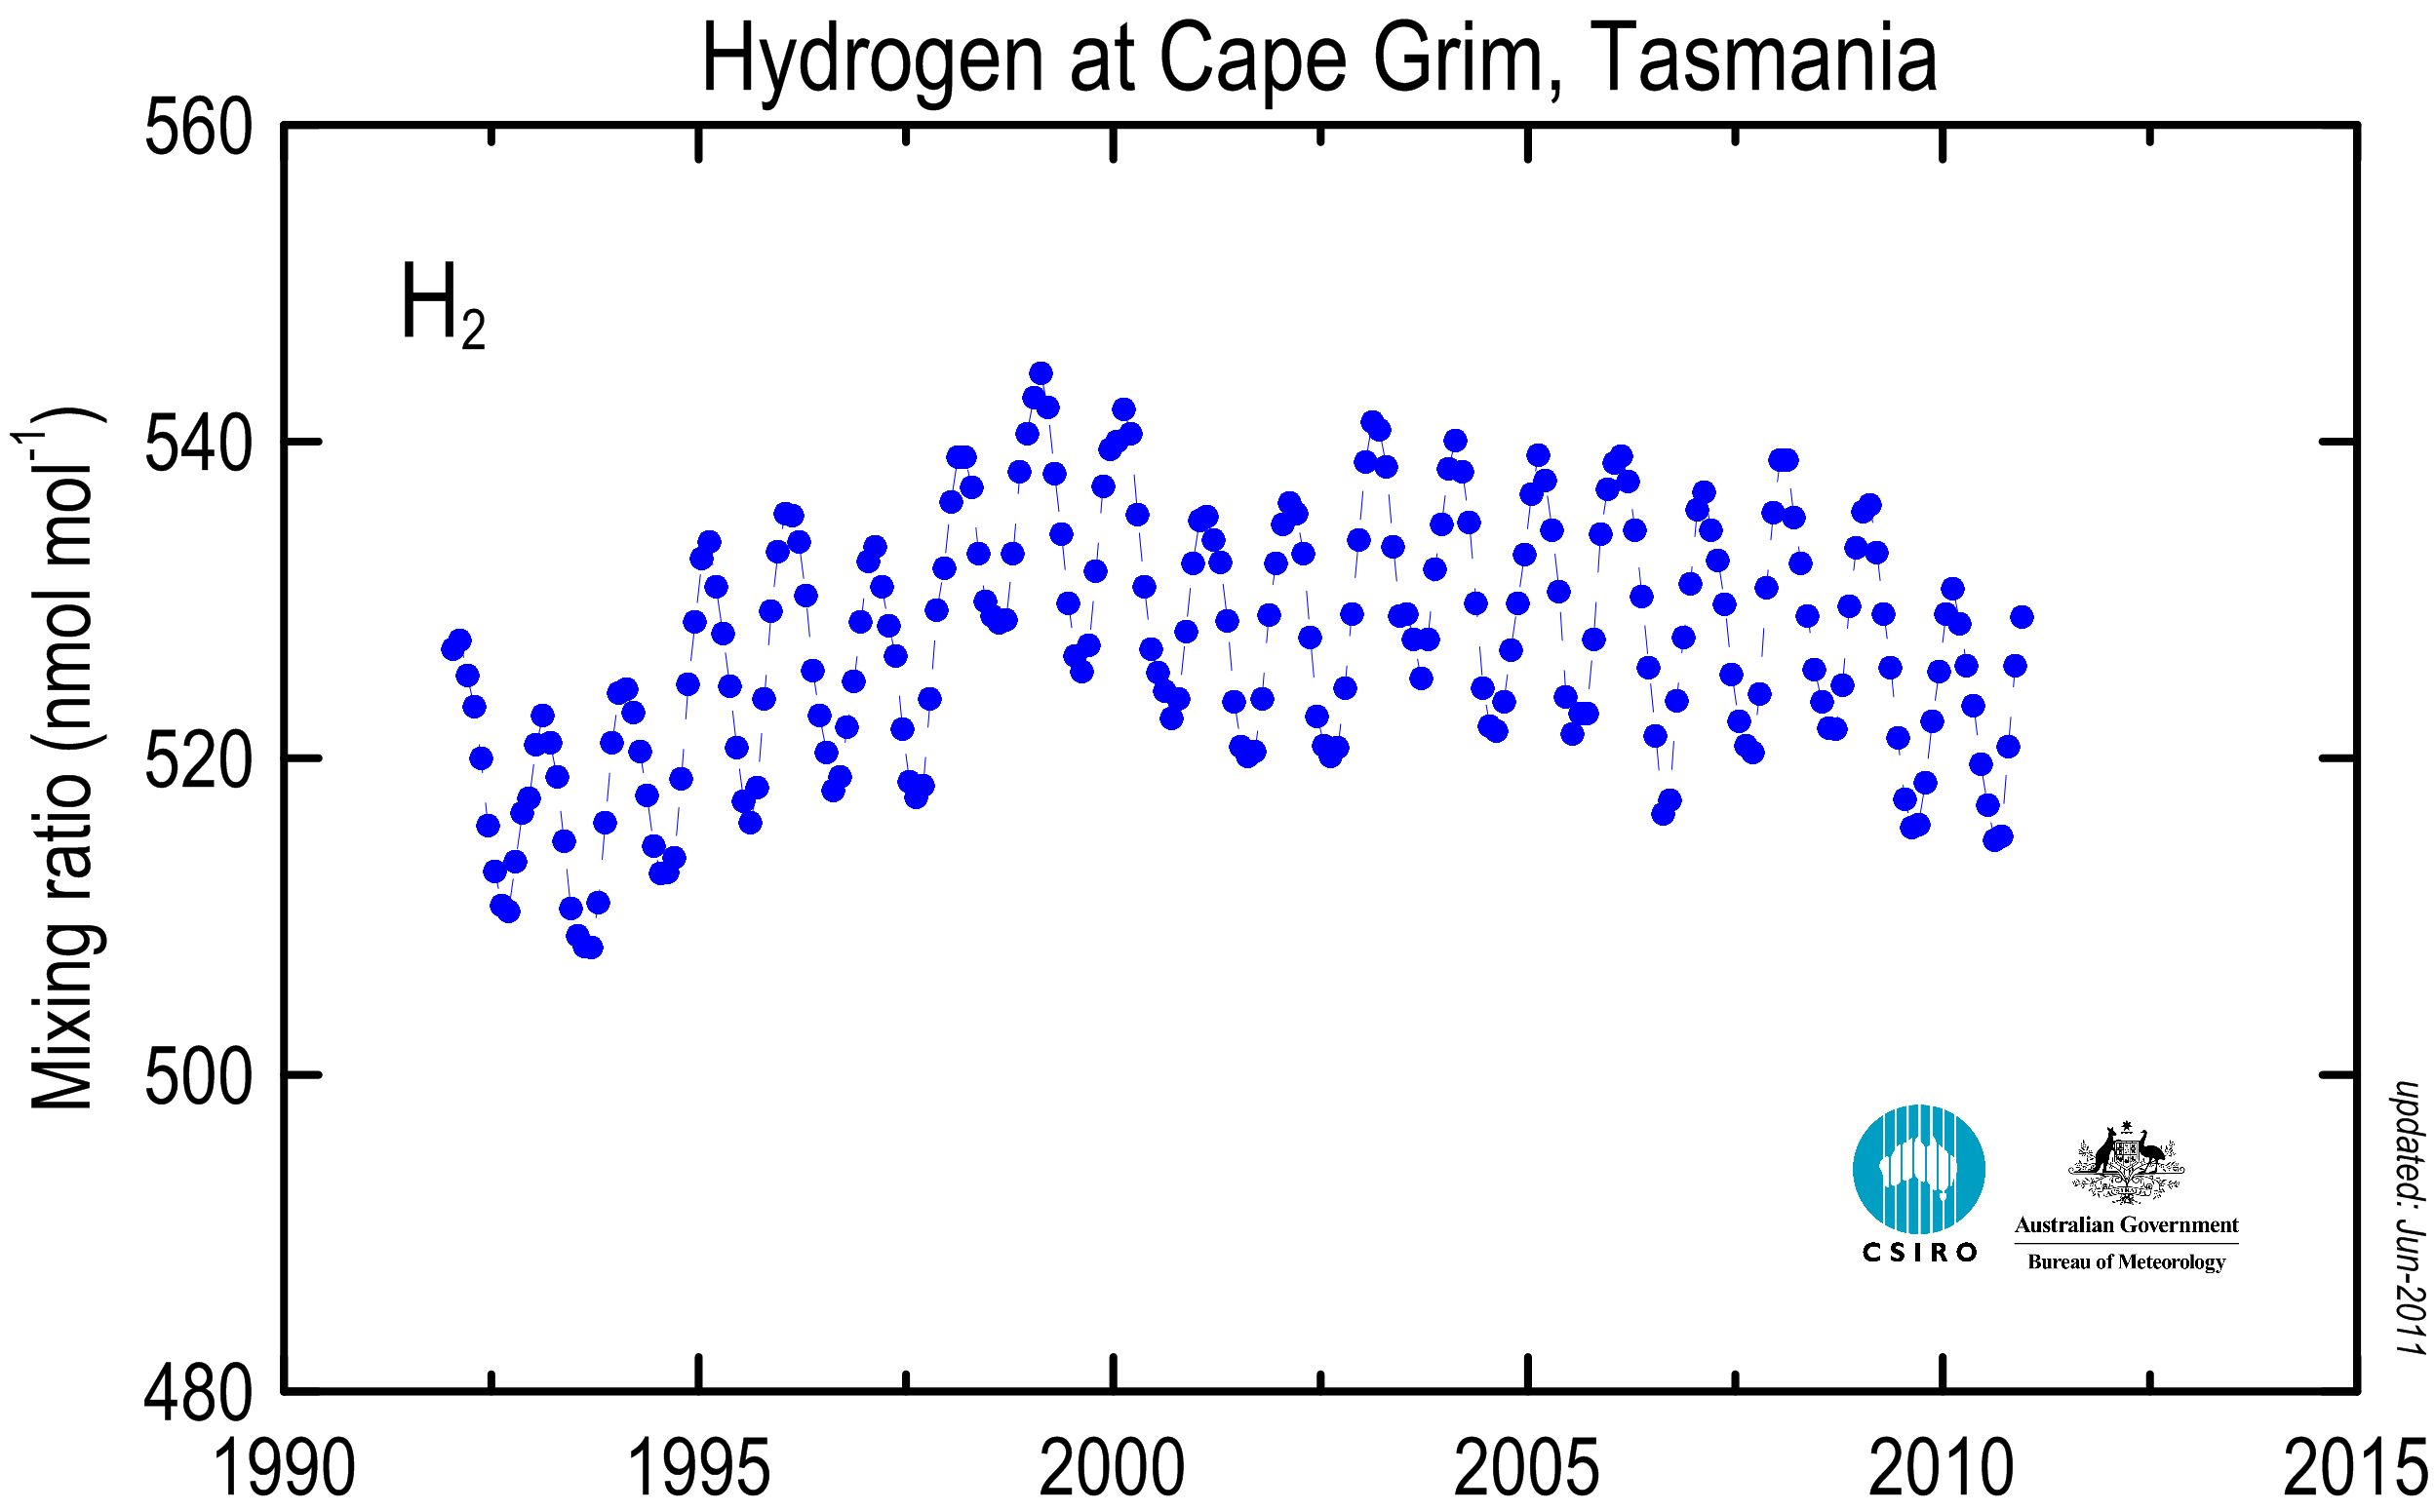
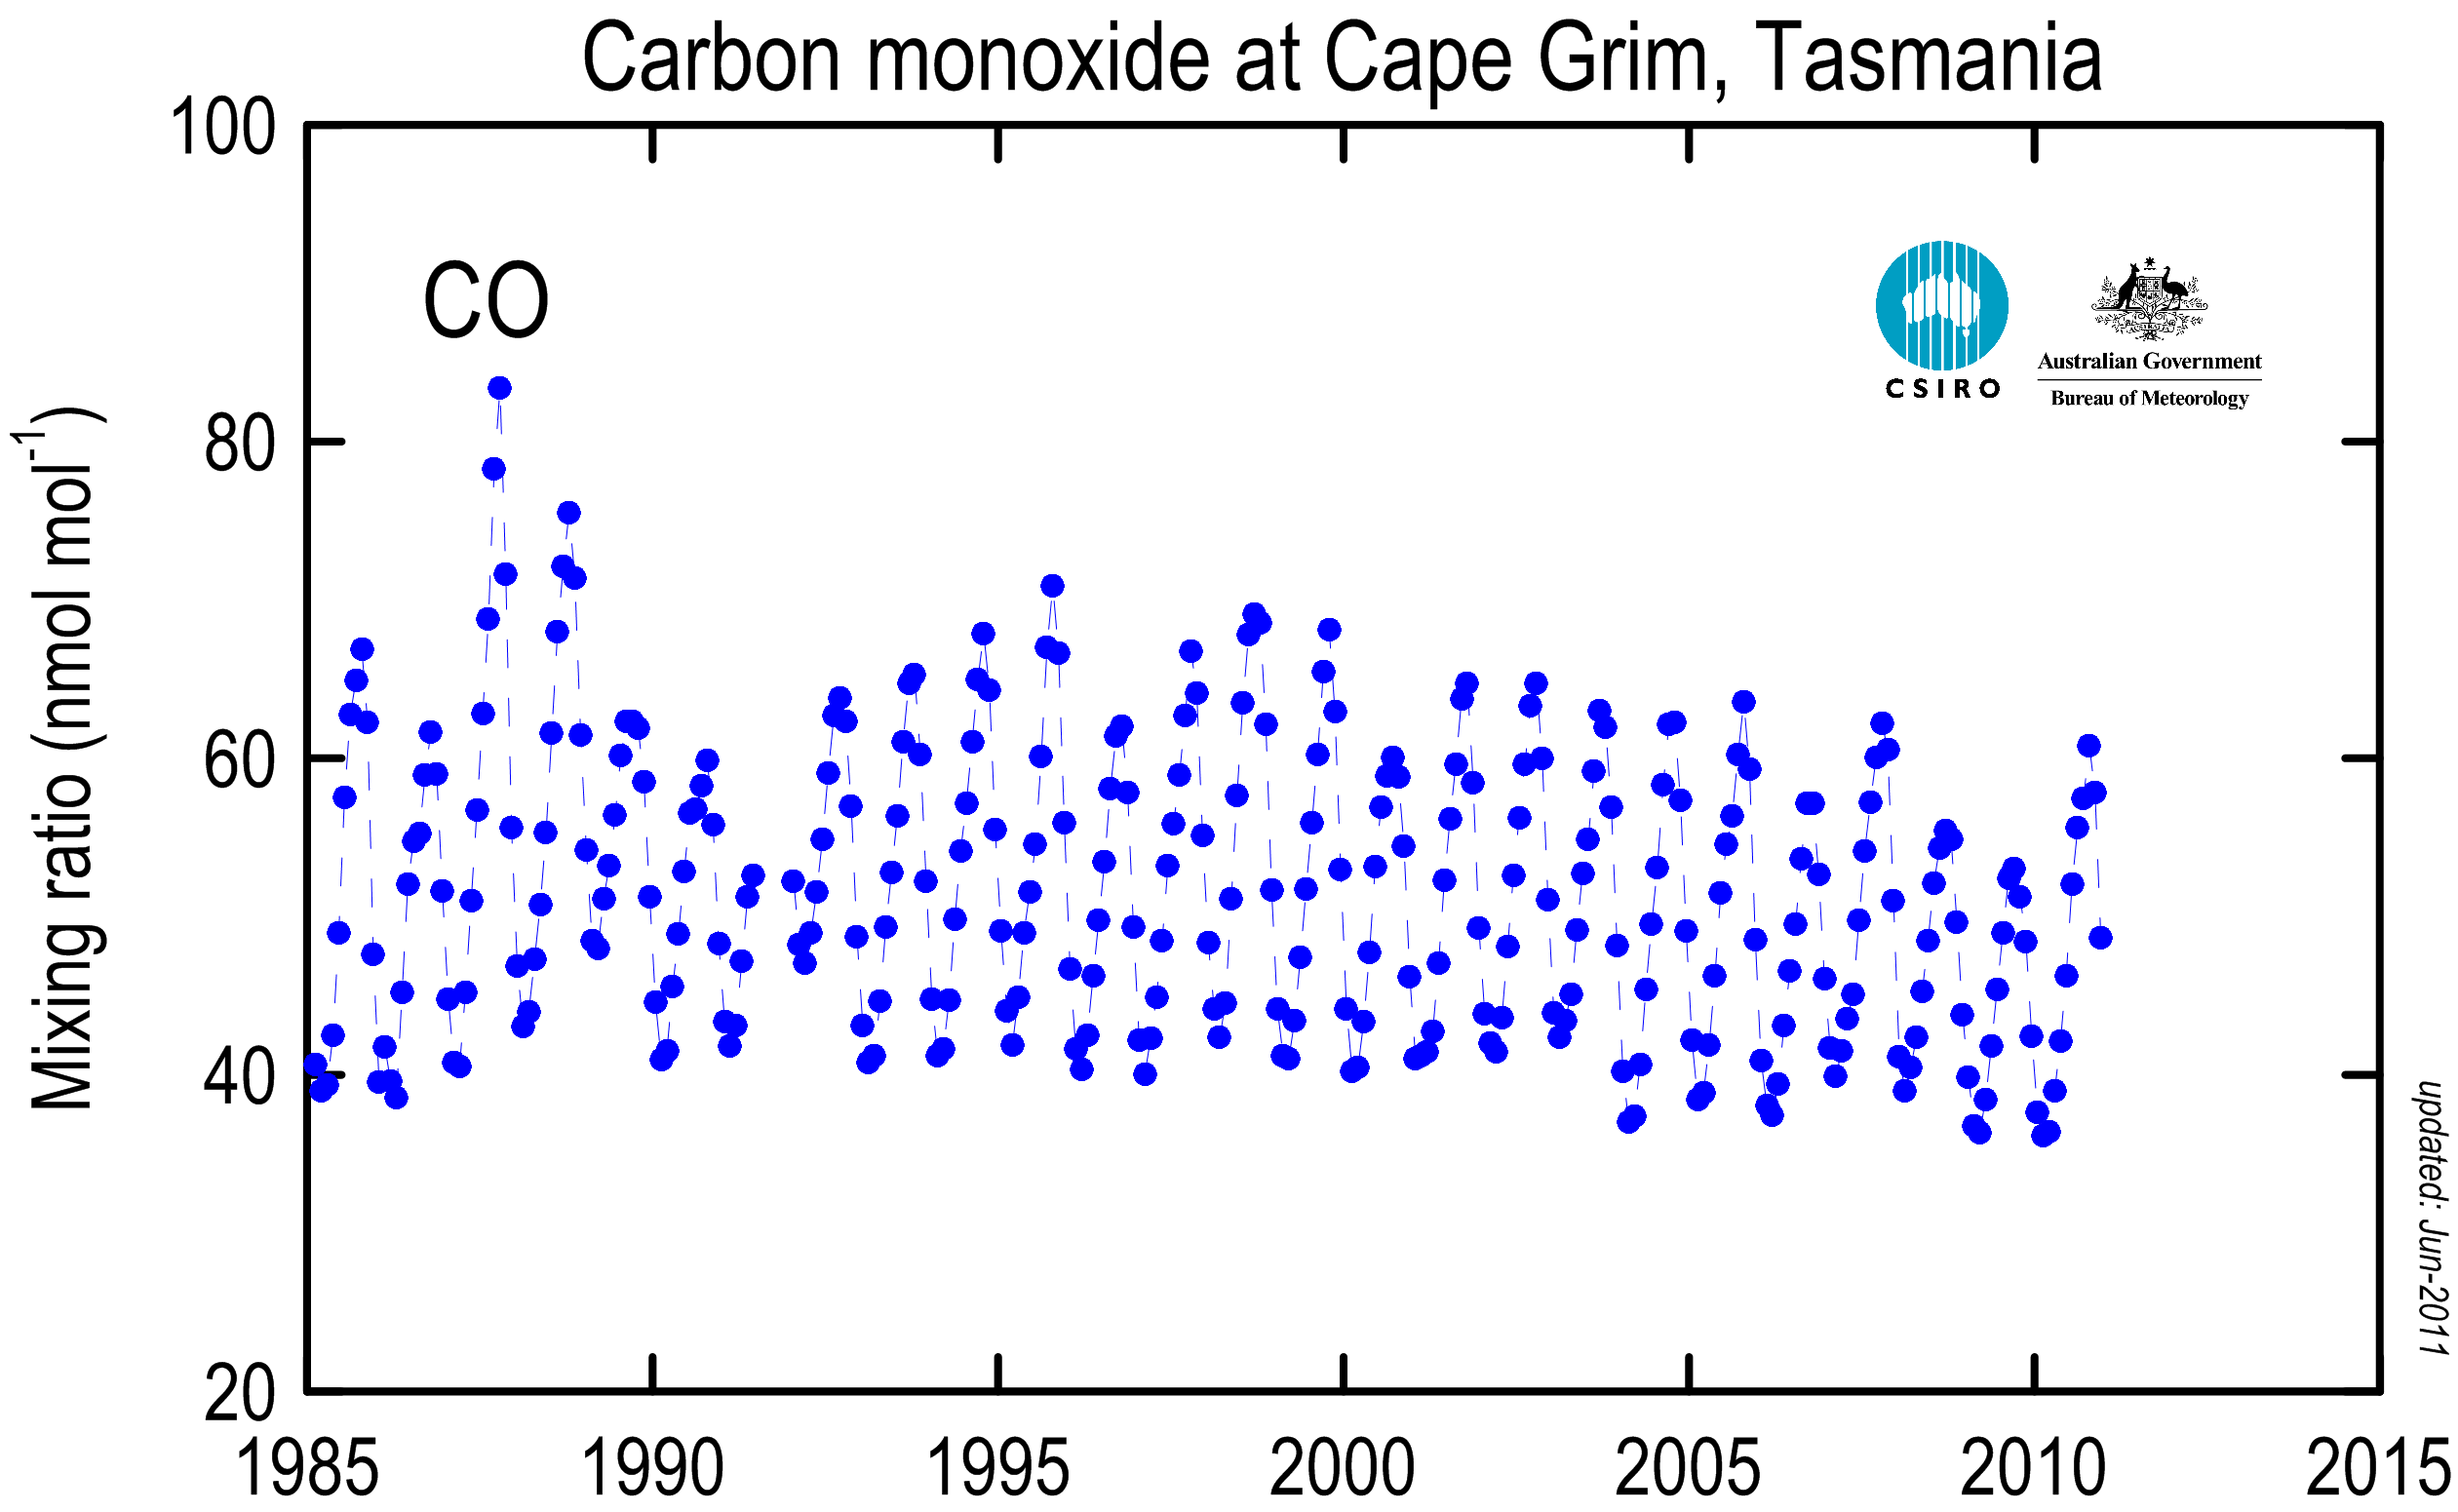
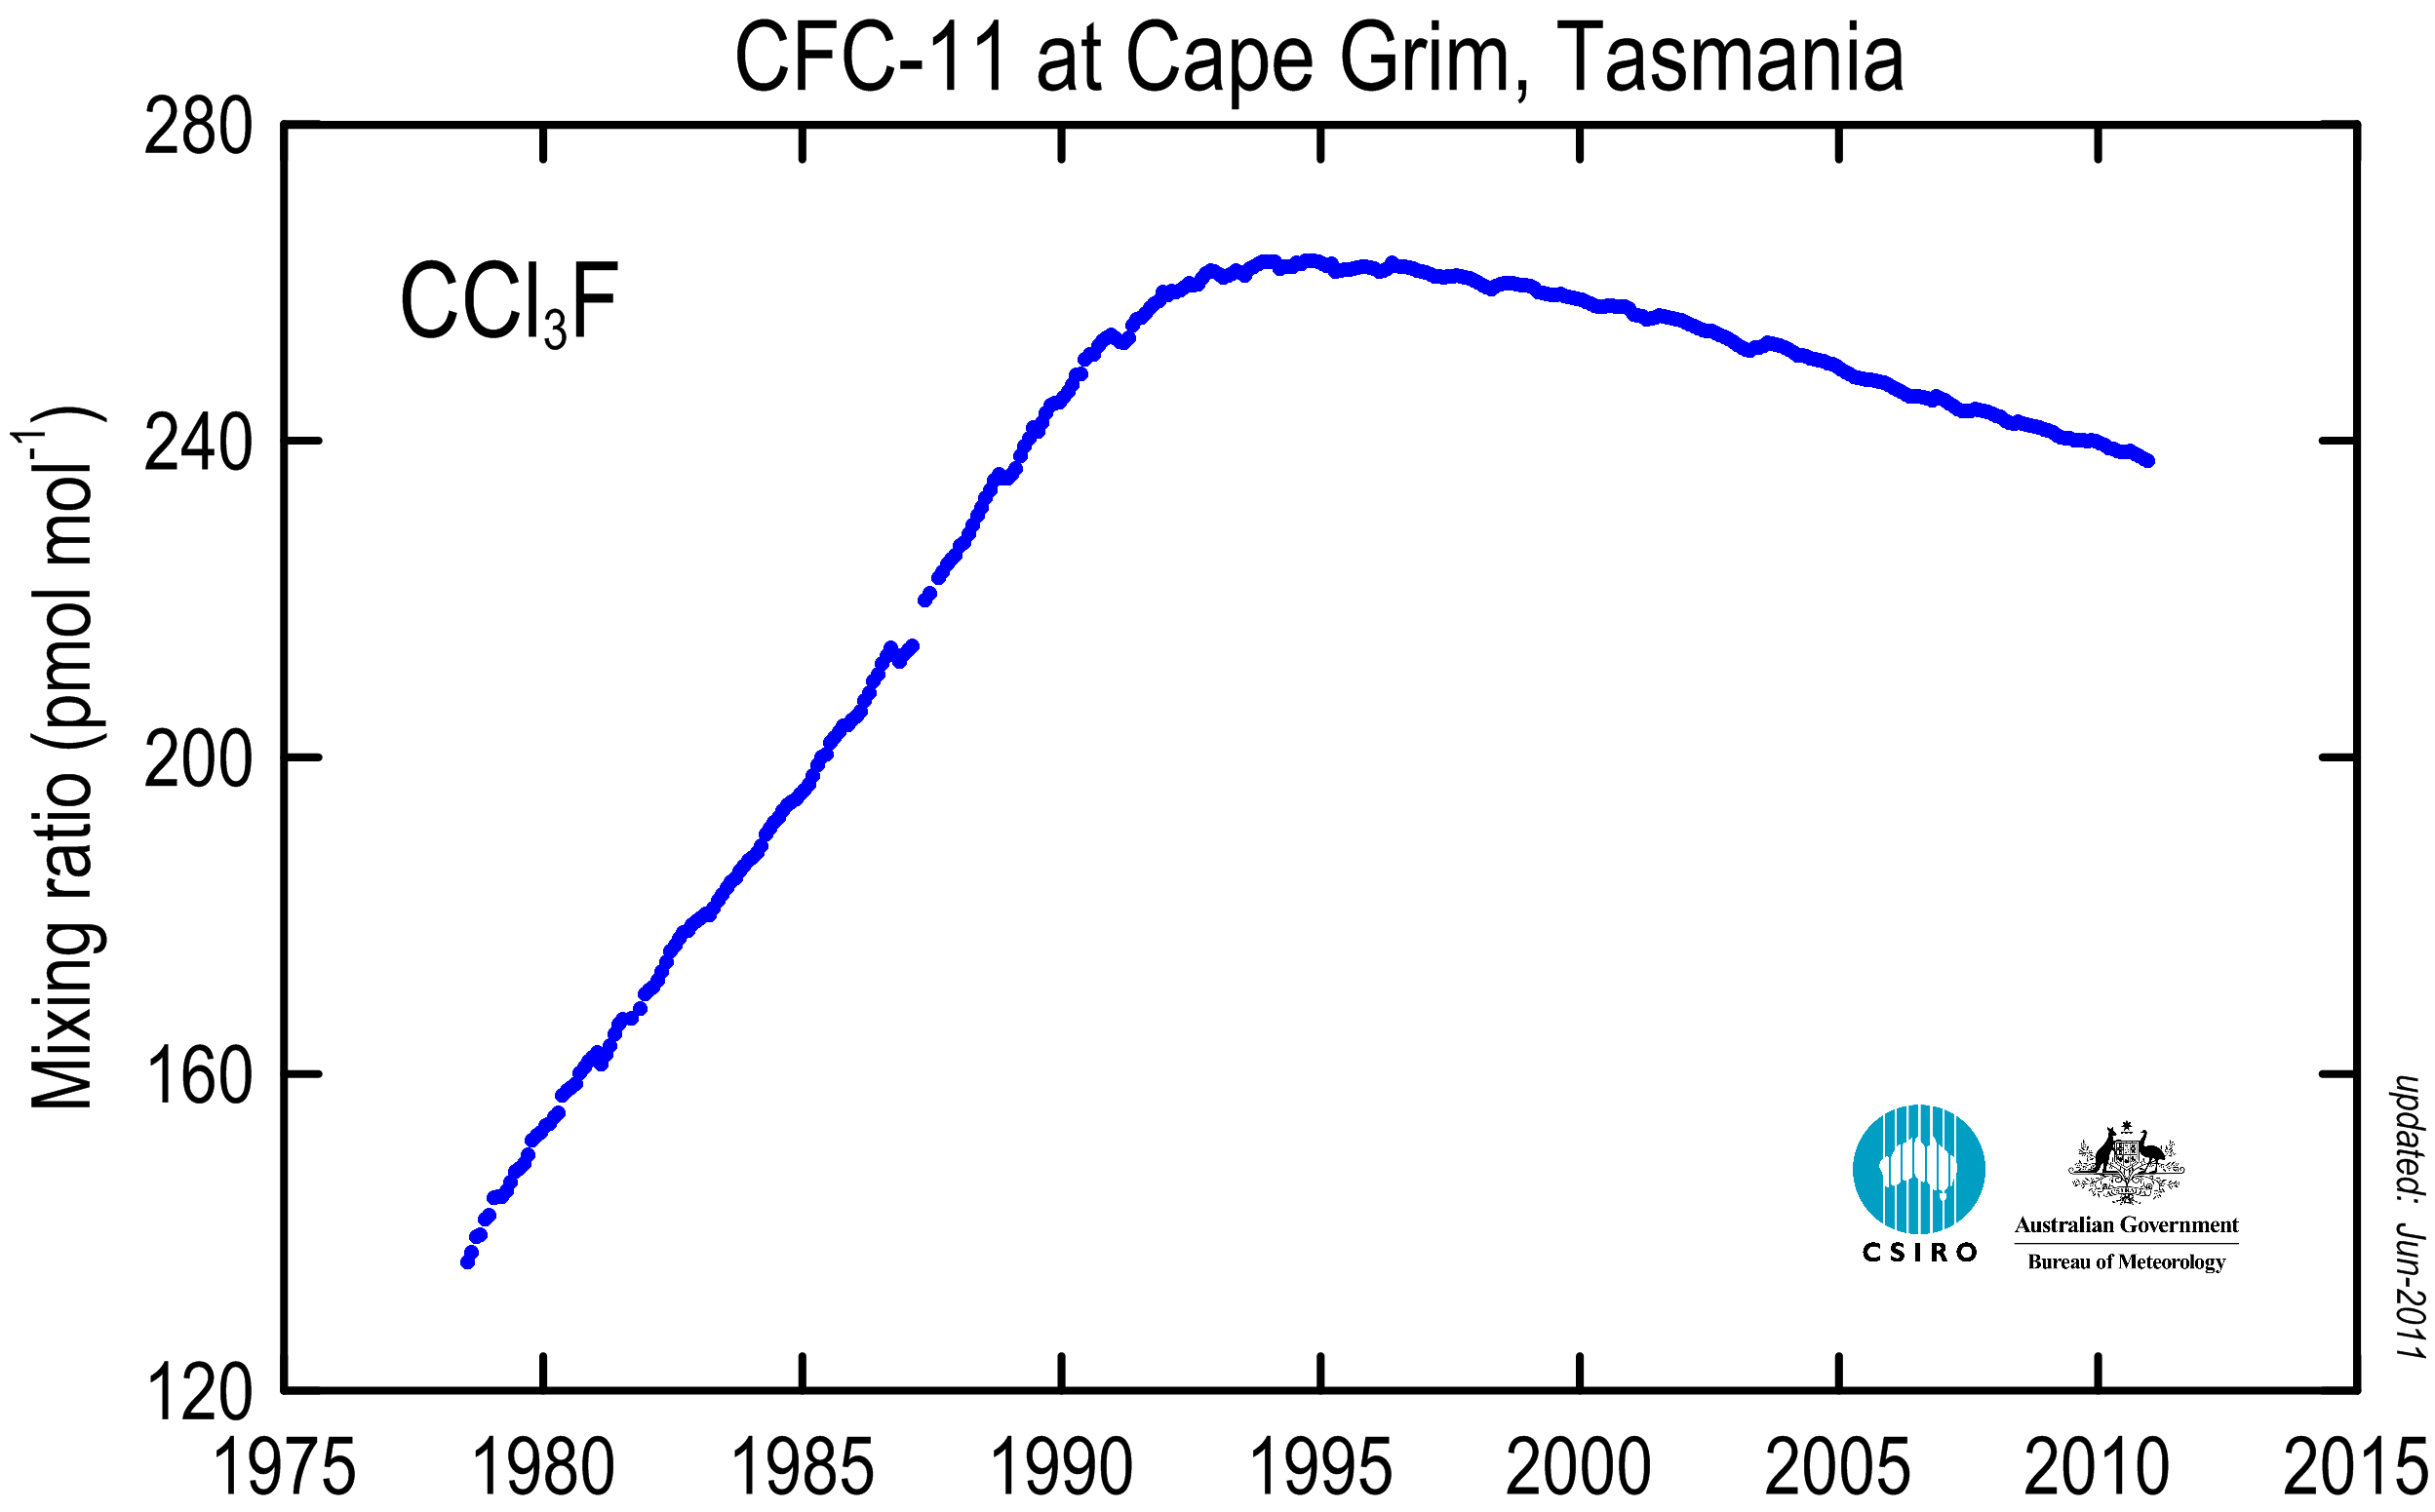
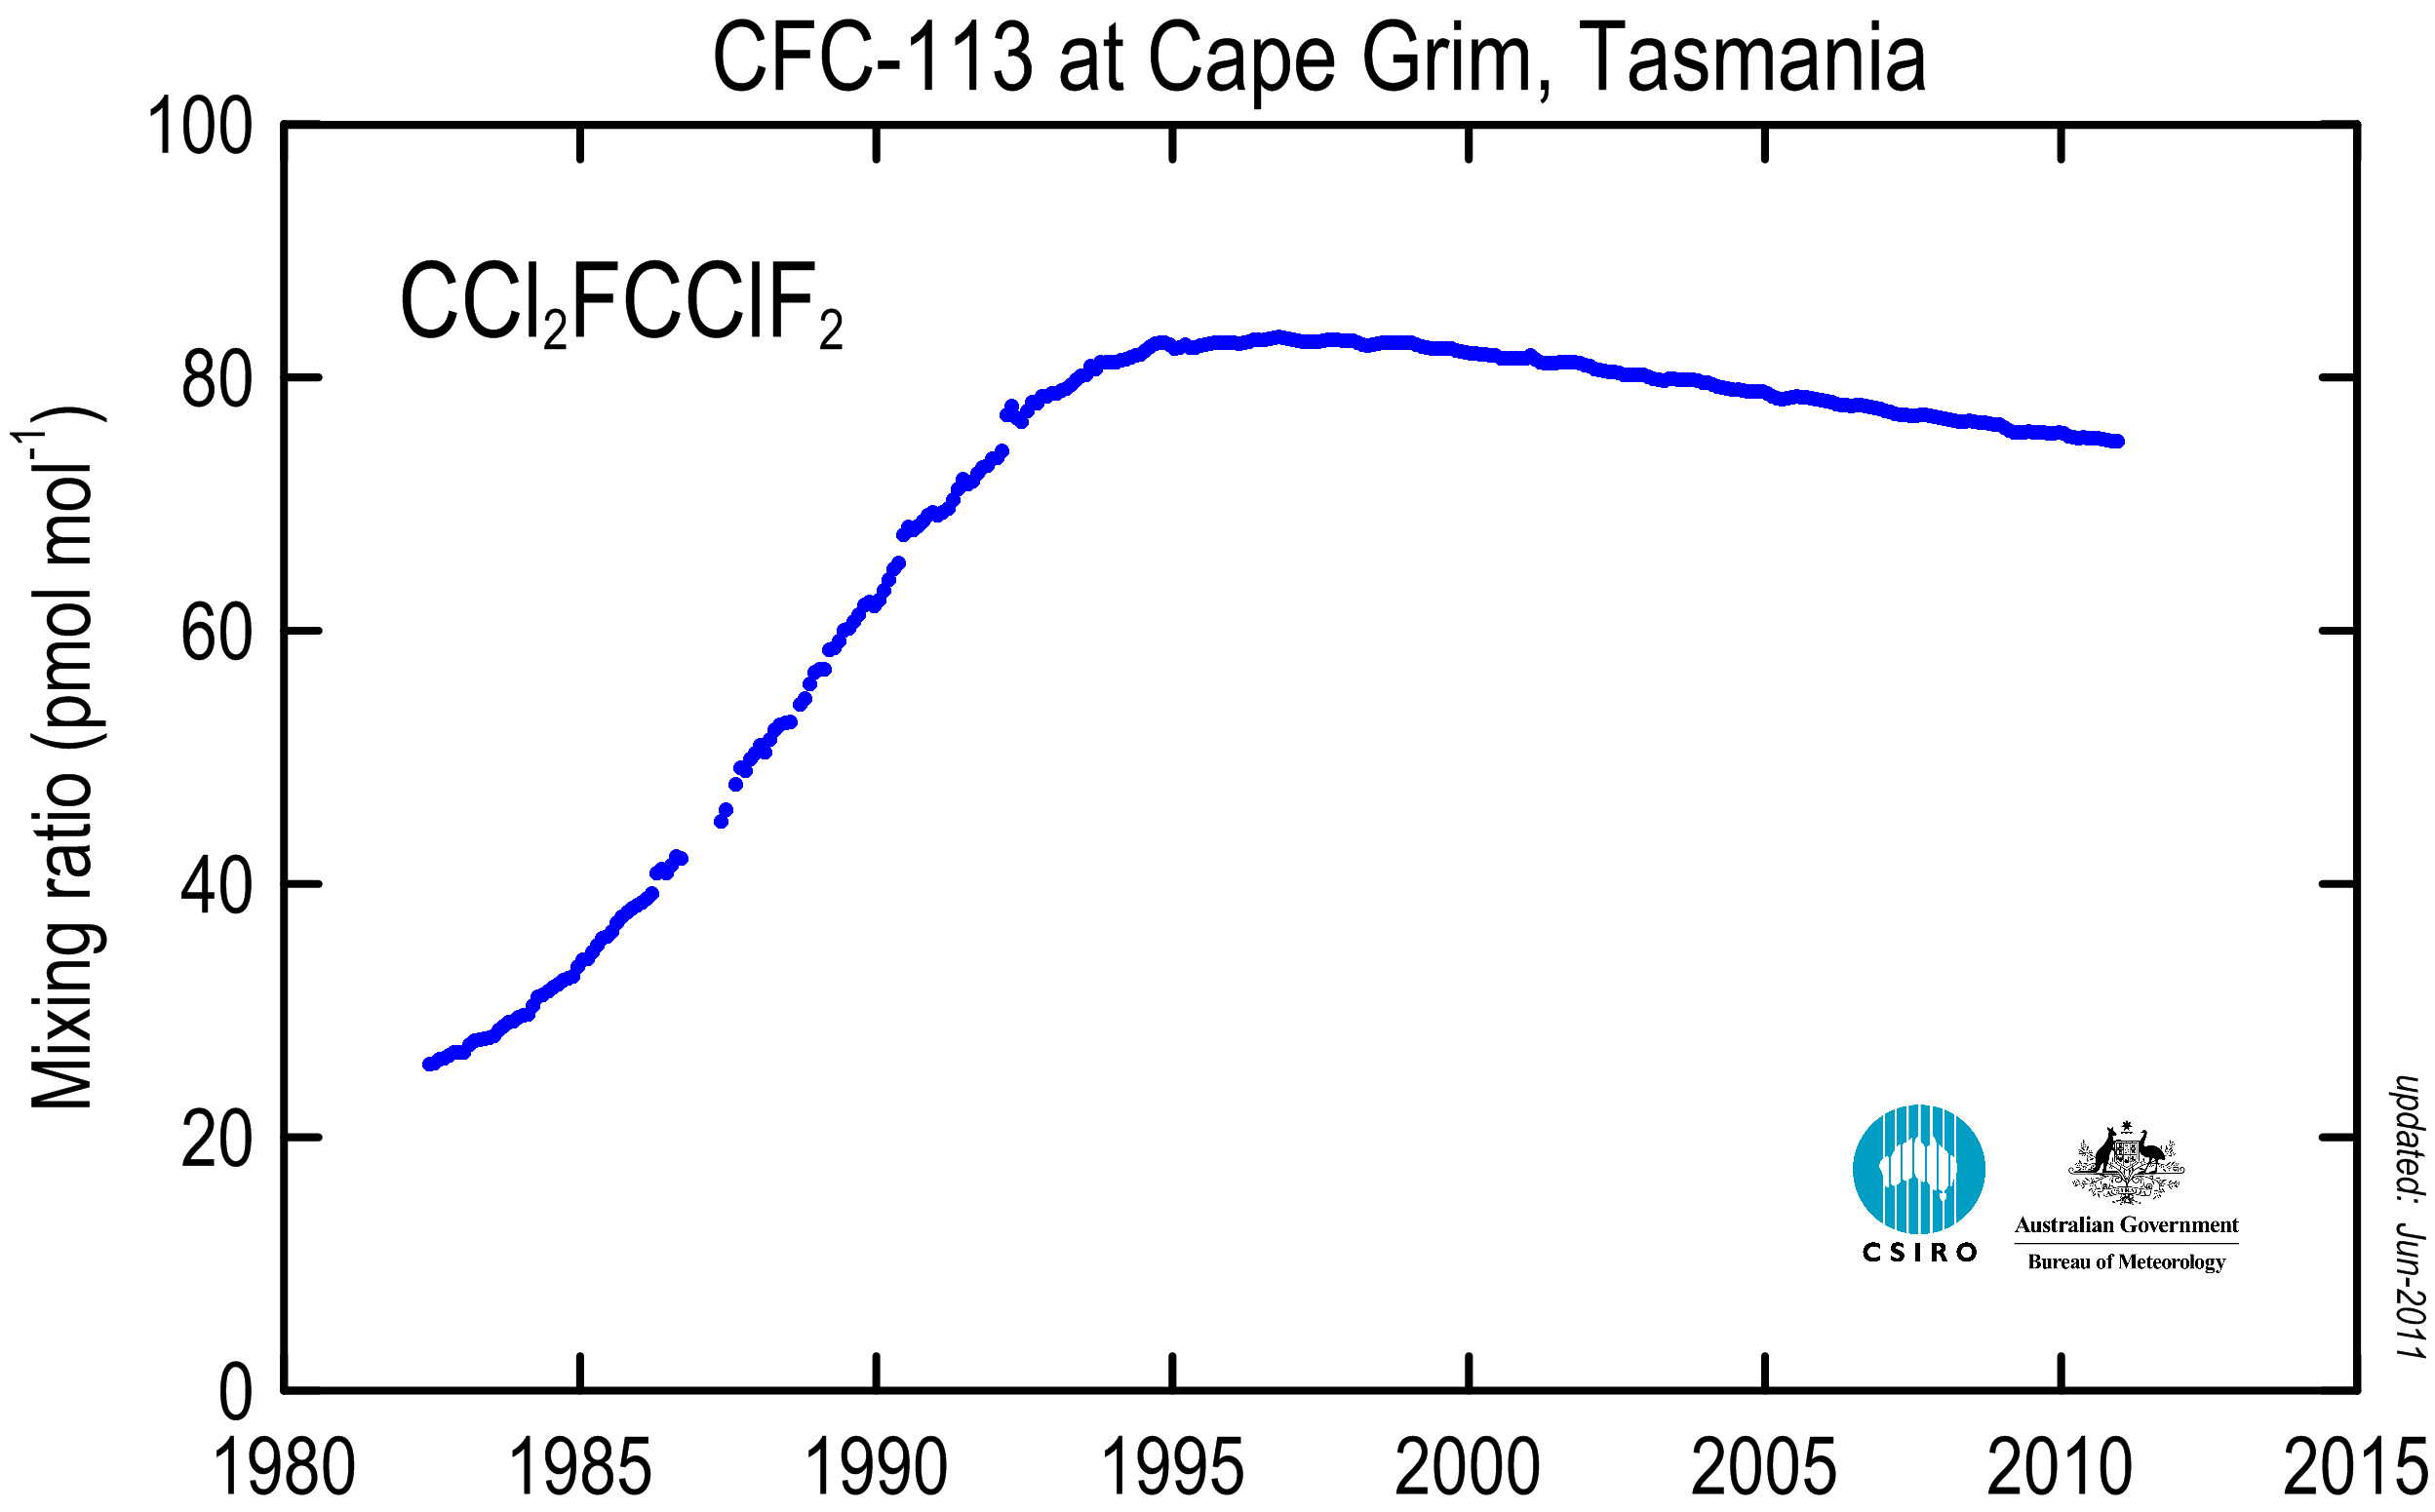
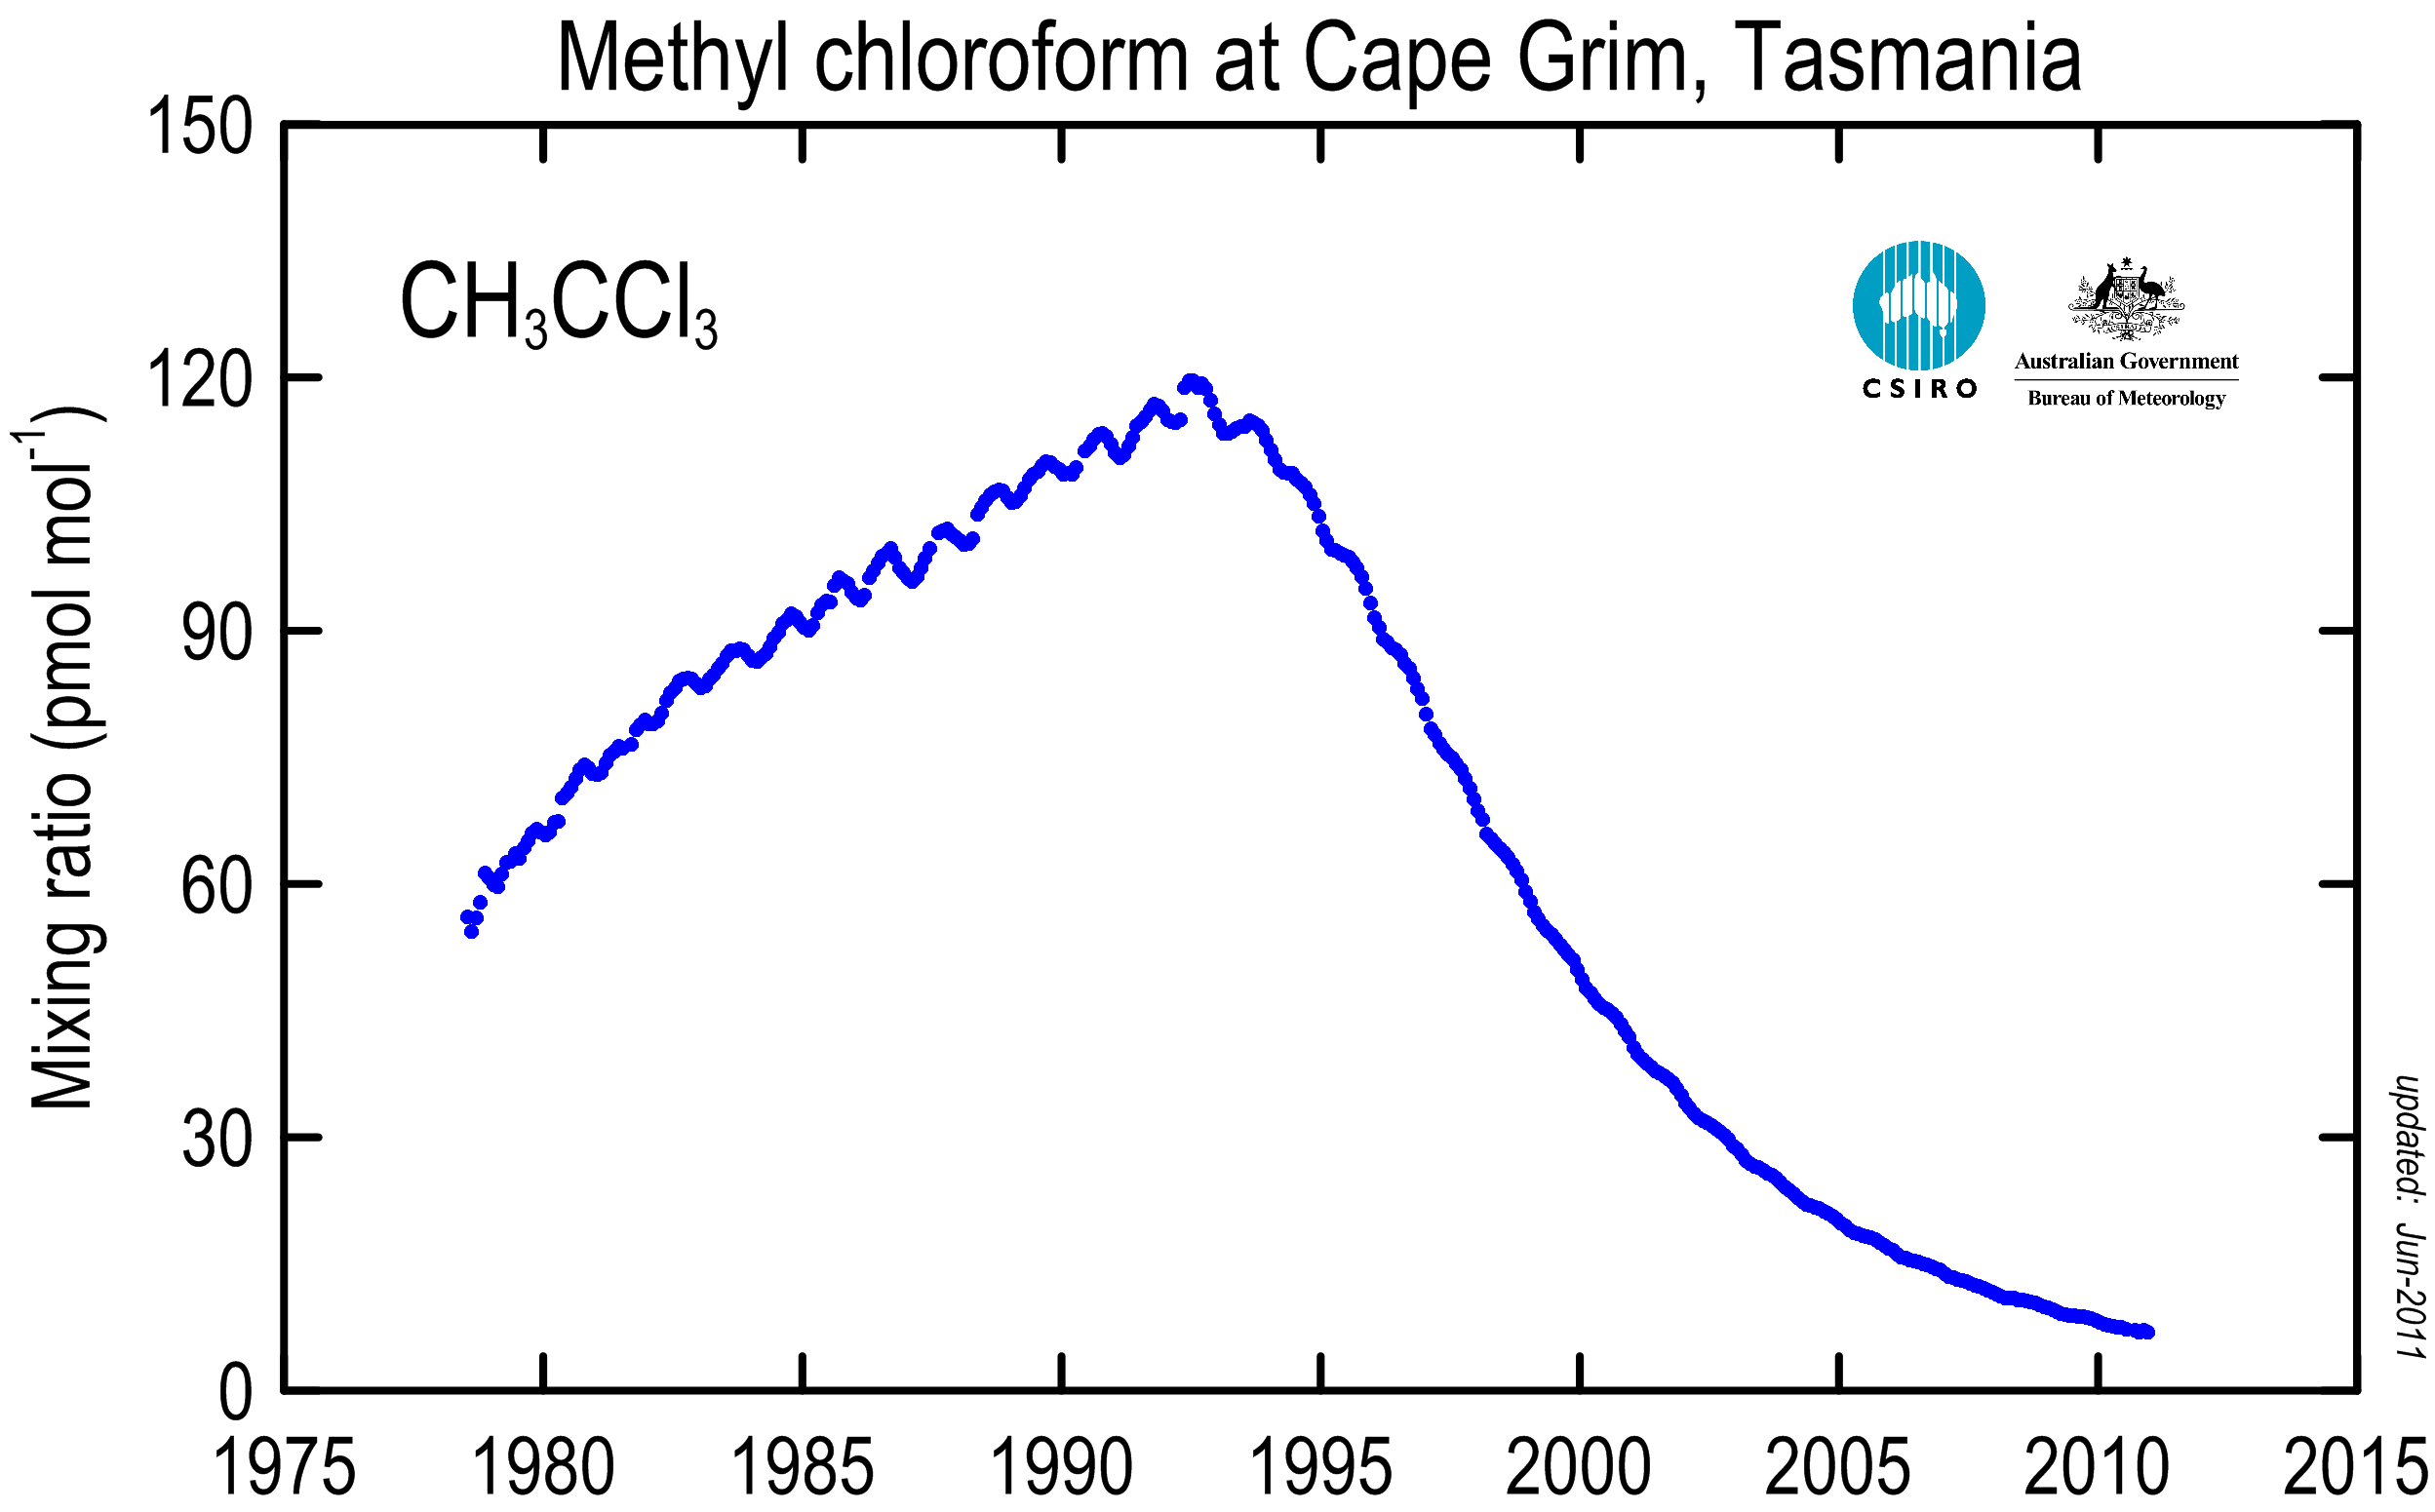
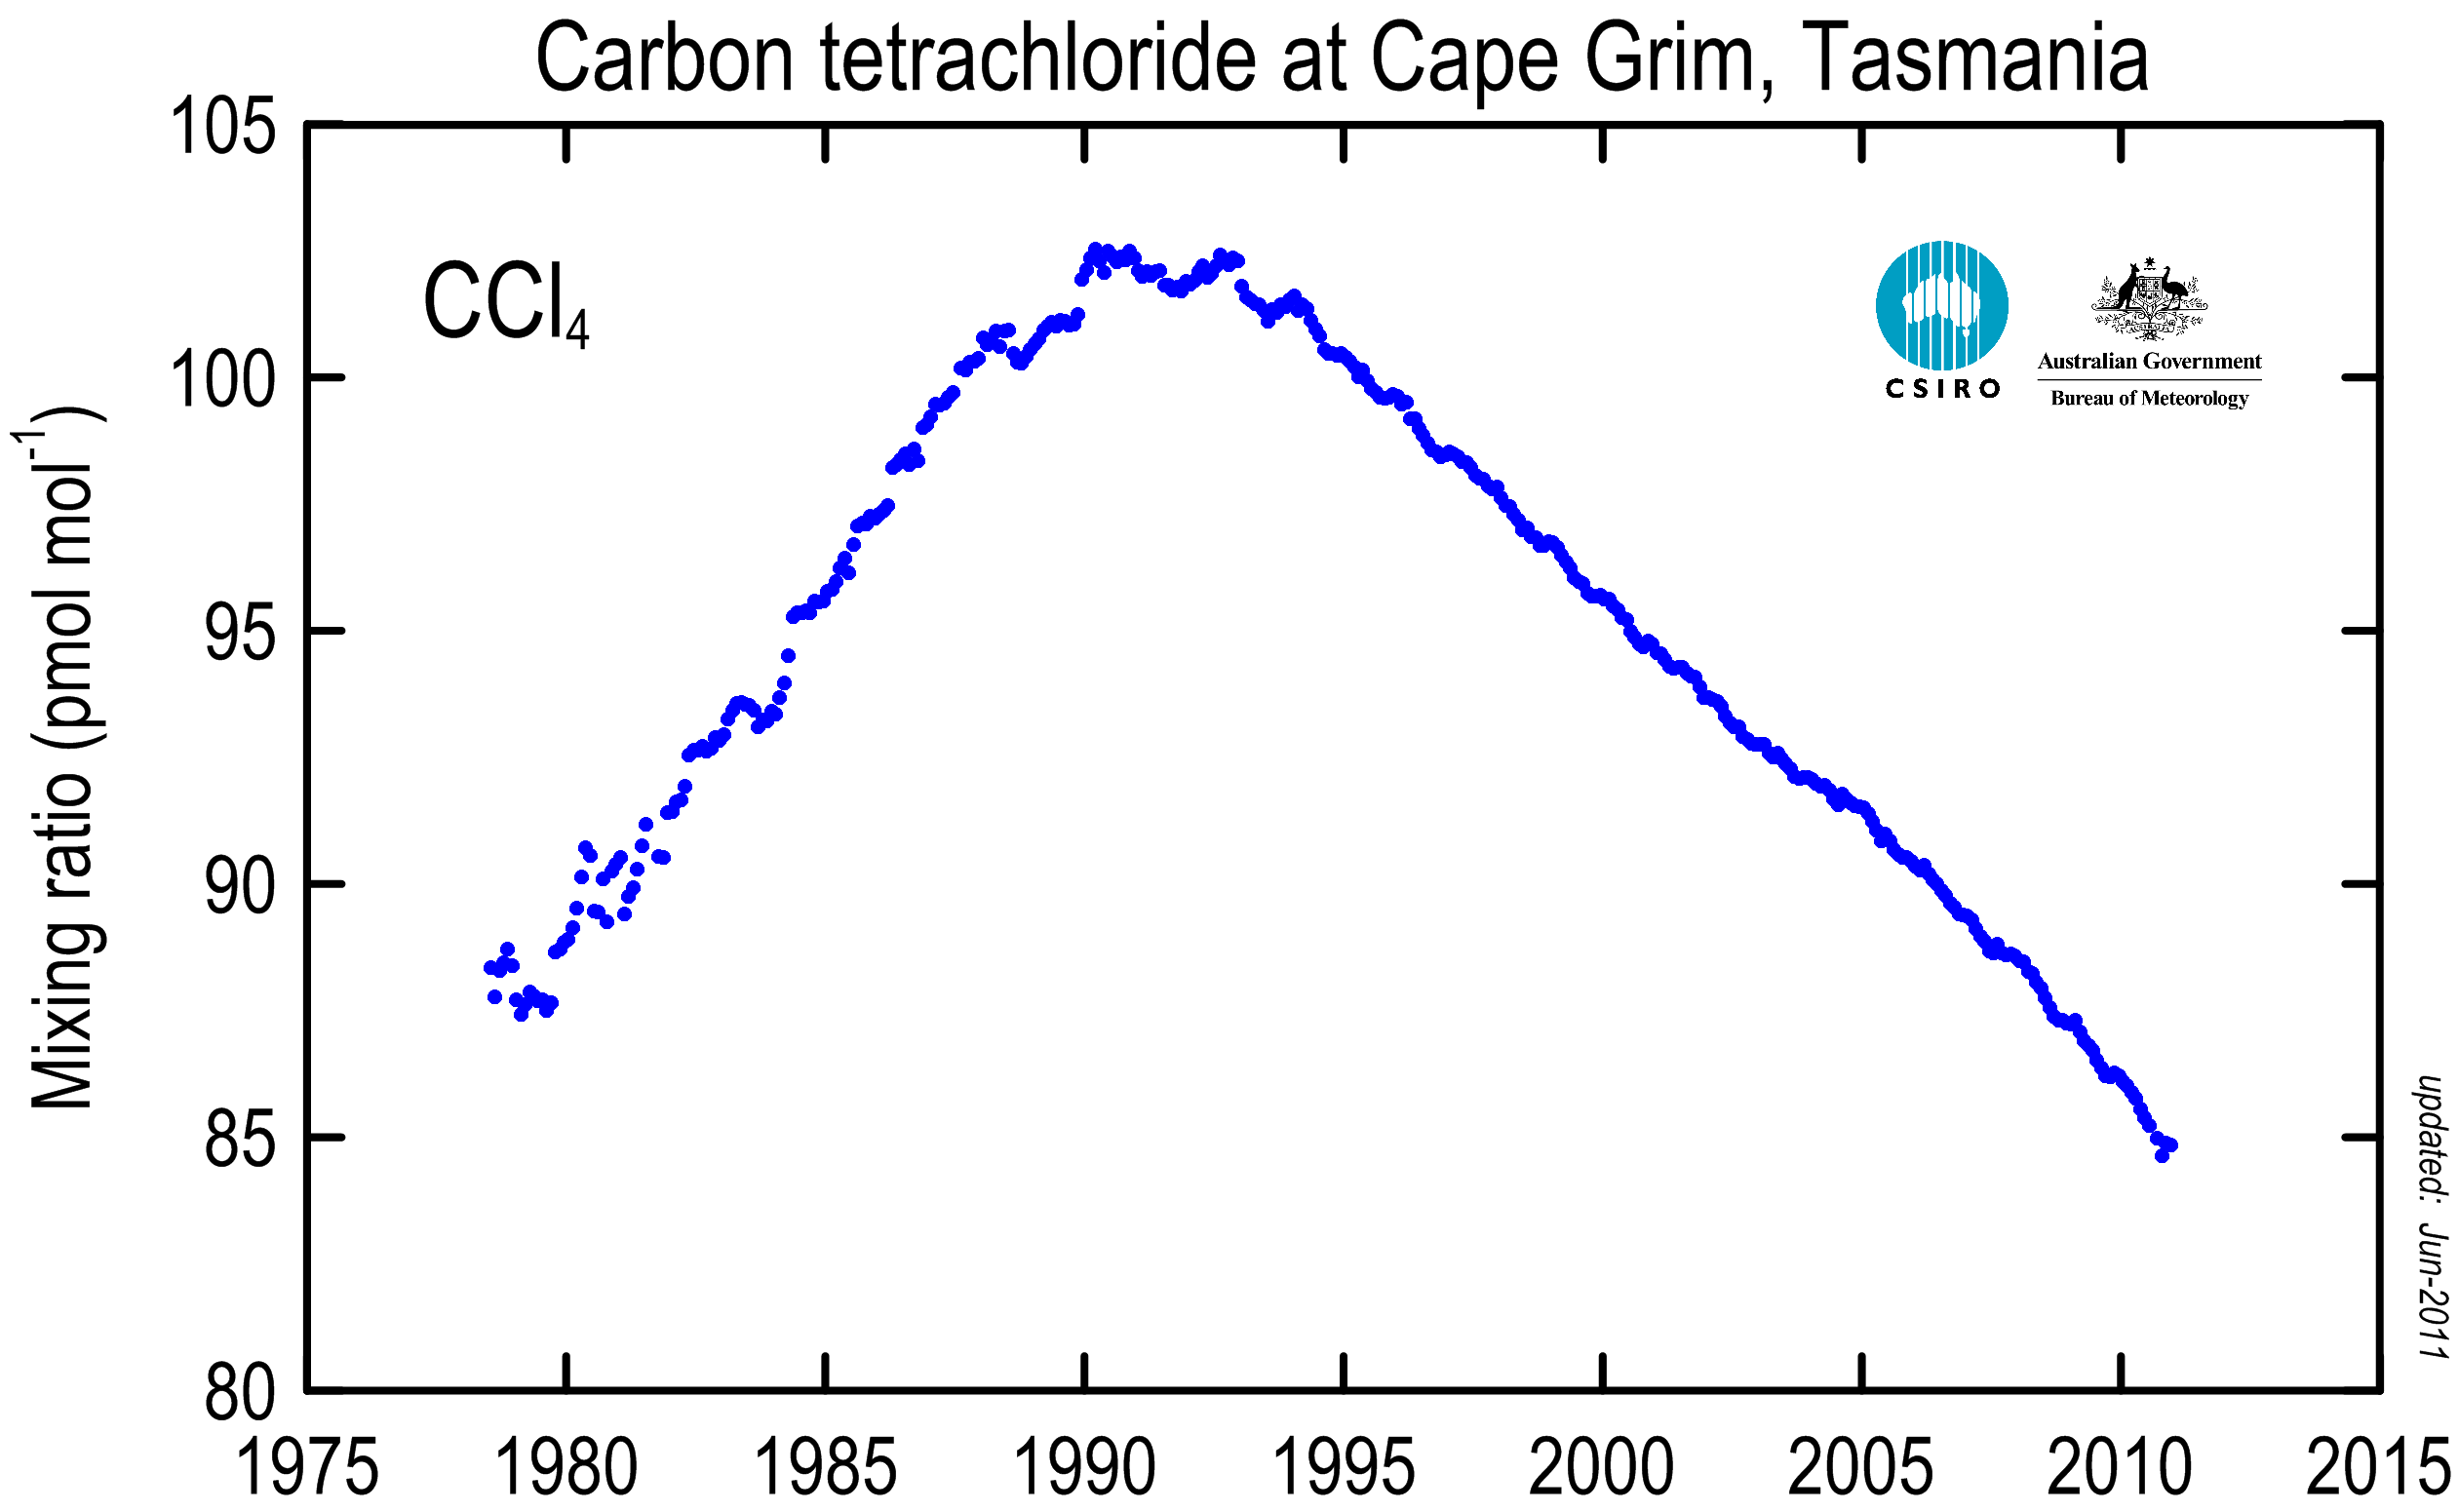
These graphs show changing atmospheric concentrations of key ozone
depleting gases, greenhouse gases and related species, as measured
at the Cape Grim Baseline Air Pollution Station in north-western Tasmania.
The Cape Grim program, to monitor and study global atmospheric composition,
is a joint responsibility of the Bureau of Meteorology and CSIRO. To
view a large version of the graph, click on the thumbnail.
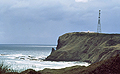
Cape Grim |
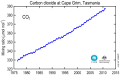
Carbon dioxide |
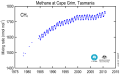
Methane |
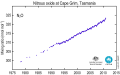
Nitrous oxide |
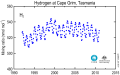
Hydrogen |
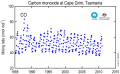
Carbon monoxide |
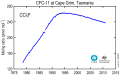
CFC-11 |
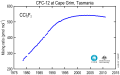
CFC-12 |
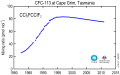
CFC-113 |
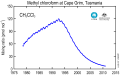
Methyl chloroform |
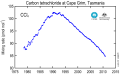
Carbon tetrachloride |
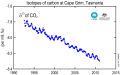
Carbon 13 of CO2 |
[top]

|
|