Observed conditions for nowcasts
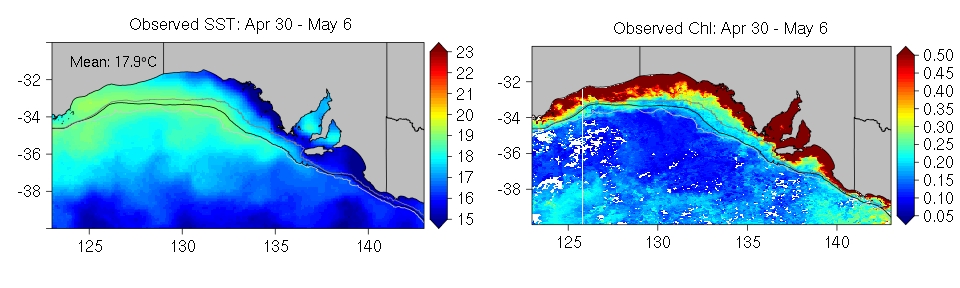
Left: Average SST (°C) over the most recent week available. Right: Average chlorophyll a (mg/m3) over available days of the corresponding week. White indicates no data were available during that period. The dark grey, black and light grey lines indicate the 100 m, 200 m and 1000 m depth contours.
Back