| |
|
The Kwinana Coastal Fumigation Study Contents1. Background2. Purpose of the Study and Experimental Program3. Observations and Selected Experimental Results
4. Fumigation Modelling Results5. Concluding Remarks1. BACKGROUNDComplex meteorology of shoreline environments can adversely affect dispersion of air pollutants. A dispersion process that can lead to relatively high ground-level concentrations (GLCs) of pollutants in such regions is continuous fumigation in which an elevated plume travelling in a stable (or neutral) onshore flow with little diffusion is entrained into a spatially growing thermal internal boundary layer (TIBL) and undergoes rapid vertical mixing due to convective motions generated within the boundary layer (Fig.1).
|
|||||||||||||||||||||||
|
|
|
|
The Department of Environmental Protection (DEP) of Western Australian uses a short range Gaussian plume modelling system, DISPMOD (Rayner, 1987), for air quality management at Kwinana. The purpose of the Kwinana Coastal Fumigation Study, which was undertaken between 26 January and 6 February 1995, was to obtain a detailed data set to assess, validate and improve several components of the treatment of fumigation in DISPMOD. These components include the onshore stability, the plume rise and dispersion in the layer above the TIBL, the growth of the TIBL with distance inland, the downward mixing of the plume within the TIBL (i.e. fumigation), and the parameterisation of the surface heat flux. The Study was undertaken by CSIRO Division of Atmospheric Research in collaboration with Division of Coal and Energy Technology (DCET), Flinders Institute for Atmospheric and Marine Sciences (FIAMS), Department of Environmental Protection of Western Australia, Western Power Corporation and Murdoch University.
The Kwinana Power Station (KPS) was used as a tracer source (see Fig.2a). It has three stages: A, B and C with stack heights of 114, 137 and 189 m, respectively. The stacks are about 250 m inland from the coast. A scanning lidar system was employed to measure the distribution of fly ash in individual plumes from Stages A and C and thus provided data on plume rise and dispersion both before and after fumigation. Fumigation of the Stage A plume occurred on most days. An instrumented aircraft, and radiosonde and pibal balloons were used to characterise the sea breeze flow and the structure of the TIBL. A network of air quality stations provided surface concentrations of SO2 and other pollutants and surface layer meteorology. An instrumented vehicle was used to measure pollutant concentrations and the ground-level impact of the plumes after fumigation. Sonic anemometers were used to measure the surface heat flux by eddy-correlation measurements. More details on these observations are given later (section 3). Other data components included surface weather maps, and video and still camera photographs.
Figure 3a shows a typical fumigation episode during the study period, as viewed from Woodman Point across the SW plume heading. The plume from Stage A initially is travelling over land in a nearly non-turbulent unmodified onshore flow with little diffusion. Subsequently, the plume is intercepted by the growing turbulent boundary layer (at a location almost in the middle of the photo) and undergoes rapid vertical mixing. An early stage of fumigation of the Stage A plume is shown in Fig.3b as viewed from Alcoa Residue Site.
Figure 3.
Routine meteorological measurements are made at the following air quality monitoring stations within the study area: Hope Valley, Wattleup, Naval Base, Alcoa Mud Lakes, Abercrombie Road, Miguel Road and Henderson Road. The types of measurements vary from station to station and include data on SO2 concentration, wind speed, wind direction and its standard deviation, air temperature, relative humidity, difference of air temperatures measured at two levels, net radiation, rainfall, pressure etc.
Figure 4 presents the temporal variation of hourly averaged wind direction data at the stations on 30 January. The time used here is Western Standard Time (WST). The plot shows the onset of the sea breeze between 1100-1200 h with the wind direction changing roughly from the east to the south-west.
The Flinders University's Cessna C340A VH-EOS research aircraft carried a range of meteorological and chemical analysis instruments. The parameters measured include: wind and turbulence; turbulent fluxes of sensible heat, water vapour, momentum, CO2, O3 and NOx; air temperature; humidity; static and dynamic pressure; surface radiation temperature; global radiation; and CO2, O3, NO, NO2 and NOx concentrations. The aircraft also carried accurate navigation systems enabling these data to be located precisely in space and time.
The aircraft flew in a "racetrack" pattern perpendicular to the coast at about 6-8 fixed altitudes up to the top of the sea breeze (a height of about 800 m). The two straight legs of the circuit were about 3 km apart and have been designated as North Runs and South Runs (see Fig.2a). The whole pattern took about one hour to complete, and typically two patterns were flown on each day of operations. In addition, vertical ascents and descents, and occasional legs parallel to the coast were flown.
Figure 6 shows the South Runs contour plots of potential temperature (°C) and TKE (m2 s-2) for the period 1123-1254 h on 31 January. Negative distances correspond to over-water observations. The TIBL growth over land is distinct in Fig.6a, and is characterised by a near-uniform potential temperature distribution in the vertical. The over-water temperature distribution is also uniform (i.e. neutral stability) in the lowest 200 m; however, Fig.6b suggests that the air there is virtually non-turbulent in contrast to the strong turbulence levels observed within the TIBL. The air at upper levels is strongly stable.
On six of the nine days the aircraft measurements showed that the lower level onshore flow was neutrally stratified, but virtually non-turbulent (as in Fig.6). This was further evidenced by fumigation measurements taken by the lidar and mobile sampler showing a rapid touch-down of the Stage A plume due to a fast growing TIBL in the neutral onshore flow. Such conditions are unusual compared with past observations at Kwinana (e.g. Rayner et al., 1990). They appear to be a result of an upwind history of flow over land.
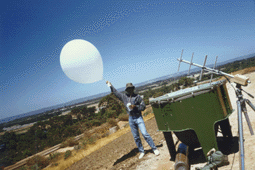
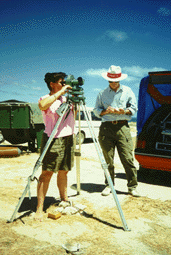
Radiosonde soundings and double theodolite measurements (Fig.7) were taken at two sites; one close to the land-water interface (Sonde-1, Woodman Point Figure.2c) and the other farther inland (Sonde-2, Alcoa Residue Site). The sonde data provided vertical profiles of temperature, humidity, wind speed and wind direction. An additional sounding was carried out daily by DEP at a site close to the land-water interface in Swanbourne, about 27 km north of Woodman Point.
 |
 |
(a) |
(b) |
Figure 7. (a) Launching of radiosonde balloon and (b) its tracking by theodolite |
|
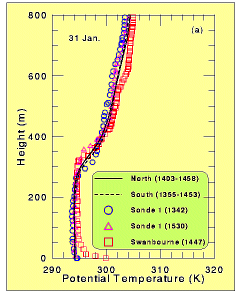
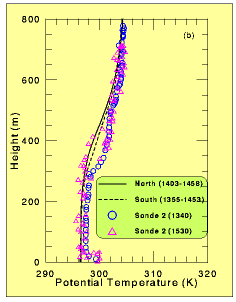
Figure 8a compares sonde potential temperature profiles at the coastline on 31 January at closely matching times with profiles derived from the aircraft North and South Runs. The sonde timings denote the launch times. The profiles corresponding to Alcoa Residue Site are shown in Fig.8b. The aircraft profiles are obtained by 'slicing' the contour plots at distances of 0 and 6 km inland which correspond to the Woodman Point and Alcoa Residue Site locations, respectively. The sonde profiles agree well with those from the aircraft. The Swanbourne sonde data match those from the Woodman Point sonde well. The agreement between North and South aircraft profiles is also very good, suggesting that the boundary layer can be considered two-dimensional over the scales of interest within our study domain. The sonde potential temperature profiles show a super-adiabatic surface layer about 50 m deep below the neutral layer, which is not resolved by the aircraft due to altitude limitations.
 |
 |
(a) |
(b) |
Figure 8. Vertical profile of potential temperature on 31 January obtained at (a) the coastline and (b) Alcoa Residue Site located at a distance of about 6 km inland from the coast. The symbols are the sonde data and the lines represent the aircraft data. |
|
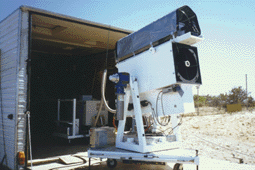
The heart of the lidar system is a Neodymium:YAG laser which fires a pulse of light 6 ns in duration (about 1.8 m long). This pulse is subsequently scattered and absorbed by both air molecules and particles in the atmosphere. A small fraction of the laser beam is scattered back to the lidar, collected by a telescope and detected by a photomultiplier tube. The intensity of the signal as a function of time is a measure of the particle concentration as a function of distance along the line of the laser shot. To obtain good signal strength and discrimination between the plumes, each of the plumes could be loaded with extra fly ash at any given time by turning off some stages of the electrostatic precipitators.
 |
 |
(a) |
(b) |
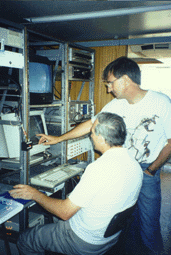
Figure 9. (a) The CAR lidar used during the Study and (b) the lidar control room. |
|
A number of vertical scans (i.e. cross-sections) of the plume was sampled by firing a series of shots through the plume at fixed azimuth and varying elevation (at approximately 0.2° increments). Up to 10 fixed azimuths were chosen to cover the plume from near the stack to about 5 km downwind (Fig.2a). The whole operation of the lidar, from aiming and firing the laser to storing the digitised data, was controlled by a PC (Fig.9b). Fig. 10 shows a typical plume scan taken on 30 January in the fumigation zone; regions of high aerosol concentration (including the plumes of interest) appear through colour enhancing against the white or yellow background. In this particular scan three distinct plumes are visible: the strongest image is of Stage A for which the electrostatic precipitators were turned off at the time of the scan; the weaker image above this is the Stage C plume which is detected by the lidar even though it was operating normally; and the low level plume is from the calciners of Alcoa Alumina Refinery. The shearing of the Stage A plume cross-section is typical and is attributed to a vertical gradient in wind direction within the TIBL.
From each plume scan the centre of mass, the standard deviations in the lateral and vertical, the upper and lower extremities of the plume, and the projection onto the ground of the location of the centre of mass of the plume were calculated. The plume from the taller stack, Stage C, generally remained above the TIBL over the range of observations, while that from Stage A fumigated regularly within 2-3 km from the stack. This can be observed from Fig.11 which shows instantaneous plume lateral spread sy as a function of downwind distance from the stack on 31 January. The initial diffusion is the same for both plumes but subsequently the Stage A plume fumigates causing enhanced spread due to convective turbulence.
Figure 12 shows the projection onto the ground of the location of the centre of mass of the plume for Stage A and Stage C on 31 January. Open circles indicate that no part of the plume reaches the ground for that scan, while filled circles indicate that the plume touches down (but not necessarily at the location of the centre of mass). These plots give a very clear indication of the mean direction of the plume and of the downwind distance at which the plume impacts the ground. The difference between the behaviour of the Stage A and Stage C plumes is again distinct.
The DCET vehicle contained instrumentation to measure a number of chemical species including NO, NOx, SO2, CO, CO2, hydrocarbons, total sulfur and airborne particles. The vehicle had an accurate GPS navigation system and operated mainly in the region around and to the north of Wattleup (Fig.2a). Many individual transects were made, logging data once per second.
A typical variation of concentration with time along a transect shows a clear peak, and is fairly smooth. Some plots show two peaks of similar magnitude, perhaps indicating separate contributions from multiple sources. An approximate method was used to determine hourly SO2 averages from the instantaneous levels using the lidar observations. It was found that the mobile sampler SO2 levels generally agreed with the data from the nearby air quality stations but differences in sampling methods produced some discrepancies.
Flue gas characteristics of the KPS stacks derived from process parameters were provided by Western Power. These data included half-hourly SO2 emission rates and volume flow rates.
Eddy correlation heat flux measurements were made at Hope Valley and Wattleup air quality stations. A typical value of the maximum surface sensible heat flux at Hope Valley was 420 W m-2 occurring at about noon. Heat flux values are required when parameterising the TIBL height as well for testing surface energy balance models.
A wide range of plume dispersion calculations was performed to assess the performance of various modifications made to DISPMOD against observations. Full details have been given in the final report on the study by Sawford et al. (1996). Here we present only representative model results.
The lidar mean plume height observations were used to prescribe a parabolic TIBL height variation because the existing parameterisation used in DISPMOD is not applicable under neutral onshore flow conditions as observed on most days of the study. Other input meteorological data required in the model were obtained from the measurements made at the Hope Valley air quality station. The modelling included emissions from both KPS stacks as well as from other significant SO2 sources in the area.
A typical model contour plot of the ground-level SO2 concentrations is shown in Fig.13 for 31 January. The data from the monitoring stations and those from the mobile sampler have also been posted on the plot. The mean wind direction used in the calculations was 219o and was obtained from the aircraft and radiosonde data. It can be seen in Fig.13 that the model predictions are consistent with the observed concentrations. The slight underprediction by DISPMOD at Wattleup can be partly explained by the parabolic TIBL approximation used. A more realistic TIBL formulation under present conditions would involve a more rapid boundary layer growth close to the coast where the boundary layer grows into the neutral onshore flow followed by a much slower rise further inland where the boundary encounters the stable stratification aloft. This would cause the fumigation point north-east of Wattleup in Fig.13 to move closer to the shoreline, leading to a higher predicted concentration at this location.
The overall modelling exercise indicated that although the predicted concentrations were of the same order as the observed ones, a point-by-point comparison of concentration levels would improve if the observed change in wind direction with height (i.e., wind shear) were accounted for in the model. The effect of wind shear is apparent in the lidar plume cross-sections (see Fig.10) as a clear tendency for the lower parts of the plume to be further from the lidar than the upper parts. The inclusion of wind shear in a model causes a larger horizontal plume spread and hence, in that case, the concentration contours in Fig.13 would be more spread out with slightly smaller values. Analytical models such as DISPMOD, however, cannot incorporate this shear.
The assumption of uniform vertical mixing used in DISPMOD is not physically realistic especially when the entrainment rate, defined as the boundary layer growth rate at the plume-TIBL interface, is large (as was the case during the present study). The improved probability density function (PDF) model developed by Luhar and Sawford(1996) was incorporated as an option in the DISPMOD code. This model, which accounts for the non-uniform mixing, was verified by Hibberd and Luhar (1996) against laboratory fumigation data.
Figure 14 compares the concentration contours obtained using DISPMOD and the PDF model. The contours indicate that, on average, the maximum concentrations computed from the PDF model in the region north-east of Wattleup are 30% higher than those obtained from DISPMOD. However, other spatial concentration features predicted by the two models are very similar.
During the Kwinana Coastal Fumigation Study, sea breeze flows and fumigation of plumes from the Kwinana Power Station (KPS) were studied using an instrumented aircraft, radiosonde balloons, air quality network stations, a lidar, a mobile surface sampler, and sonic anemometers. The aim of the study was to assess, validate and improve several parameterisations of the processes influencing fumigation which are used in DISPMOD. The study yielded a detailed data set as a result of both the range of observations undertaken and of the regularity of the sea breeze conditions under scrutiny. The observations showed that on most days the onshore flow in lower levels was neutrally stratified but essentially non-turbulent.
Most of the parameterisation schemes in DISPMOD have been tested using the data obtained from the Study and in many cases improvements have been coded and implemented. A wide range of plume dispersion calculations was performed to assess the performance of various modifications to the model against observed ground level concentration data. Results from model testing are given in the final report on the study by Sawford et al. (1996). Typical DISPMOD dispersion results showed that the model generally reproduces the magnitudes of the observed concentrations but the location of the modelled concentration field tends to be displaced relative to the observed field both laterally and in the streamwise direction. The lateral displacement is due to the inability of the model to represent the observed wind shear while the streamwise displacement is probably due to the poorly modelled TIBL height. It was also found that the uniform mixing assumption in DISPMOD is not satisfactory and a more realistic PDF model was incorporated as an option in the code. All observed and modelled concentrations comfortably met the air quality standard for Kwinana. The results presented here and in the final report are by no means exhaustive. The data set provides a basis for a more thorough investigation of the properties of fumigation in the Kwinana region for future improvements in understanding and modelling of this process. We are currently working on developing improved TIBL height parameterisation schemes and including the effects of wind shear in fumigation models.
Comments made by Dr. Peter Manins on this paper are gratefully acknowledged. Thanks are also due to Julie Penn for her help in formatting the paper for the WWW.
Sawford B. L., Young S. A., Noonan J. A., Luhar A. K., Hacker J. M., Carras J. N., Williams D. J., Rayner K. N. (1996) The 1995 Kwinana Fumigation Study-I: Program Overview, Experimental Design and Some Results. Preprints, 13th International Clean Air and Environment Conference, Adelaide, p. 451-456.
Luhar A. K., Yoon I.-H., Young S. A., Sawford B. L. (1996) The 1995 Kwinana Fumigation Study-II: Plume Dispersion and Model Simulations. Preprints, 13th International Clean Air and Environment Conference, Adelaide, p. 457-462.
Yoon I.-H., Sawford B. L., Luhar A. K., Manins P. C. (1996) Lidar observations of smoke plumes dispersion in the thermal internal boundary layer. Preprints, 2nd International Joint Seminar on the Regional Deposition Processes in the Atmosphere, Beijing, p. 123-132.
Hibberd M. F. and Luhar A. K. (1996) A laboratory study and improved PDF model of fumigation into a growing convective boundary layer. Atmospheric Environment 30, 3633-3649.
Luhar A. K. and Sawford B. L. (1996) An examination of existing shoreline fumigation models and formulation of an improved model. Atmospheric Environment 30, 609-620.
Paparo V. (1982) The Kwinana Air Modelling Study. Department of Conservation and Environment, Perth, Western Australia, Report 10, 96pp.
Rayner K. N. (1987) Dispersion of Atmospheric Pollutants from Point Sources in a Coastal Environment. Ph.D. thesis. Murdoch University, Australia, 249pp.
Rayner K. N., Bell B. P. and Watson I. D. (1990) Coastal internal boundary layers and chimney plume dispersion. Preprints, International Clean Air Conference, Clean Air Society of Australia and New Zealand, Auckland, pp. 151-158.
Sawford B. L., Luhar A. K., Noonan J. A., Yoon I.-H., Young S. A., Physick W.L., Patterson G. R., Hacker J. M., Carras J. N., Williams D. J., Blockley A. (1996) Shoreline Fumigation at Kwinana: A Study to Assess, Validate and Improve DISPMOD. Final report SB/1/227, CSIRO Division of Atmospheric Research, Aspendale, Australia, 323pp.
![]()

Modified: April 3, 2008