AirWatch – The CSIRO toolkit
by P.C. Manins1, M.L. Finn1
and Jennifer Anderton2
1CSIRO Atmospheric Research, Aspendale 3195
Australia
2Department of Environmental Protection, Perth
Western Australia
Contents
Summary
Introduction
Topics covered by the kit
Measuring dispersion of pollutants
Identifying sources of pollutants
Discussions and conclusions
References
SUMMARY
Airwatch is a schools and community program of hands-on
learning and investigations of air pollution issues. The CSIRO kit is
a contribution of interesting and meaningful experiments that include
inexpensive methods for the measurement of airborne particles, nitrogen
dioxide in air, wind information at ground level and to several hundred
metres above the surface, and use of odours and the wind information to
identify pollution sources.
INTRODUCTION
Schools and community groups across Australia are participating in the
Airwatch project. Airwatch was inspired by the WaterWatch program being
undertaken across Australia (see Australian Nature Conservation Agency,
1997; Waterwatch Victoria, 1996). AIRWATCH is a fully structured program,
addressing the issues of air quality both locally and globally. It consists
of
- the CSIRO kit discussed here
- considerable curriculum/resource materials addressing all aspects of air pollution
- in-service training and support to participating schools and other groups
- involvement of several agencies including EPAs and Roads agencies.
Airwatch and the CSIRO kit (Finn and Manins, 1995) were launched in Australia
in early 1996. While focussed primarily on secondary school science and
geography students, Airwatch has also excited interest with community
groups such as Smogbusters. This group is a national EPA-funded
community awareness-raising program focussed on pollution from motor vehicles
and the promotion of the use of public transport in the major cities.
Airwatch aspires to become an Australia-wide information-sharing network
for monitoring data, resources for air quality issues, and to be a contact
point for low-cost air pollution methods and results. While the worldwide
GLOBE program (Global Learning Observations to Benefit the Environment
— see ERINYES, 1995; Environment Australia, 1998; NOAA Forecast Systems
Laboratory, 1998) has similar aims, it is focussed on continual monitoring.
This does not suit some teachers and students who are involved in no more
than semester-length projects, as well as for many community groups who
tend to have issues-based concerns. Nor does GLOBE include the kinds of
measurements in the CSIRO kit.
TOPICS COVERED BY THE KIT
The kit described here proves that some important measurements related
to air quality can be made at low cost by just about anybody, but that
there are many desirable air pollution measurements that do not yet appear
possible without specialist equipment. To be included, candidate kit components
had to meet four criteria:
-
it must address an important aspect of air pollution of relevance to the community;
-
it must be fun to do, by an individual or small team;
-
the method must be capable of giving good results if reasonable care is exercised;
-
the data obtained must be useful - to concerned individuals, environment
protection agencies or to other researchers of air quality issues.
Many candidate project components were considered; most were rejected
for various reasons. Six survived, grouped into three major topics:
-
Measurement of ambient air pollutants, with emphasis on the most
important urban pollutant in Australia-airborne particulate matter
-
Measurement of meteorological factors that control mixing and transport
of pollutants
-
Identification of sources of pollutants in the region of concern.
Figure 1 shows the components of the kit and their relationships.
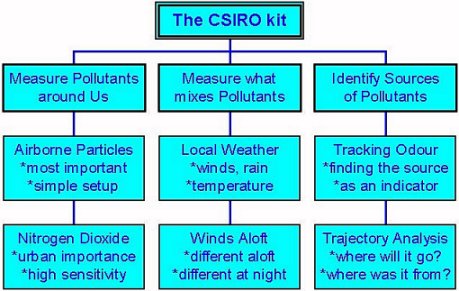
Figure 1. Structure of the CSIRO kit for Airwatch
MEASURING POLLUTANTS
Airborne Particulate Matter
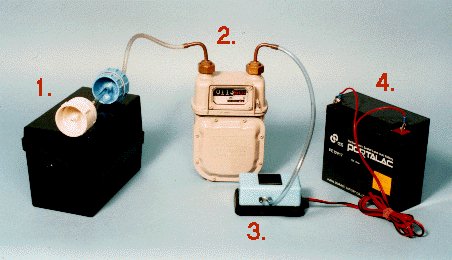
Figure 2. Particle and NO2 sampling equipment for Airwatch
1. a plain filter holder followed by a treated filter holder; 2. a small
gas flow meter; 3. a 12 volt fish tank pump; 4. deep-discharge battery.
Most time has been spent on this component in the belief that it is the
most valuable contribution the kit can make. Aerosol is collected over
24 hours onto a fibreglass filter paper using a domestic fish-tank pump.
Assuming that the visible aerosol on the filter is soot (carbon), the
user can compare the 'greyness' of the filter against a calibrated precision
'grey scale' printed sheet to give the mass of soot on the filter. The
volume of air that has been pumped through the filter paper is measured
using a small gas flow meter. So the density of the soot in the air can
be computed. With some knowledge of the general air pollution conditions,
the user can scale the soot concentration to estimate the concentration
of fine particulate matter in the air. It is this that can be compared
with air quality standards. The equipment is shown in Figure 2 set up
to also measure nitrogen dioxide (see below).
The vital aspect that obviates the need for a micro-balance to weigh
the filter paper after sampling for a specified time is the use of the
calibrated grey scale, shown in the top half of Figure 3. (The bottom
half is the calibration scale for nitrogen dioxide measurement —
see below.) The chart consists of a printed set of colours matched to
dual fibreglass and polycarbonate filters that have been equally soiled
by exposure to a source of soot for different periods. The latter filters
have been carefully dried, and then accurately weighed. The result is
a relationship between greyness and mass of carbon on the filter. Assuming
that the colour of the filter really is due to elemental carbon particles,
the expected accuracy is around ± 30 % or better of reading. This
is quite adequate for the expected applications.
Figure 3. Airwatch calibration charts and graphs for particle and nitrogen dioxide sampling.
A soiled filter is held behind the sheet and observed through the circular holes
(black in the Figure) to find a match. The match number is used to read off the mass of
soot (in µg) on the filter from the graph. Similarly, a vial of treated extract from the filter
used for nitrogen dioxide sampling is colour matched by holding it in front of the shaded
bars (pink) along the lower half of the Figure and the match number is used to read off the
mass of nitrogen dioxide (in µMoles) from the graph.
Click here to see a larger version of this Figure
There is no simple relationship between the ambient soot concentration
and the concentration of all fine particles in the air. The realisation
of this is the major reason the filter soiling technique for measurement
of particle concentrations has been abandoned by EPAs in many European
countries. However, some approximate relationships for Australian cities
have been determined. The relationships depend on the general weather
conditions and the prevalence of domestic wood heating and other factors.
They are given in a companion paper (Manins and Finn 1998a). More details
of the equipment needed for particle sampling and its use are also presented
there.
While a sampling time of 24 hours is needed to collect a visibly discernible
sample in Australian urban areas, sampling strategies are not restricted
to a continual day-long sampling period. Community groups have been exploring
running the sampler each morning during peak hour traffic time at the
roadside over a week until a large enough sample is collected. Others
have carried the whole setup on a bicycle on the trip to work over a week
to determine on-road exposure to particles. Any variation that permits
an adequate sample to be collected can be employed since the device measures
the actual flow of air through the filter. The result is then the average
over the period(s) sampled.
Some users have found in several instances that practically no filter
soiling could be measured. This ought to have been very informative in
correcting false impressions about the general air quality in most localities
of Australia, and also about the role that weather conditions play in
particulate air pollution. The need for in-service training for teachers
and on-going support for community groups is also highlighted.
Nitrogen Dioxide Measurements
A second filter holder loaded with a paper treated to react with NO2
can be added downstream of the particle filter (see Figure 2). The result
is a very sensitive monitor for this combustion-derived urban air pollutant.
The filter is coated with a NaI-NaOH solution that is easily made in a
school chemistry laboratory. When the coating is exposed to NO2 it converts
to NaNO2. Back in the laboratory, the NaNO2 is extracted and treated with
chemicals that result in a pink-coloured solution. Comparison of the 'pinkness'
of the solution with the calibrated 'pink scale' as shown in Figure 3,
can then be made. The method is well proven and is the basis of a passive
gas measuring method for NO2 that CSIRO has been using for several years.
Further details are given in a companion paper (Manins and Finn 1998b).
The equipment needed for nitrogen dioxide sampling and its use are also
presented there.
Since the method is very sensitive, sampling times can be as short as
an hour or two if the ambient NO2 concentrations are around 20 ppbv or
more. Again, sampling strategies can be devised to give the data that
the user is most interested in. However, the need for access to a chemical
laboratory and high-purity water is a deterrent in making these measurements.
MEASURING DISPERSION OF POLLUTANTS
Interpretation of air pollution conditions requires information on the
winds and mixing in the atmosphere. A commercial weather station is recommended
for the task due to its value for money and its use in some schools. It
is the Weather Monitor II and Weather-link software from Davis Instruments,
Hayward CA, USA. It is a comprehensive weather station, data management,
analysis and display system. It is much more expensive than any other
component of the kit.
The weather station sensors measure wind speed, wind direction, station
temperature and humidity, ambient temperature, ambient pressure, and rainfall.
It is powered by a supplied mains power pack, a small 9 volt battery,
or the battery that is part of the pollution sampling kit. It also includes
a data logger that can store several days or even weeks of data (depending
on sampling interval) and a simple remote display and control panel. A
PC can be used to give an attractive real-time display, to unload the
data from the logger for later analysis, and for graphing the results
of the sampling.
Particularly at night in clear conditions, the winds at the height of
industrial sources of pollution can be very different to the wind conditions
measured at the ground. The winds also vary greatly aloft in valleys and
mountainous regions (katabatic, anabatic, mountain and valley winds) and
near the coast during sea breezes. It is important to know something about
winds aloft for characterising the air pollution potential of a region.
Surveys of the winds in the lowest 100-500 m above the ground are usually
important. The CSIRO kit includes an elementary tethered balloon system
as described by Moriarty (1992a, 1992b). Moriarty employed the methodology
in several places in southeast Australia with considerable success. It
is only useable in light winds. The computer program for the analysis
is available from the CSIRO web site for Airwatch.
The system is little more than a helium-filled balloon, a calibrated
fishing line, and a garden hose reel; a simple sighting tube acts as a
theodolite. Figure 4 shows the balloon being launched and also how the
elevation angle of the balloon can be measured. Recording the elevation
and azimuth angles as the balloon line is played out allows a calculation
of the wind speed and direction as a function of balloon height. Moriarty's
algorithms have been coded for the kit.
Experience in schools has shown that the logistics of organising an excursion
a week in advance, a clear field, and the weather all at the same time,
make this a difficult exercise to implement. Even so, the system is very
informative and worth the effort for specific problems: such as the study
of light winds over a hill in the evening, or in a small valley overnight
with clear skies.
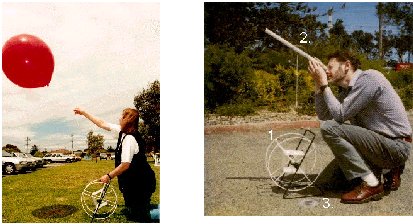
Figure 4. Launching the tethered (left) and sighting (right)
the balloon.
1. hose reel and line; 2. elevation sighting, protractor and plumb bob;
3. azimuth protractor and compass
IDENTIFYING SOURCES OF POLLUTANTS
Odours can be used to map sources of pollution in the community. Whether
the source of an odour is know or not, the present procedure can be used
to discover or confirm the source. The method is very simple but powerful:
collect, over a number of days or weeks, the locations of observations
of a recognisable odour and at the same time, the wind direction. Combine
this information on a map to pinpoint the source of the odour by triangulation.
Figure 5 shows an example of how to determine the source of an odour
from wind direction observations at locations A to D, when a particular
odour is sensed at these places.
A forward trajectory is a line on a map describing the movement of an
air parcel with time from the monitoring location. It tells the user where
the air parcel is going. A backward trajectory shows where the parcel
has come from. This is useful and is often used by EPA complaints investigators.
The wind data measured with the commercial weather monitoring station
can be used to give a good first estimate of an air parcel trajectory.
A special computer program is included in the CSIRO kit to calculate the
forward and backward trajectories and display them on a PC screen. It
is available on the CSIRO web site for Airwatch. The trajectory program
takes as input, a sequence of wind speed and direction data exported as
a textfile from the weather station logger. Any other data source can
be used.
Figure 5. Measurements of wind direction when the same odour
is smelt under different conditions at locations A, B, C and D allow identification
of the source at S.
Figure 6. A screen dump from the trajectory program. The heavy,
near-vertical line marks the coast: the Indian Ocean is to the west. The
numbers on the trajectory show time of day for a parcel released at 1500
hours from Caversham on Day 1 of the data set.
A picture of the screen is shown as Figure 6. It is from a study at Caversham
monitoring station in eastern Perth, Western Australia. The outline of
the coast is shown, as are Rottnest Island, the Swan River, and the Perth
centre. Wind data from a record over two days are plotted in Figure 6,
centred on Caversham at 1500 hr on the first day. The trajectory makes
two loops as the wind changes from easterlies to a sea breeze and back.
It shows that pollutants can return to Perth a day after they are emitted.
Despite the best of efforts, the instructions for adapting the data files
for the trajectory mapping to a new locality proves too difficult for
some teachers. Again, in-service training can correct this problem.
DISCUSSION AND CONCLUSIONS
The methods employed in the CSIRO kit are simplified compared with EPA
practices. The resulting data are thus not necessarily the most relevant
for modern air pollution assessment procedures. For example, EPAs generally
want time series of pollutant gas data, not the spot measurements that
the kit can provide. Nevertheless, the interest shown by both lay people
and scientists indicates that this set of equipment and experiments meets
a strong need.
In-service training and ongoing support are essential components of Airwatch
that will assure success in the longer term as it expands both in reach
and in the range of components that can be measured.
REFERENCES
Australian Nature Conservation Agency (1997), ‘Waterwatch Australia’.
Environment Australia (1998), ‘The GLOBE Program’. See: World
Wide Web address
ERINYES (1995), ‘GLOBE: Global Learning & Observations to Benefit
the Environment’. Issue No.24 August 1995. Department of Environment
Sport and Territories, Australia.
Finn, M.L., Manins, P.C. (1995), ‘AIRWATCH - The CSIRO Kit’,
CSIRO Atmospheric Research, Version 1.0k December, 51 pp
Manins, P.C. and Finn, M.L. (1998a), ‘AIRWATCH – Particle Sampling’,
this publication.
Manins, P.C. and Finn, M.L. (1998b), ‘AIRWATCH – Nitrogen Dioxide
Sampling’, this publication.
Moriarty, W.W. (1992a), ‘Tether corrections for tethered balloon
wind measurements’, Boundary-layer Meteorol., 61, 407-417
Moriarty, W.W. (1992b), ‘An improved calibration for tethered balloon
wind measurements’, Boundary-layer Meteorol., 63, 183-196.
NOAA Forecast Systems Laboratory (1998), ‘The GLOBE Program’.
Boulder CO USA. See: World Wide Web address http://globe.fsl.noaa.gov/welcome.html
Waterwatch Victoria (1996), See: World Wide Web address http://www.netc.net.au/Water/Waterwatch.html
Return to AirWatch Index page
Contact: peter.manins@csiro.au
| 