The greenhouse effect
|
| Carbon dioxide | Methane | Nitrous oxide | CFC-11 | |
| Current concentration | 370 ppmv | 1720 ppbv | 312 ppbv | 260 pptv |
| Pre-industrial concentration (~1700s) | 288 ppmv | 850 ppbv | 285 ppbv | 0 |
| Annual rate of increase | 0.4% | 0.6% | 0.25% | 0* |
| Atmospheric lifetime | 50-200 years | 12 years | 120 years | 50 years |
Most of the increase in carbon dioxide comes from burning of fossil fuels such as oil, coal and natural gas, and from deforestation.
Currently, about 7 billion tonnes of carbon (as carbon dioxide) are emitted each year during the combustion of fossil fuels and 1-2 billion tonnes per year from land clearing.
In Australia, annual carbon dioxide production per person is about 16 tonnes.
| Carbon dioxide concentrations measured at the Cape Grim Baseline Air Pollution Station in north-western Tasmania. |  |
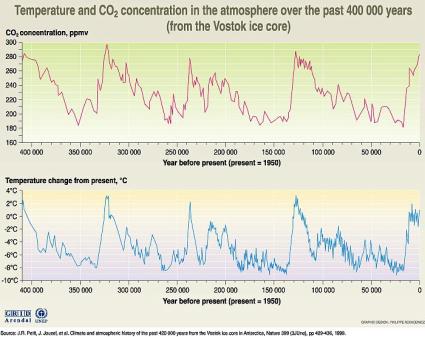
Scientists study the composition of air in the past by examining air trapped in Antarctic ice.
Analysis of these bubbles shows that carbon dioxide concentrations are now higher than at any time in the past 420,000 years. In fact, it is likely that the concentration today is higher than it has been for 20 million years. The current rate of increase of carbon dioxide is greater than at any time in the past 20,000 years.
Scientists can infer from the ice records past temperatures of the atmosphere. There is a close relationship between atmospheric carbon dioxide concentrations and world temperatures. Periods of high global surface temperature have occurred when carbon dioxide concentrations have been high.
| Fluctuating carbon dioxide concentrations during the past thousand years, from measurements of air trapped in Antarctic ice (supplied by the Australian Antarctic Division) and, since the late 1970s, from analysis by the Cape Grim Baseline Air Pollution Station in Tasmania. | 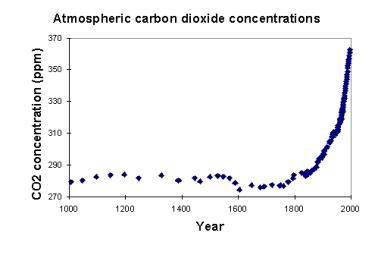 |
|
|
Variations in atmospheric carbon dioxide concentration
and temperature during the past 400,000 years. (Reproduced from Nature) |
Methane forms when organic (carbon containing) material is broken down in the absence of oxygen. Ruminant animals such as cows and sheep rely on bacteria to decompose the cellulose they eat. These bacteria generate methane. Bacteria also play a role in releasing methane from rice paddies. Other sources of methane are land fills, burning vegetation, coal mines and natural gas fields.
The concentration of atmospheric methane continues to rise, with levels today greater than at any time during the past 420,000 years. The growth rate of methane slowed and was more variable in the 1990s than in the 1980s. Slightly more than half of methane emissions come from human sources, such as those listed above.
Most atmospheric methane is eventually converted into carbon dioxide.
| Methane concentrations measured at the Cape Grim Baseline Air Pollution Station. |  |
Nitrous oxide concentrations are increasing because of land-use changes, biomass burning, fertiliser use and some industrial processes.
Nitrous oxide is an important greenhouse gas, as it does not easily break down. It has an atmospheric lifetime of more than a century. Present concentrations of the gas have not been exceeded for at least the past 1000 years.
Approximately one-third of nitrous oxide emissions are from human sources. Oceans and soils are natural sources of nitrous oxide.
| Nitrous oxide concentrations measured at the Cape Grim Baseline Air Pollution Station. |  |
Chlorofluorocarbons are all industrially-produced chemicals. They do not occur naturally. Chlorofluorocarbons were first used in the 1920s as coolants for refrigerators. Since then they have been used in air-conditioners, as propellants in aerosol cans (before 1990 in Australia), to make the bubbles in plastic foams and as solvents. CFCs are very stable and last for about 50 years in the atmosphere.
As well as being greenhouse gases in the lower atmosphere, once in the stratosphere, CFCs damage the ozone layer.
Thanks to the Montreal Protocol, CFC production in developed countries has ceased and atmospheric concentrations of many CFCs are now falling.
The warming effect of CFCs is offset by the fact that they destroy ozone, also a greenhouse gas, in the lower stratosphere.
| CFC-11 concentrations measured at the Cape Grim Baseline Air Pollution Station. |  |
Ozone is a component of photochemical smog, which is a problem in many cities. In the lower atmosphere (the troposphere), ozone is a powerful greenhouse gas.
There is strong evidence that ozone concentrations in the lower atmosphere are higher than in pre-industrial times, especially in the northern hemisphere.
Aerosol are fine particles and droplets suspended in air. Fossil fuel and biomass burning add to levels of aerosol in the atmosphere.
Aerosol predominantly have a cooling effect on climate by reflecting some of the incoming sunlight and through their influence on cloud properties — they facilitate the process by which water vapour turns into cloud droplets.
Scientists are using sophisticated computer models of the world's atmosphere, land and oceans to examine likely future changes to climate due to the enhanced greenhouse effect.
The models show that increasing levels of greenhouse gases will produce a warming at the earth’s surface and that the enhanced greenhouse effect is likely to lead to world-wide changes in weather and climate. Some places may get more rain and storms while others may get less. Not all changes will be bad for everybody. However, almost everywhere the weather and climate will be different from what it used to be.
Climate models show that land will warm more than the sea. The daily temperature range over land is likely to decrease. The greatest warming is expected to occur in the sub-polar regions of the northern hemisphere during winter.
Global warming is likely to lead to greater extremes of drying and heavy rainfall. It is also likely to increase the risk of droughts and floods.
During the 20th century, the world’s average surface temperature increased by about 0.6°C. According to the Intergovernmental Panel on Climate Change (IPCC), most of the warming that has occurred during the past 50 years is due to human activities.
By the end of the 21st century, average world temperatures are likely to be between 1.4°C and 5.8°C higher than they were in 1990.
This projected rate of warming is much larger than the observed changes during the 20th century and is very likely to be without precedent during at least the past 10,000 years.
Warming of the earth's atmosphere will lead to warming of the upper layers of the oceans. Like most substances, water expands when heated. Expansion will raise sea level. Land-based ice in the temperate regions of the world (such as South and North America and Greenland) will melt more rapidly, adding to increased sea level. (Floating sea ice does not change the sea level when it melts.)
On the other hand, increased precipitation over Antarctica and Greenland could lock water away in the ice caps, ultimately reducing the extent of sea-level rise.
During the 20th century, global sea level rose by between 10 and 20 cm. Sea level is projected to rise by between 9 and 88 cm between 1990 and 2100.
In 2001, CSIRO Atmospheric Research released projections describing likely changes to Australia’s climate.
Australia will be hotter and drier. Over most of the continent, annual average temperatures will be 0.4 to 2°C greater than 1990 by 2030. By 2070, average temperatures are likely to increase by 1 to 6°C.
Most parts of Australia will experience more frequent, or heavier, downpours.
In places where average rainfall increases, there will be more extremely wet years. Conversely, there will be more droughts in regions where average rainfall decreases.
The warming will not be uniform. There will be slightly less warming in some coastal areas and Tasmania, and slightly more warming in the north-west.
Warmer conditions will produce more extremely hot days and fewer cold days. For example, the average number of days over 35°C each summer in Melbourne are likely to increase from 8 at present to 10-20 by 2070. The average number of winter days below 0°C in Canberra is likely to drop from 44 at present to 6-38 by 2070.
South-western Australia can expect decreases in rainfall, as can parts of south-eastern Australia and Queensland. Decreases will be most pronounced in winter and spring.
There are also likely to be more intense tropical cyclones, leading to an increase in the number of severe oceanic storm surges in the north.
Evaporation will increase over most of the country, adding to moisture stress on plants, and to drought.
Paul Holper
June 2001
![]()

Modified: April 3, 2008