Survey details and related metadata, reports, events and data.
SS 01/92 (alternative identifier: SS199201)
Period: 1992-02-04 00:00 to 1992-02-25 00:00 UTC
Duration: 21.00 days
From: Hobart To: Hobart
Region: S Tasmanian waters
Ship: Southern Surveyor [details]
Description: Southern Surveyor cruise SS 01/92 was undertaken to conduct the first acoustic survey of orange roughy (Hoplostethus atlanticus) and deepwater oreos, smooth oreo (Pseudocyttus maculatus) and black oreo (Allocyttus niger), on the major deepwater fishing ground off southern Tasmania (leg 1), and then to form the second in a series of four cruises to examine the mid-slope productivity of this area (leg 2). Target strength (TS) measurements, zooplankton, midwater and demersal sampling, pigment analysis, and measurements of primary production and hydrology were taken.
Leader: J.A. Koslow (CSIRO)
Project: Trophodynamics of the south-east trawl deep-water stock (FIRDC project no. 91/17) 1991-1995 [details]
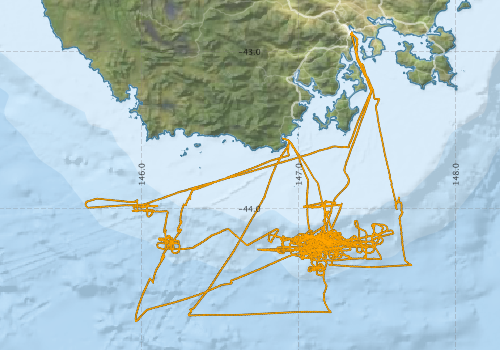
Voyage extents: 44° 25.7' S to 42° 31.4' S 145° 23.2' E to 147° 25.9' E Get voyage track shapefile Get CSV
Marlin Metadata:-
Metadata from OBIS Australia datasets:- biological data is published via the OBIS-AU IPT server and delivered to one or more of OBIS, ALA and GBIF
Download from OBIS Australia IPT View at - Ocean Biodiversity Information System (OBIS) Atlas of Living Australia (ALA) GBIF
Participants - on ship:-
| Name | Role | Organisation |
|---|---|---|
| Alan Williams | CSIRO Division of Fisheries | |
| Don McKenzie | CSIRO Division of Fisheries | |
| Gwen Fenton | Antarctic Cooperative Research Centre | |
| Iain Suthers | University of New South Wales - Centre for Marine Science | |
| Jeff Cordell | CSIRO Division of Fisheries | |
| John Parslow | CSIRO Division of Fisheries | |
| Lesley Clementson | CSIRO Division of Fisheries | |
| M O'Donohue | CSIRO Division of Fisheries | |
| Mark Lewis | CSIRO Division of Fisheries | |
| Matt Sherlock | CSIRO Division of Fisheries | |
| Pru Bonham | CSIRO Division of Fisheries | |
| R Griffiths | CSIRO Division of Fisheries | |
| Ron Plaschke | CSIRO Division of Fisheries | |
| Rudy Kloser | CSIRO Division of Fisheries | |
| T Koslow | CSIRO Division of Fisheries |
This list includes those that may have only been on part of the voyage. See voyage reports on 'Reports and Maps' tab for details.
Marine National Facility Reports - plans, summaries and data processing
-
SS199201 Voyage Summary
- includes preliminary results, voyage narrative, types of data collected with C77/ROSCOP codes.
-
SS199201 Voyage Plan
- includes objectives, investigator details, proposed data collection, voyage track and equipment to be used.
-

Publications, reports and datasets from this voyage.
DwC Archive
- Australian National Fish Collection (ANFC) (Darwin Core Archive) External link to reference
Journal Article
- Bradford, R. W.,Griffin, D.,Bruce, B. D. (2015) Estimating the duration of the pelagic phyllosoma phase of the southern rock lobster, Jasus edwardsii (Hutton). Marine and Freshwater Research 66 pp213-. 10.1071/MF14065
- Williams, A., Koslow, J. A. (1997) Species composition, biomass and vertical distribution of micronekton over the mid-slope region off southern Tasmania, Australia. Marine Biology 130 pp259-276. 10.1007/s002270050246
Report
- Sutton, Caroline; Kloser, Rudy; Gershwin, Lisa. Micronekton in southern Australia and the Southern Ocean:
A collation of the biomass, abundance, diversity and distribution data from CSIRO’s historical mesopelagic depth stratified net samples.. Hobart: CSIRO; 2018. http://hdl.handle.net/102.100.100/365479?index=1
Search for publications, reports and datasets from this and other voyages
Data publishing
This is a list of online datasets hosted by CSIRO. Other processed datasets hosted by collaborating organisations may be found on the 'Metadata' or "Reports, Publications and Maps' tab.
Use the Get data link on the right to extract data using the NCMI Data Trawler.
| Data Stream | Data Summary | Get data | ||||||||||||
|---|---|---|---|---|---|---|---|---|---|---|---|---|---|---|
| Marine biodiversity observations and/or samples |
|
Get Data from Trawler |
||||||||||||
| CTD profile |
|
Get Data from Trawler |
||||||||||||
| Hydrology |
|
Get Data from Trawler |
||||||||||||
| Underway |
|
Get Data from Trawler |
Deployments by start time:- Click on column header to sort. Use link on 'Deployment' to see full details. Use the CSV button at the bottom to export data (tab delimited).
Search for deployments from this voyage and others
| Deployment | Operation | Station | Cast | Gear | Project | Start and end times | Start Location | End Location | Depth range | Max Depth | Description | |||
|---|---|---|---|---|---|---|---|---|---|---|---|---|---|---|
| Underway System [details] | Doppler speed log,Licor-UWQ 3708,RM Young 05103 wind monitor,RM Young 05103 wind monitor,Simrad EK500 echosounder,Sperry gyrocompass,Temperature sensor-41342,ThermoSalinoGraph (TSG)-SS-SN 1777,ThermoSalinoGraph (TSG)-SS-SN 1777 | 202 | 1992-02-02 03:39 | 1992-02-24 19:48 | -42.5325 | 147.2026 | -43.5800 | 147.1656 | ||||||
| Hydrology Cast [details] | 1 | 202 | 1992-02-14 18:40 | 1992-02-14 00:00 | -44.3125 | 147.0177 | -44.3085 | 147.0125 | 839 | |||||
| CTD Cast / Hydrology [details] | 1 | Cast 2 | CTD 3,Conductivity CTD 3,Pressure CTD 3,Temperature CTD 3 | 202 | 1992-02-15 02:53 | 1992-02-15 04:12 | -44.2118 | 147.0010 | -44.2127 | 146.9933 | 998 | |||
| CTD Cast / Hydrology [details] | 1 | Cast 3 | CTD 3,Conductivity CTD 3,Pressure CTD 3,Temperature CTD 3 | 202 | 1992-02-16 09:00 | 1992-02-16 09:42 | -44.2810 | 147.2410 | -44.2930 | 147.2383 | 215 | |||
| CTD Cast / Hydrology [details] | 1 | Cast 4 | CTD 3,Conductivity CTD 3,Pressure CTD 3,Temperature CTD 3 | 202 | 1992-02-16 14:05 | 1992-02-16 14:46 | -44.2327 | 147.0117 | -44.2368 | 147.0150 | 153 | |||
| CTD Cast / Hydrology [details] | 1 | Cast 6 | CTD 3,Conductivity CTD 3,Pressure CTD 3,Temperature CTD 3 | 202 | 1992-02-16 20:17 | 1992-02-16 20:47 | -44.2572 | 147.1377 | -44.2663 | 147.1480 | 157 | |||
| CTD Cast / Hydrology [details] | 1 | Cast 7 | CTD 3,Conductivity CTD 3,Pressure CTD 3,Temperature CTD 3 | 202 | 1992-02-17 01:10 | 1992-02-17 01:41 | -44.3043 | 147.3175 | -44.3130 | 147.3208 | 102 | |||
| Hydrology Cast [details] | 1 | 202 | 1992-02-17 07:15 | 1992-02-17 08:00 | -44.2333 | 147.1077 | -44.2327 | 147.1222 | 156 | |||||
| CTD Cast [details] | 1 | Cast 10 | CTD 3,Conductivity CTD 3,Pressure CTD 3,Temperature CTD 3 | 202 | 1992-02-19 23:45 | 1992-02-20 01:09 | -44.1725 | 147.0213 | -44.1677 | 147.0627 | 568 | |||
| CTD Cast / Hydrology [details] | 1 | Cast 11 | CTD 3,Conductivity CTD 3,Pressure CTD 3,Temperature CTD 3 | 202 | 1992-02-20 21:15 | 1992-02-20 21:45 | -43.9855 | 147.1567 | -43.9842 | 147.1605 | 95 | |||
| CTD Cast / Hydrology [details] | 1 | Cast 12 | CTD 3,Conductivity CTD 3,Pressure CTD 3,Temperature CTD 3 | 202 | 1992-02-20 23:45 | 1992-02-21 00:30 | -44.0225 | 147.1797 | -44.0168 | 147.1967 | 100 | |||
| CTD Cast / Hydrology [details] | 1 | Cast 13 | CTD 3,Conductivity CTD 3,Pressure CTD 3,Temperature CTD 3 | 202 | 1992-02-21 02:10 | 1992-02-21 02:45 | -44.0875 | 147.1717 | -44.0900 | 147.1722 | 205 | |||
| CTD Cast / Hydrology [details] | 1 | Cast 14 | CTD 3,Conductivity CTD 3,Pressure CTD 3,Temperature CTD 3 | 202 | 1992-02-21 04:00 | 1992-02-21 05:00 | -44.1592 | 147.1613 | -44.1627 | 147.1563 | 749 | |||
| CTD Cast / Hydrology [details] | 1 | Cast 15 | CTD 3,Conductivity CTD 3,Pressure CTD 3,Temperature CTD 3 | 202 | 1992-02-21 06:09 | 1992-02-21 07:33 | -44.2167 | 147.1725 | -44.2217 | 147.1917 | 996 | |||
| CTD Cast / Hydrology [details] | 1 | Cast 16 | CTD 3,Conductivity CTD 3,Pressure CTD 3,Temperature CTD 3 | 202 | 1992-02-21 08:29 | 1992-02-21 09:41 | -44.2267 | 147.2002 | -44.2335 | 147.2025 | 998 | |||
| CTD Cast / Hydrology [details] | 1 | Cast 17 | CTD 3,Conductivity CTD 3,Pressure CTD 3,Temperature CTD 3 | 202 | 1992-02-21 11:03 | 1992-02-21 12:17 | -44.3322 | 147.1652 | -44.3458 | 147.1792 | 746 | |||
| CTD Cast / Hydrology [details] | 1 | Cast 18 | CTD 3,Conductivity CTD 3,Pressure CTD 3,Temperature CTD 3 | 202 | 1992-02-21 13:50 | 1992-02-21 15:30 | -44.4592 | 147.1633 | -44.4852 | 147.1780 | 1494 | |||
| CTD Cast / Hydrology [details] | 1 | Cast 19 | CTD 3,Conductivity CTD 3,Pressure CTD 3,Temperature CTD 3 | 202 | 1992-02-21 16:50 | 1992-02-21 18:29 | -44.5888 | 147.1650 | -44.6147 | 147.1760 | 1100 | |||
| CTD Cast / Hydrology [details] | 1 | Cast 20 | CTD 3,Conductivity CTD 3,Pressure CTD 3,Temperature CTD 3 | 202 | 1992-02-21 19:20 | 1992-02-21 21:11 | -44.6268 | 147.1822 | -44.6572 | 147.2043 | 1990 | |||
| CTD Cast [details] | 1 | Cast 21 | CTD 3,Conductivity CTD 3,Pressure CTD 3,Temperature CTD 3 | 202 | 1992-02-23 12:28 | 1992-02-23 12:55 | -43.8747 | 146.3367 | -44.5730 | 146.2880 | 103 | |||
| CTD Cast [details] | 1 | Cast 22 | CTD 3,Conductivity CTD 3,Pressure CTD 3,Temperature CTD 3 | 202 | 1992-02-23 14:05 | 1992-02-23 14:30 | -43.9360 | 146.3110 | -43.9283 | 146.3080 | 96 | |||
| CTD Cast / Hydrology [details] | 1 | Cast 23 | CTD 3,Conductivity CTD 3,Pressure CTD 3,Temperature CTD 3 | 202 | 1992-02-23 15:40 | 1992-02-23 16:17 | -43.9780 | 146.2792 | -43.9743 | 146.2708 | 199 | |||
| CTD Cast / Hydrology [details] | 1 | Cast 24 | CTD 3,Conductivity CTD 3,Pressure CTD 3,Temperature CTD 3 | 202 | 1992-02-23 17:35 | 1992-02-23 18:35 | -44.0897 | 146.2525 | -44.0767 | 146.2543 | 876 | |||
| CTD Cast / Hydrology [details] | 1 | Cast 25 | CTD 3,Conductivity CTD 3,Pressure CTD 3,Temperature CTD 3 | 202 | 1992-02-23 19:35 | 1992-02-23 20:46 | -44.1427 | 146.2352 | -44.1325 | 146.2517 | 1096 | |||
| CTD Cast / Hydrology [details] | 1 | Cast 26 | CTD 3,Conductivity CTD 3,Pressure CTD 3,Temperature CTD 3 | 202 | 1992-02-23 22:10 | 1992-02-23 23:16 | -44.2222 | 146.1955 | -44.2047 | 146.1967 | 743 | |||
| Hydrology Cast [details] | 1 | 202 | 1992-02-24 00:35 | 1992-02-24 02:18 | -44.3250 | 146.1293 | -44.2958 | 146.1417 | 1492 | |||||
| CTD Cast / Hydrology [details] | 1 | Cast 28 | CTD 3,Conductivity CTD 3,Pressure CTD 3,Temperature CTD 3 | 202 | 1992-02-24 04:03 | 1992-02-24 05:35 | -44.4660 | 146.0710 | -44.4433 | 146.0547 | 1494 | |||
| CTD Cast / Hydrology [details] | 1 | Cast 29 | CTD 3,Conductivity CTD 3,Pressure CTD 3,Temperature CTD 3 | 202 | 1992-02-24 07:48 | 1992-02-24 08:17 | -44.7158 | 145.9667 | -44.7068 | 145.9768 | 147 | |||
| Hydrology Cast [details] | 1 | 202 | 1992-02-24 09:29 | 1992-02-24 11:41 | -44.6833 | 145.9977 | -44.6452 | 146.0347 | 1974 | |||||