The table below provides basic information about the float, including primary sensors, mission parameters and current status of profiles.
| Institute | CSIRO |
| Principal Investigator | Susan Wijffels |
| Pressure Sensor | Druck (serial number=3061937) |
| CTD Sensor | APEX-SBE-41CP 2.0 (serial number=3174) |
| CTD Sampling Mode | CP |
| Controller Board | APF 9 Iridium |
| Additional Sensors/Software | None |
| Park Depth | 1000 m |
| Profile Depth | 2000 m |
| Launch Date | 19/08/2010 |
| Number of D-moded Profiles | 15 |
| Calibration Date | 12/07/2011 |
| Pressure Drift | Surface Pressure Offset corrected |
| Salinity Drift | No salinity drift detected |
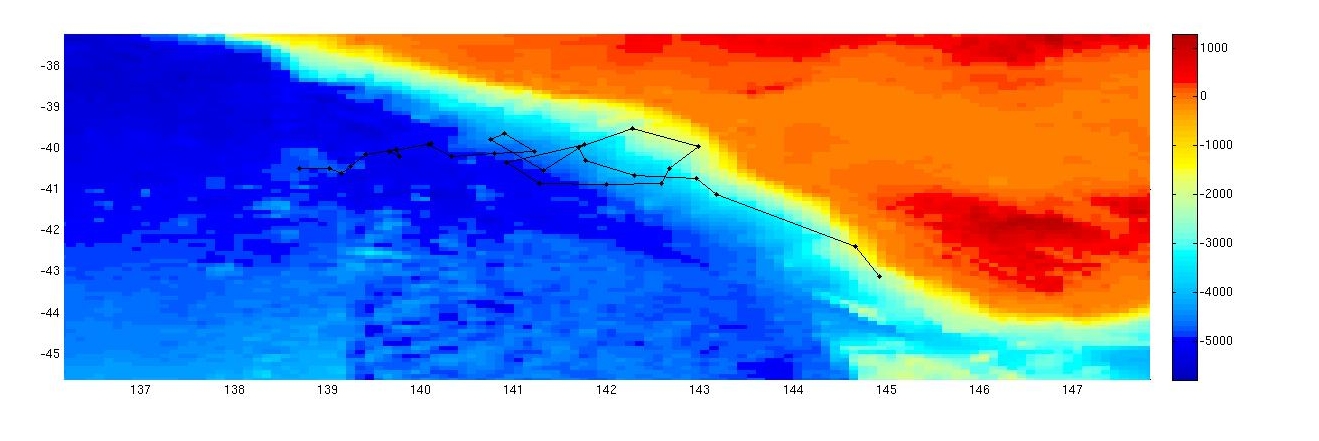
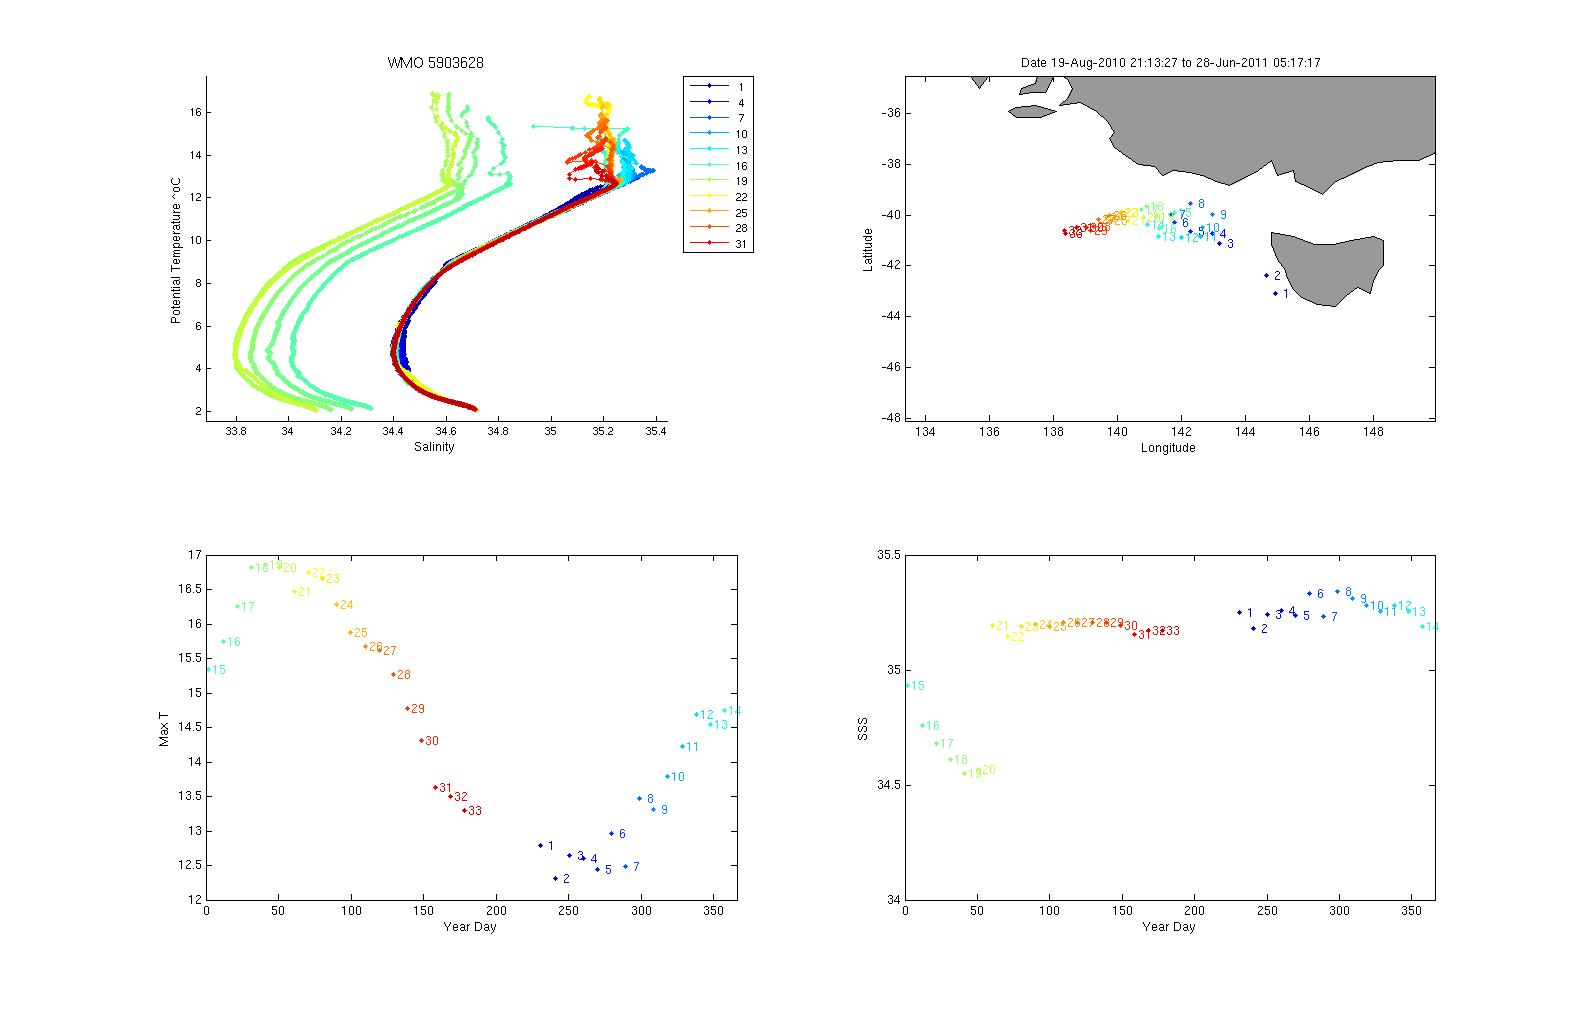
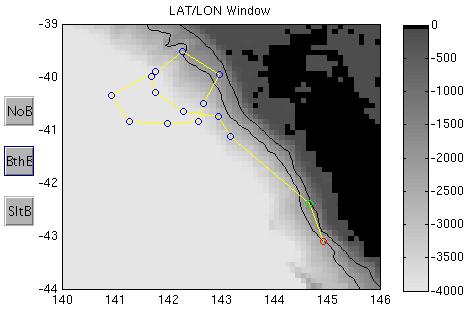
This float was located in the Southern Ocean, in an area bounded by 138 to 147 şE and 38 to 45 ş S.
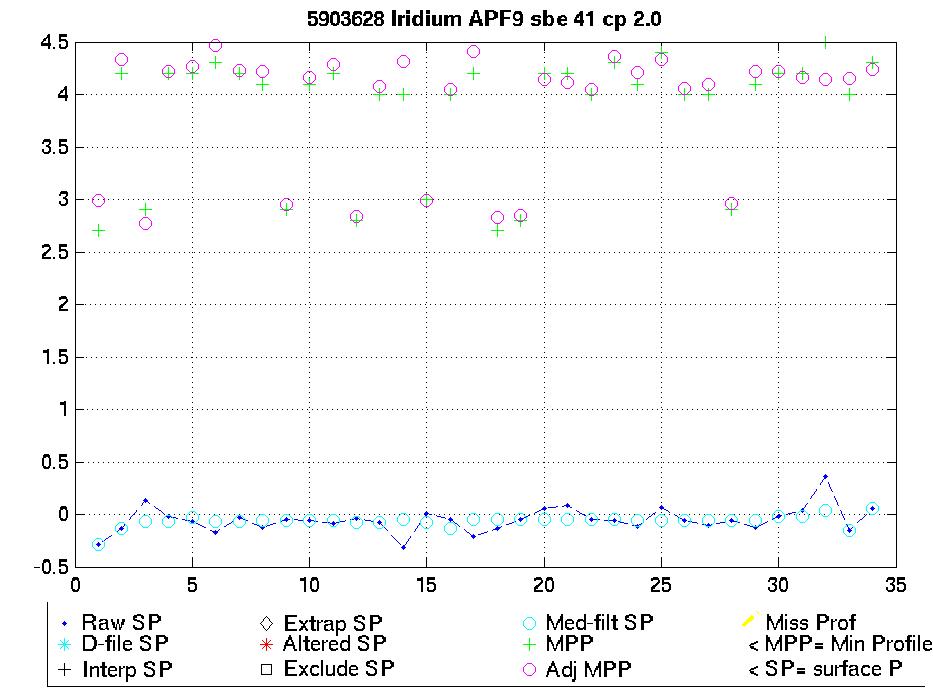
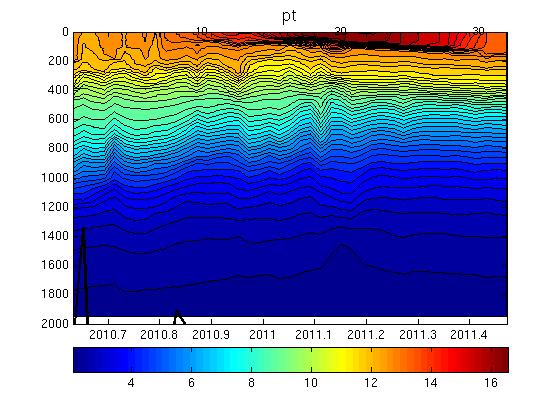
The surface pressure for this float is shown in the plot below.
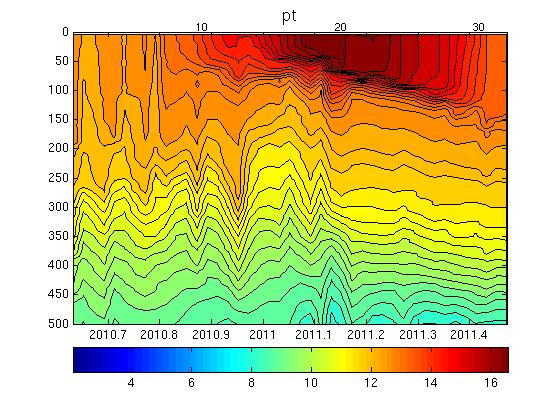
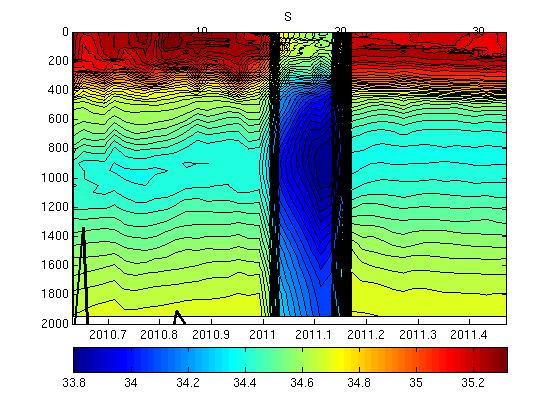
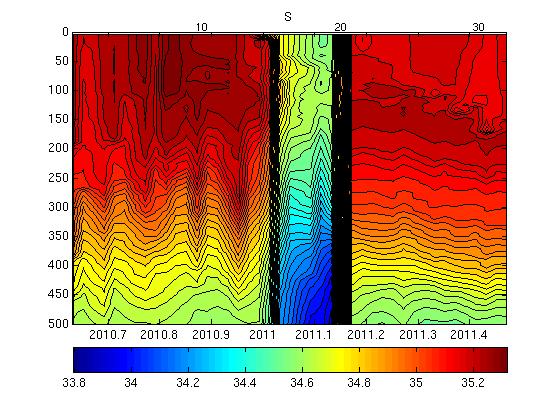
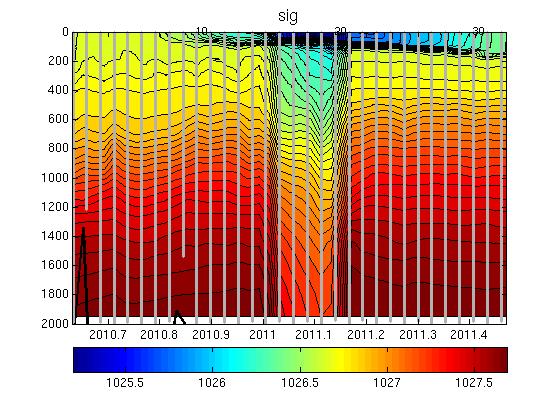
Potential Temperature-Salinity (a), Location (b, Max Temperature (c) and Sea Surface Salinity (d) plots located below.
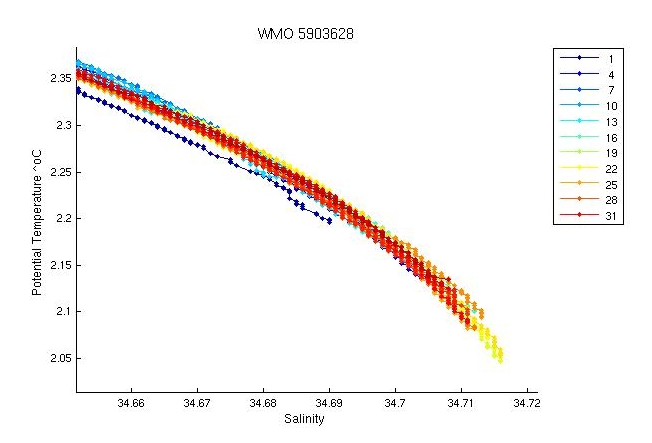
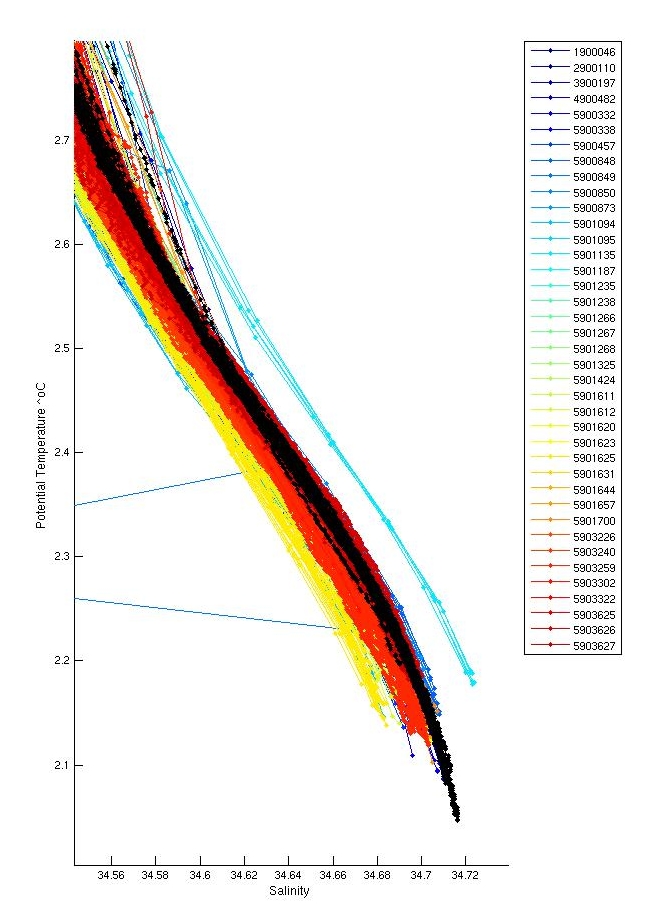
The plot below shows the potential-temperature/salinity relationship for the deepest theta levels where the relationship between the two parameters should show the least variation.
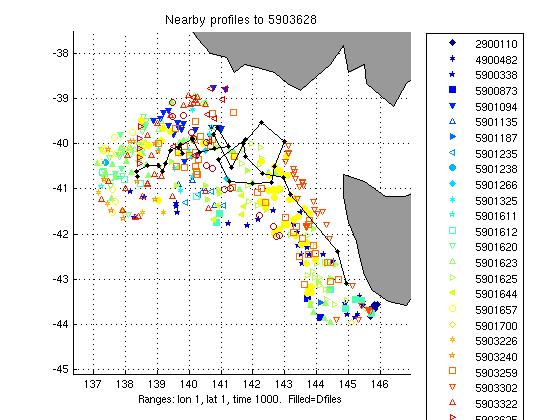
The two plots below show a). the location of this float (black circles) in relation to the position of other nearby argo floats (coloured circles) and b). The potential-temperature/salinity curve for this float (in black) compared to nearby argo floats (coloured).
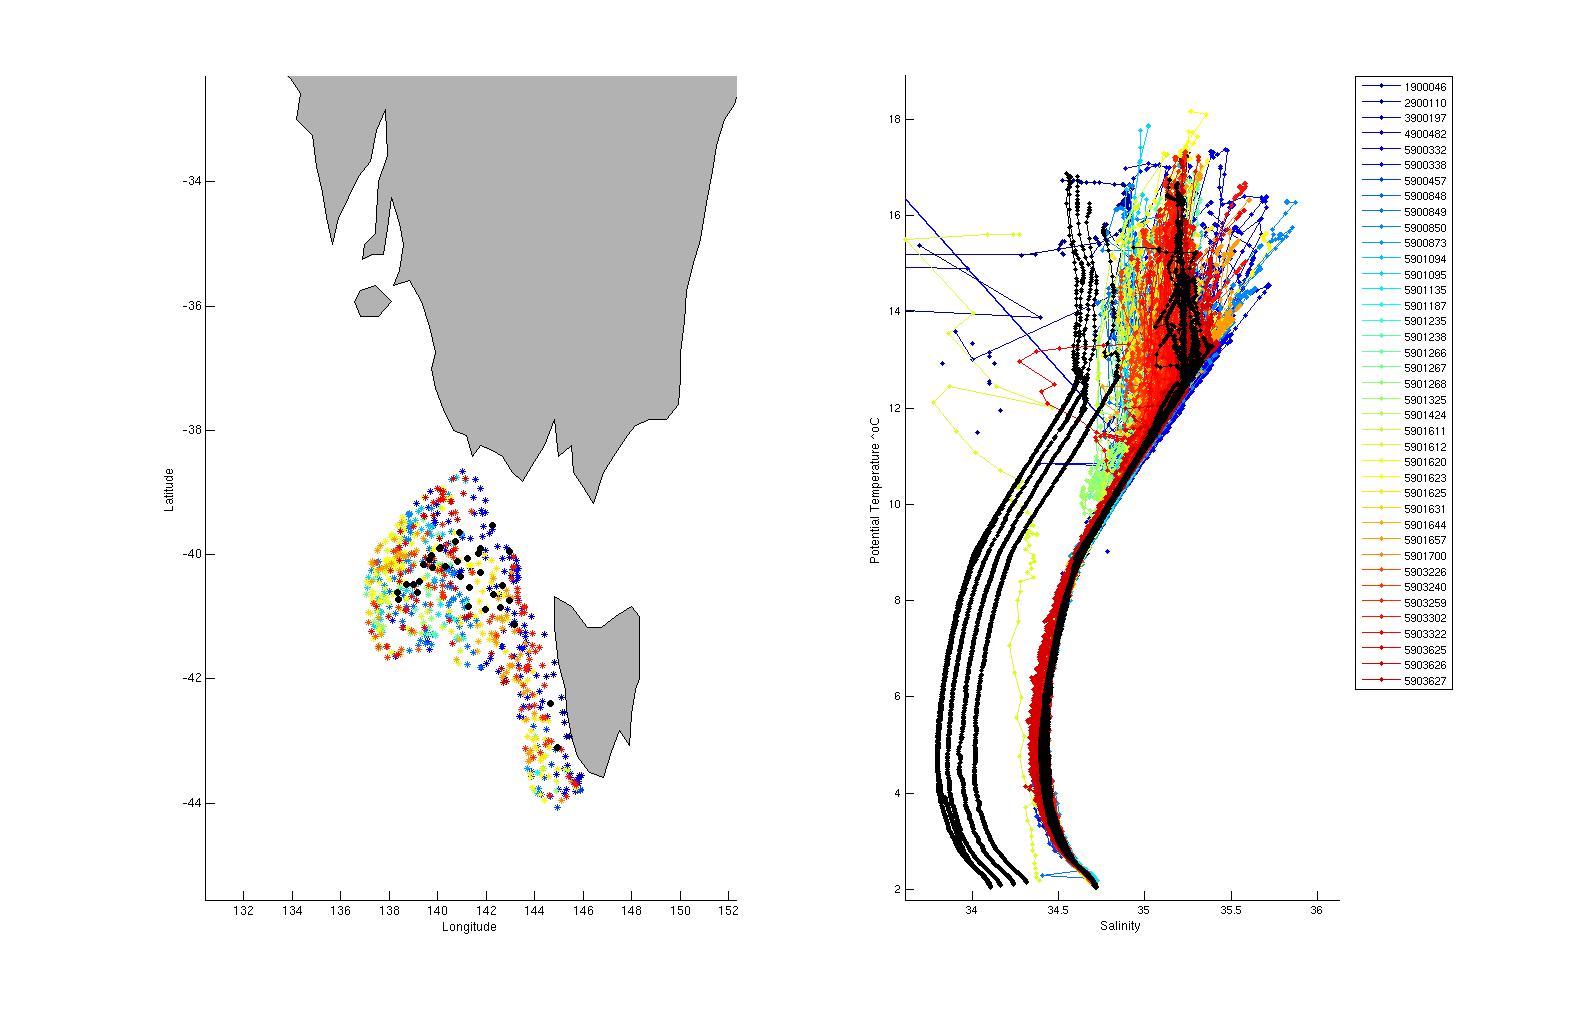
The potential-temperature/salinity relation for the deepest theta levels for this float (in black) and nearby argo floats (coloured) is displayed below.
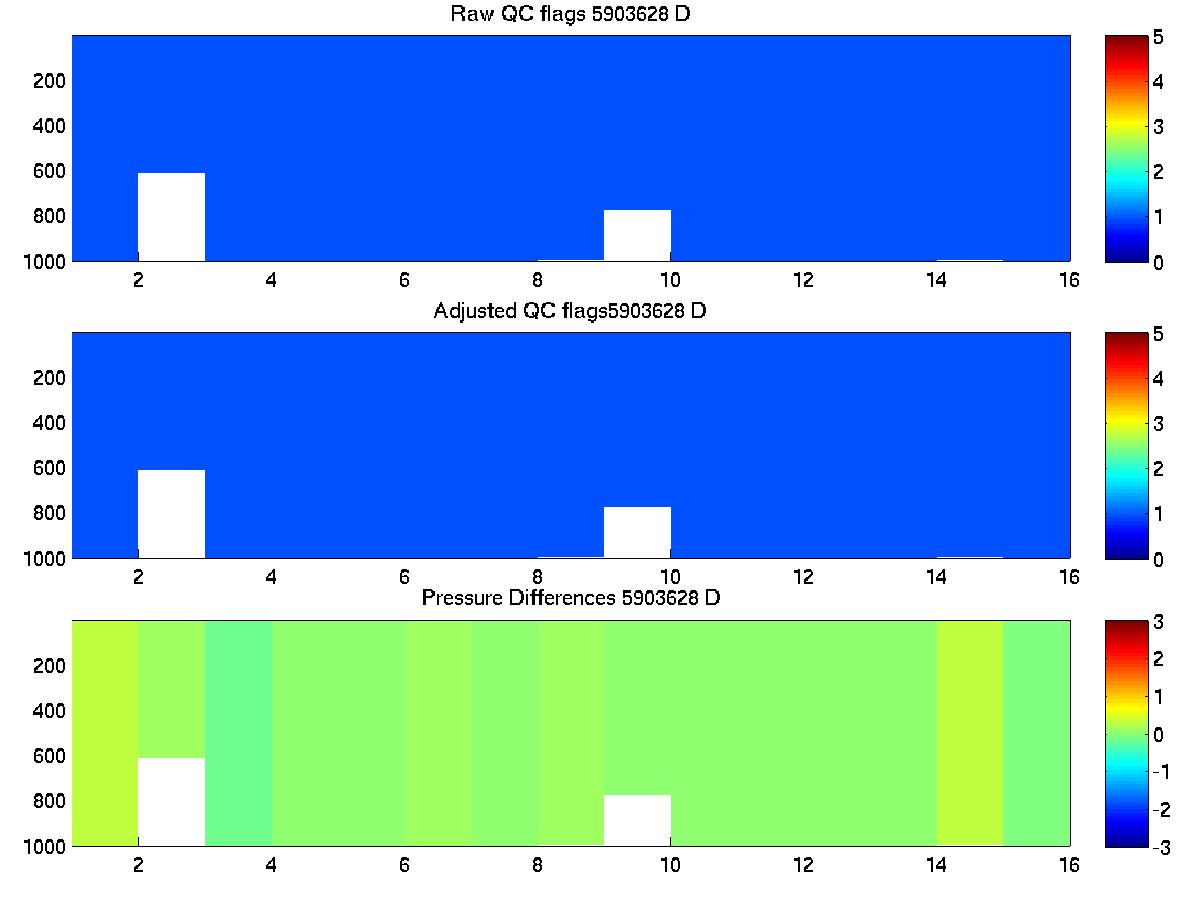
There were inversions in profiles; 9,12. These were caused by spikes in salinity and were flagged as QC=4.
There were no salt hooks.
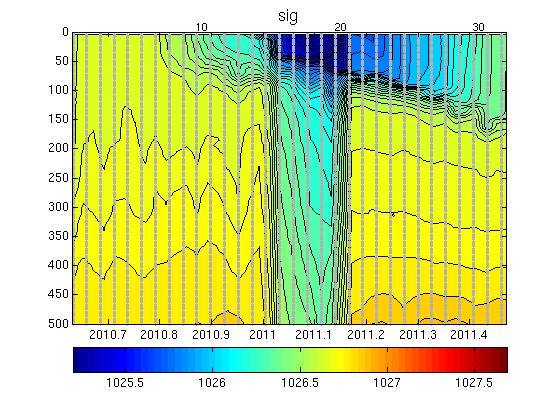
Five profiles were affected by acute biofouling throughout the whole water column and were fresh offset by up to 0.06. These were obviously caused by fouling ofthe cell that was flushed after 5 profiles. The salinity values for these profiles were QC'd as 4.
The plot below shows the analysis of salinity drift using the OW software.

The four plots below show the salinity anomalies on theta surfaces compared to (a) the Gouretski and Kolterman climatology, (b) the CARS (CSIRO Atlas of Regional Seas)/WOA (World Ocean Atlas) climatology, (c) the anomalies within the float series itself, (i.e. the salinity anomaly of each profile from the mean profile average for the float and (d) the raw float salinity compared to the CARS and G&K climatological salinity on a deep theta surface.
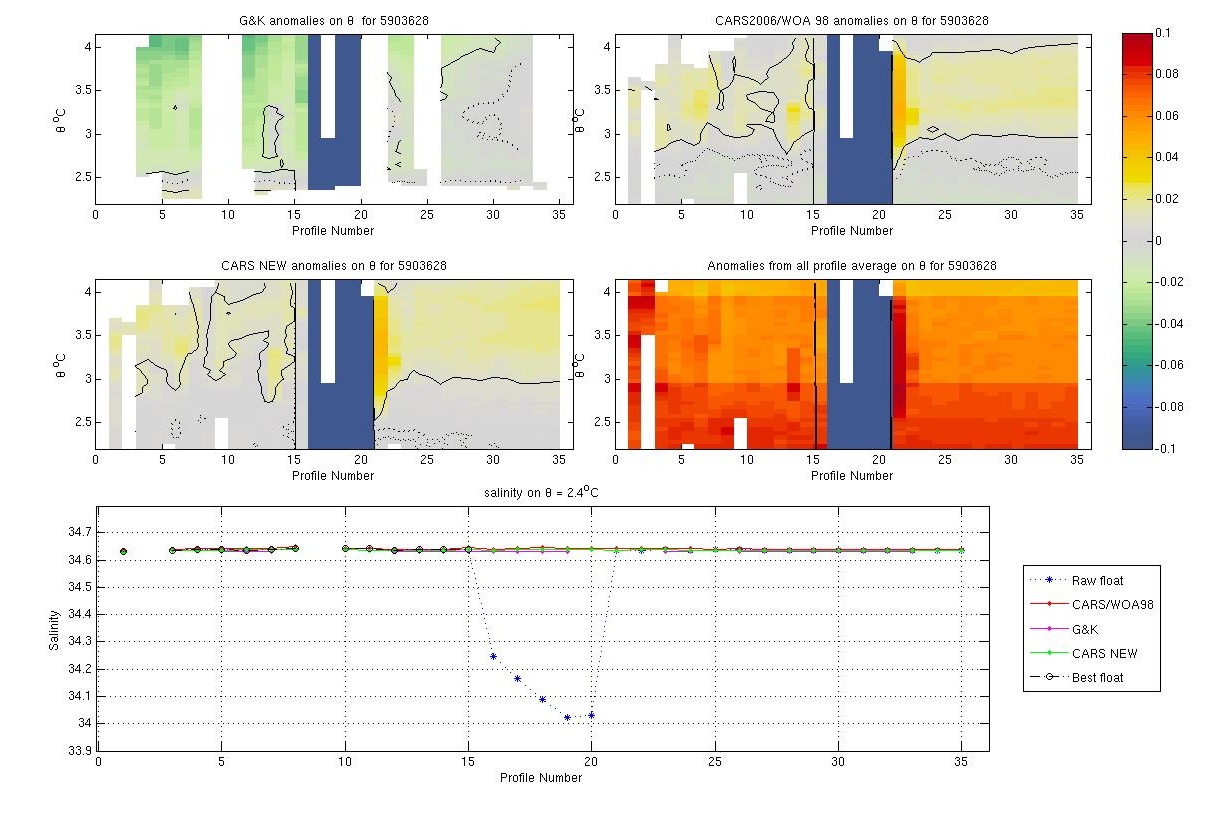
Not much data to compare with here, but the float data looks close to the few climatology data points available.
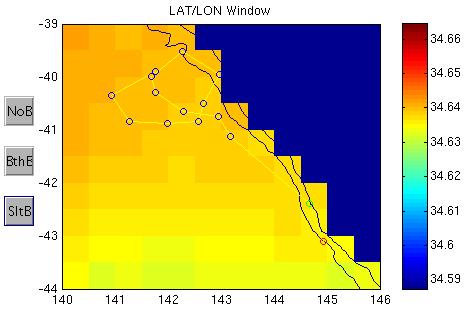
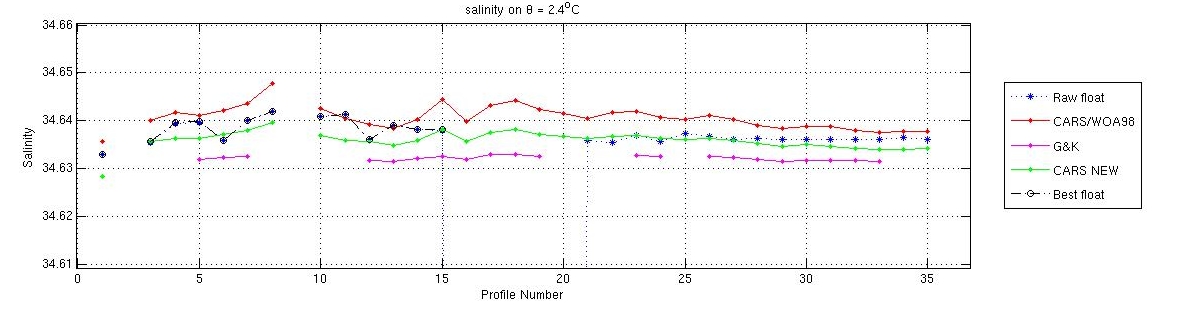
The plots below show the raw float salinity data (solid blue line) compared to neighbouring argo floats (coloured symbols) on a deep potential temperature surface. The locality map shows the location of the profiles for this float and for neighbouring floats.
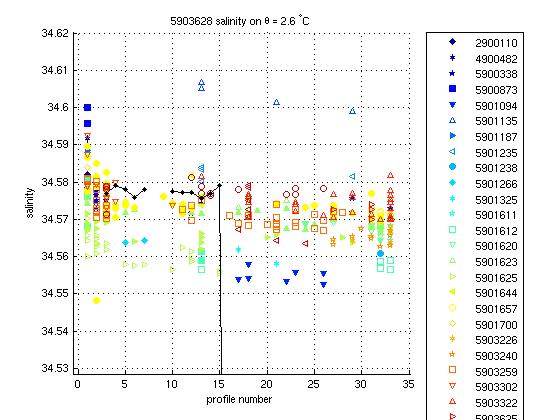
The float is close to nearby Argo data at the upper end of the data spectrum.
This float required no salinity drift correction.
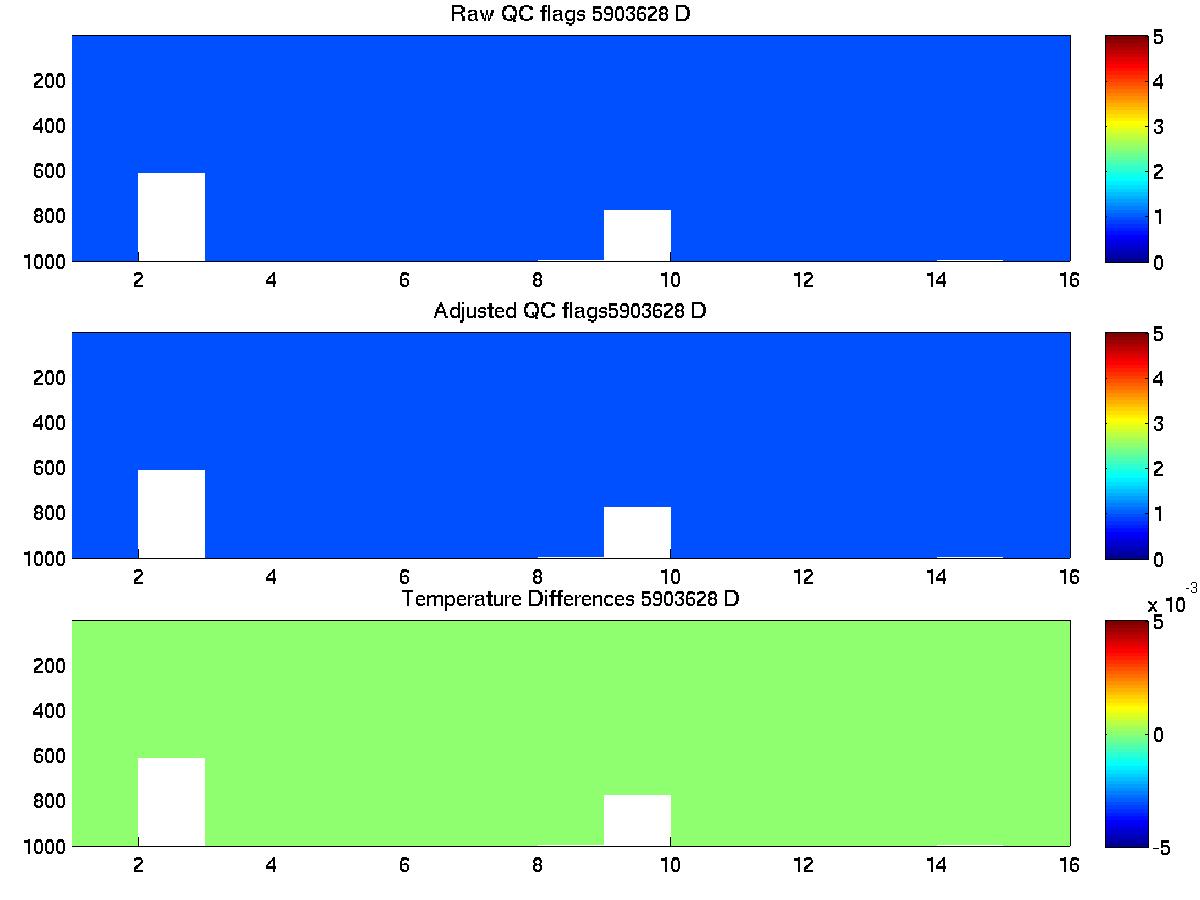
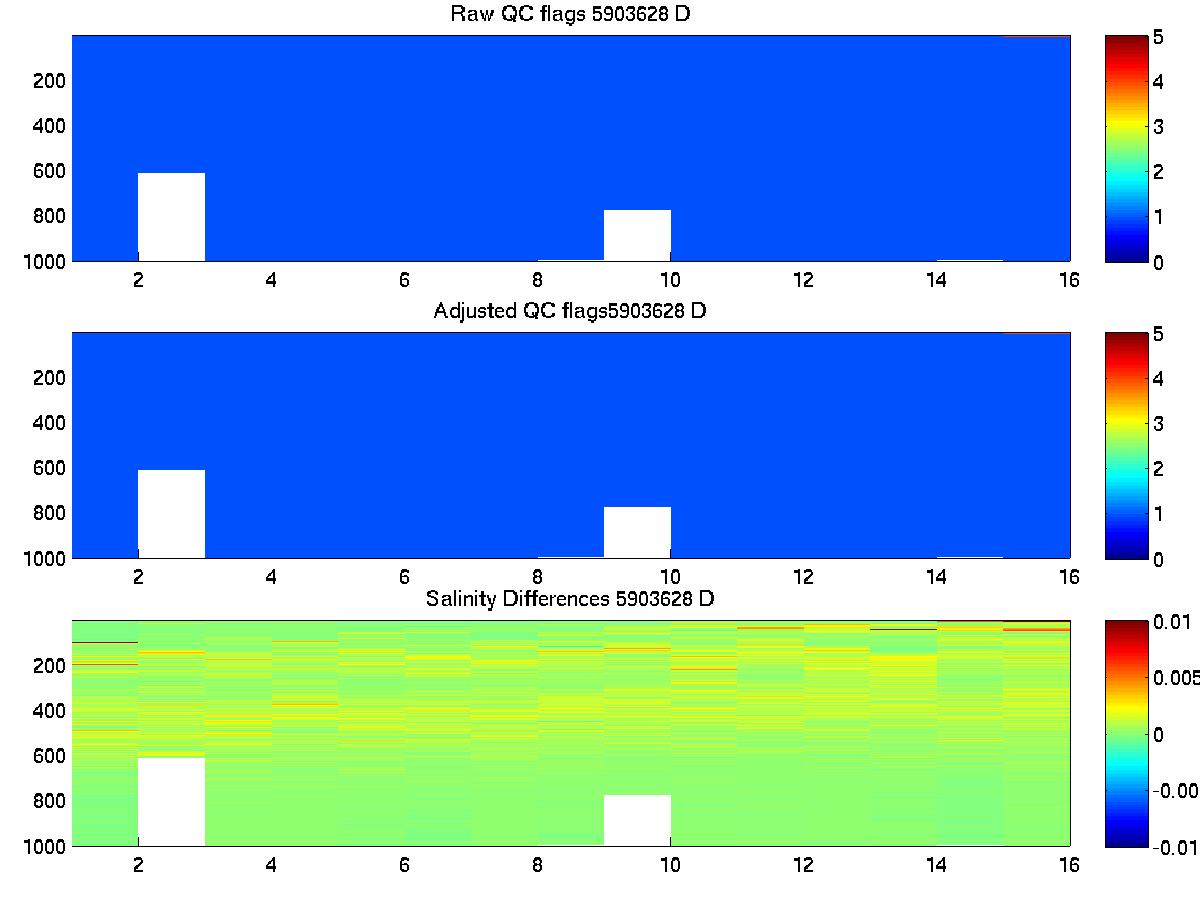
The plot below summarises the QC flags and differences for the raw and adjusted fields in the final delayed mode files submitted to the GDAC.