The table below provides basic information about the float, including primary sensors, mission parameters and current status of profiles.
| Institute | CSIRO |
| Principal Investigator | Susan Wijffels |
| Pressure Sensor | Druck (serial number=2636957) |
| CTD Sensor | APEX-SBE-41 (serial number=4159) |
| CTD Sampling Mode | Burst Sampler |
| Controller Board | APF 9 |
| Additional Sensors/Software | None |
| Park Depth | 1000 m |
| Profile Depth | 2000 m |
| Launch Date | 27-11-2008 |
| Number of D-moded Profiles | 23 |
| Calibration Date | 04-08-2010 |
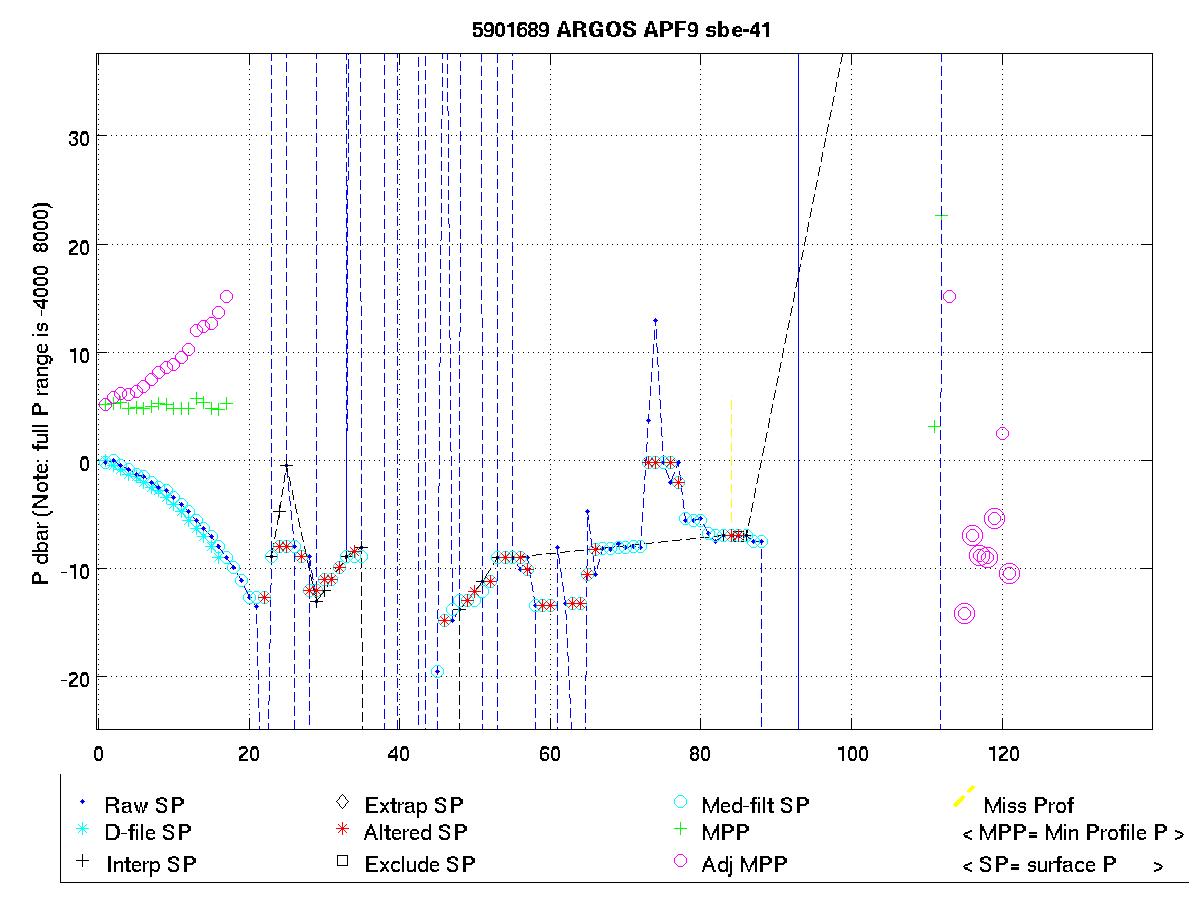
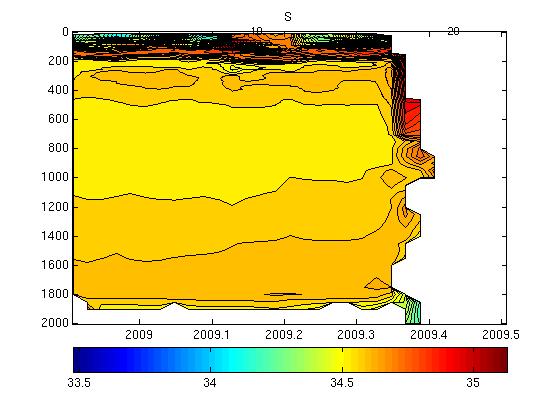
| Pressure Drift | This float is a Druck microleaker. Profiles 1 to 16 corrected for pressure offset. Profiles beyond this deemed unrecoverable. |
| Salinity Drift | Salinity drift detected caused by Druck microleak. Profiles 1 to 16 adjusted with OW. Profiles beyond this deemed unrecoverable. |
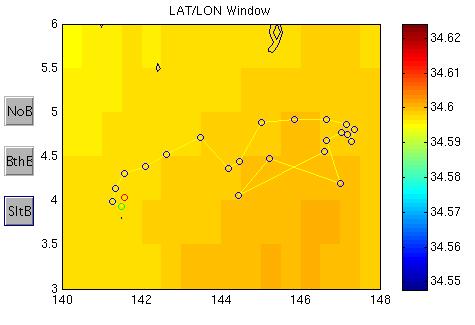
This float was located in the Pacific Ocean, to the north of Papua New Guinea, in an area bounded by 141 to 148 şE and 3 to 5 şN.
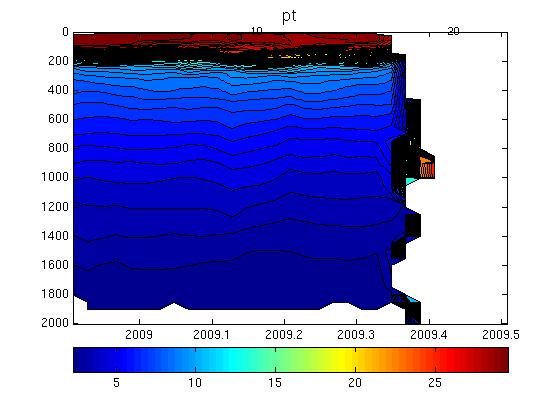
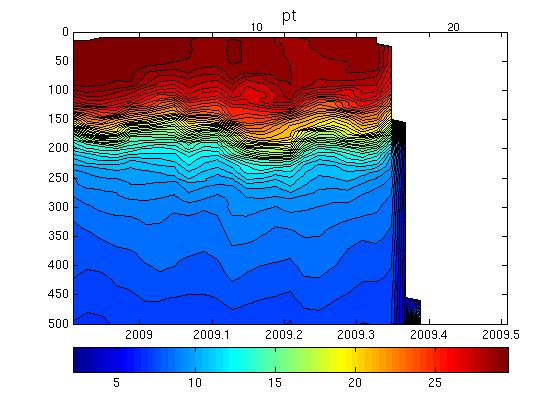
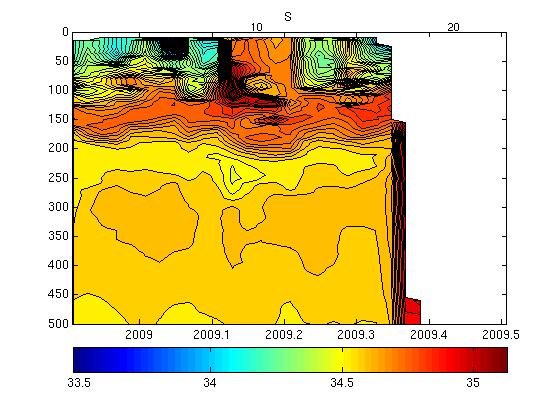
The surface pressure for this float is shown in the plot below.
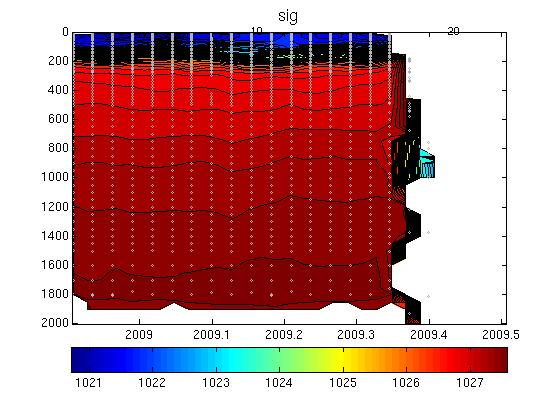
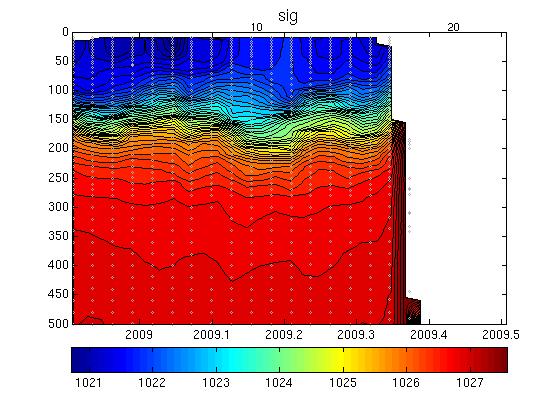
Potential Temperature-Salinity (a), Location (b, Max Temperature (c) and Sea Surface Salinity (d) plots located below.
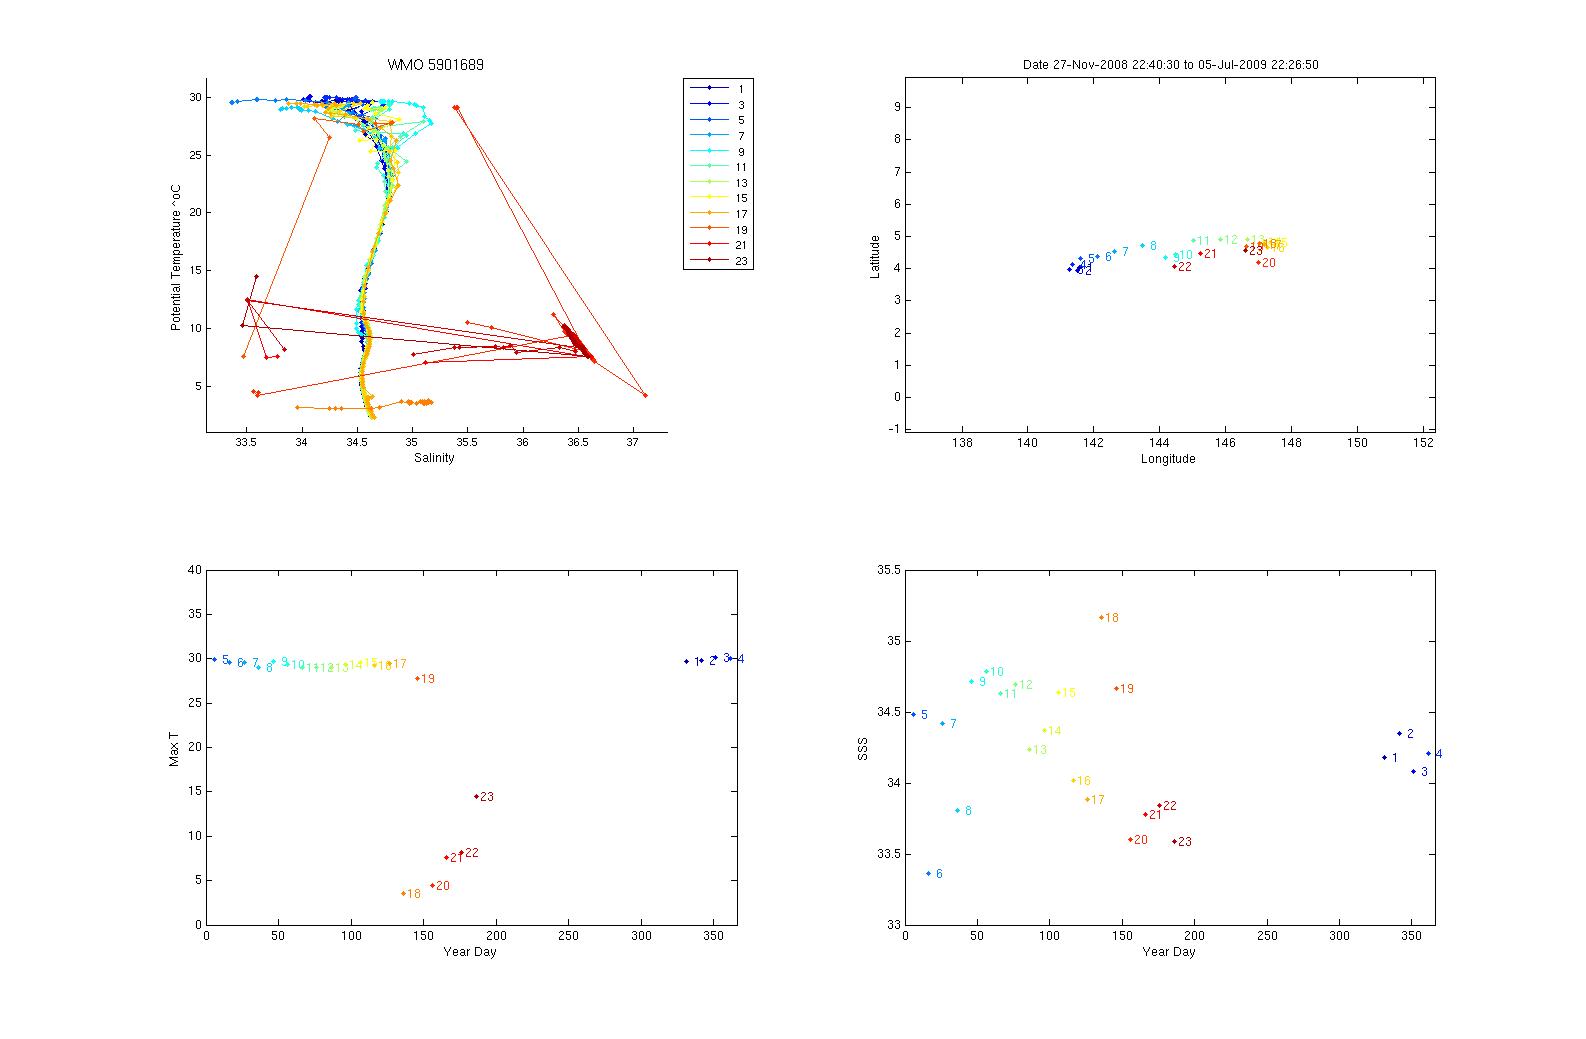
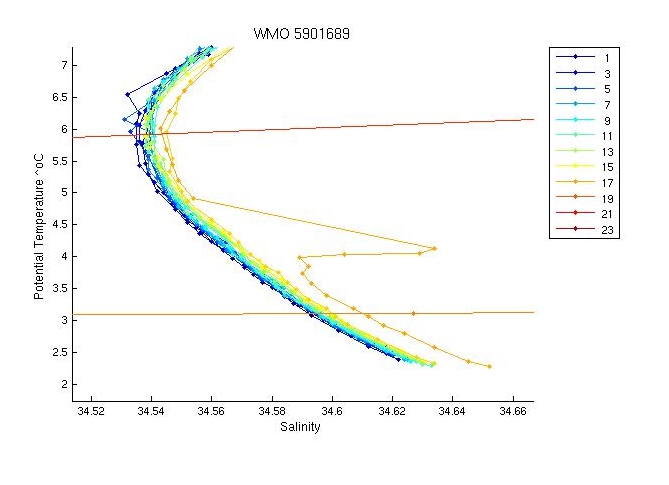
The plot below shows the potential-temperature/salinity relationship for the deepest theta levels where the relationship between the two parameters should show the least variation.
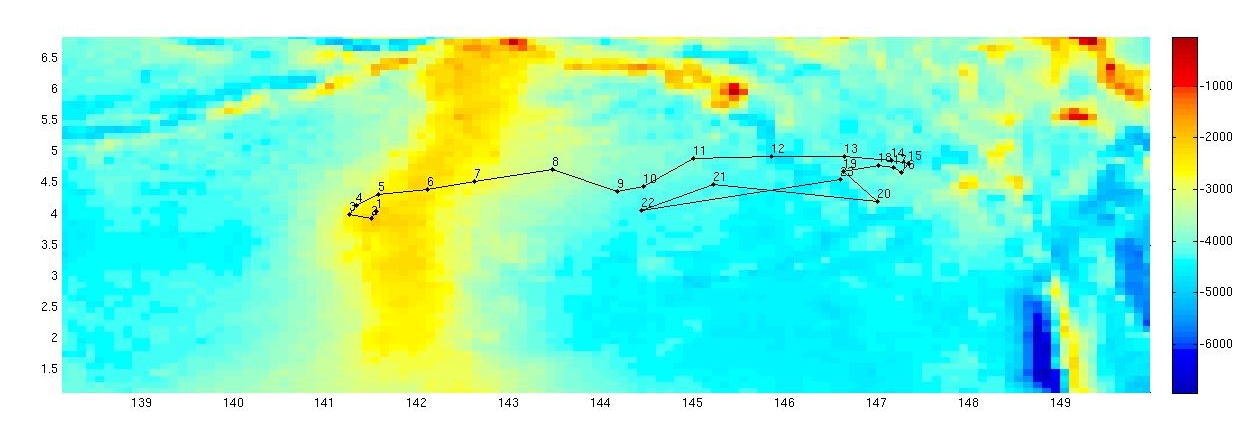
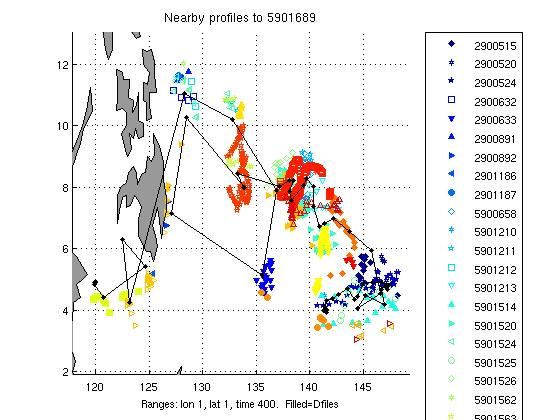
The two plots below show a). the location of this float (black circles) in relation to the position of other nearby argo floats (coloured circles) and b). The potential-temperature/salinity curve for this float (in black) compared to nearby argo floats (coloured).
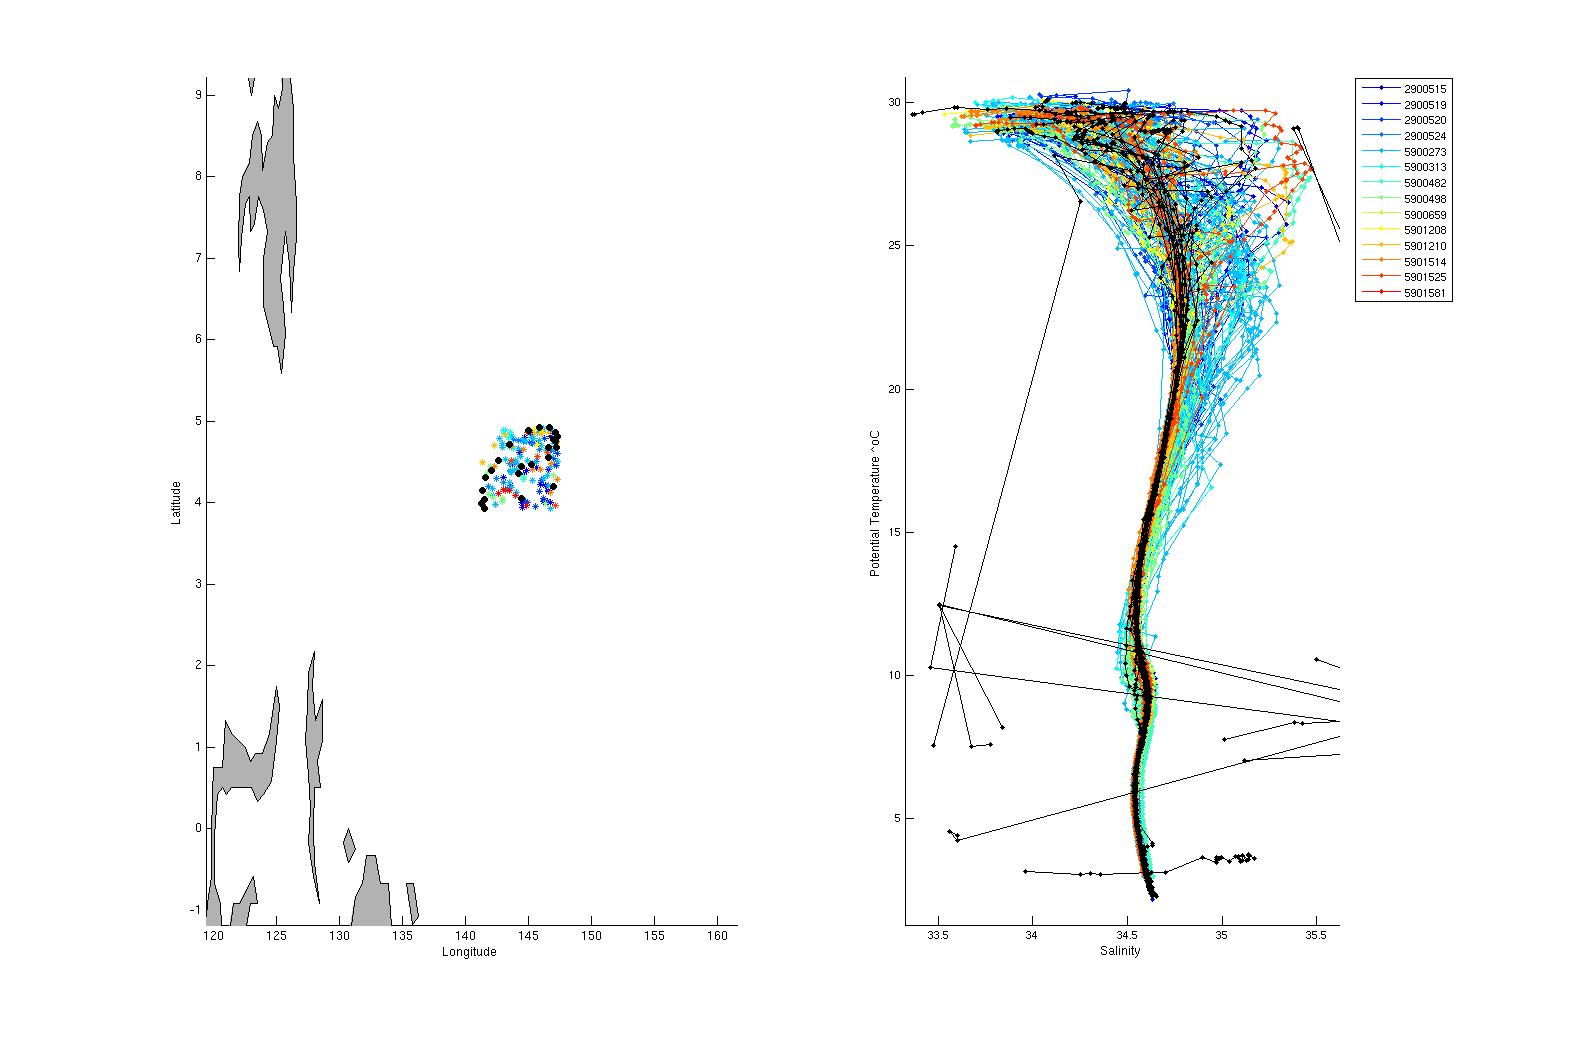
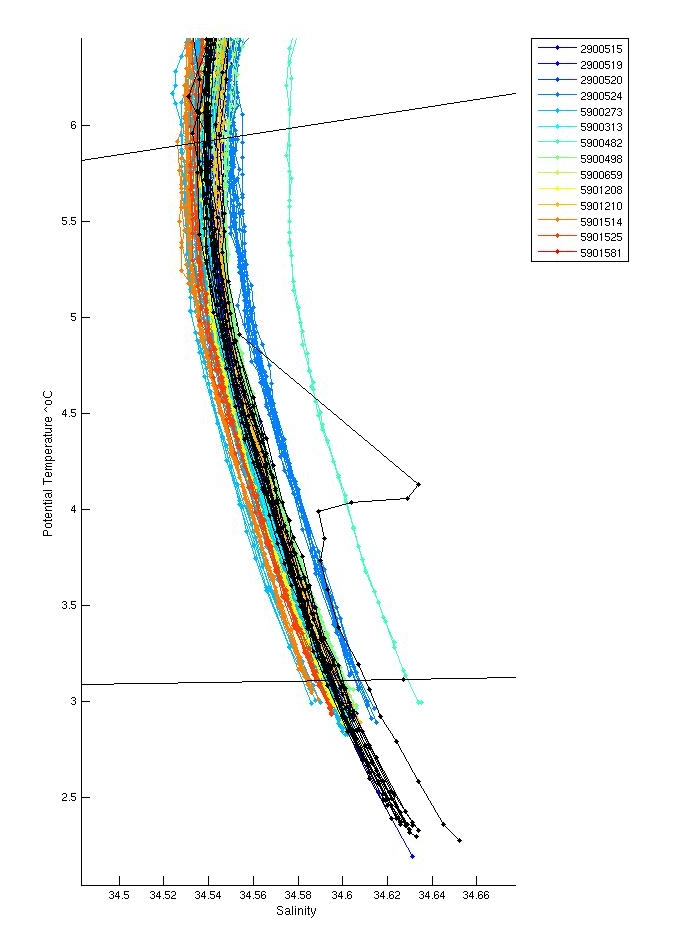
The potential-temperature/salinity relation for the deepest theta levels for this float (in black) and nearby argo floats (coloured) is displayed below.
There were no inversions.
No salt hooks. All profiles significantly shallower than 2000m, i.e. around 1800m.
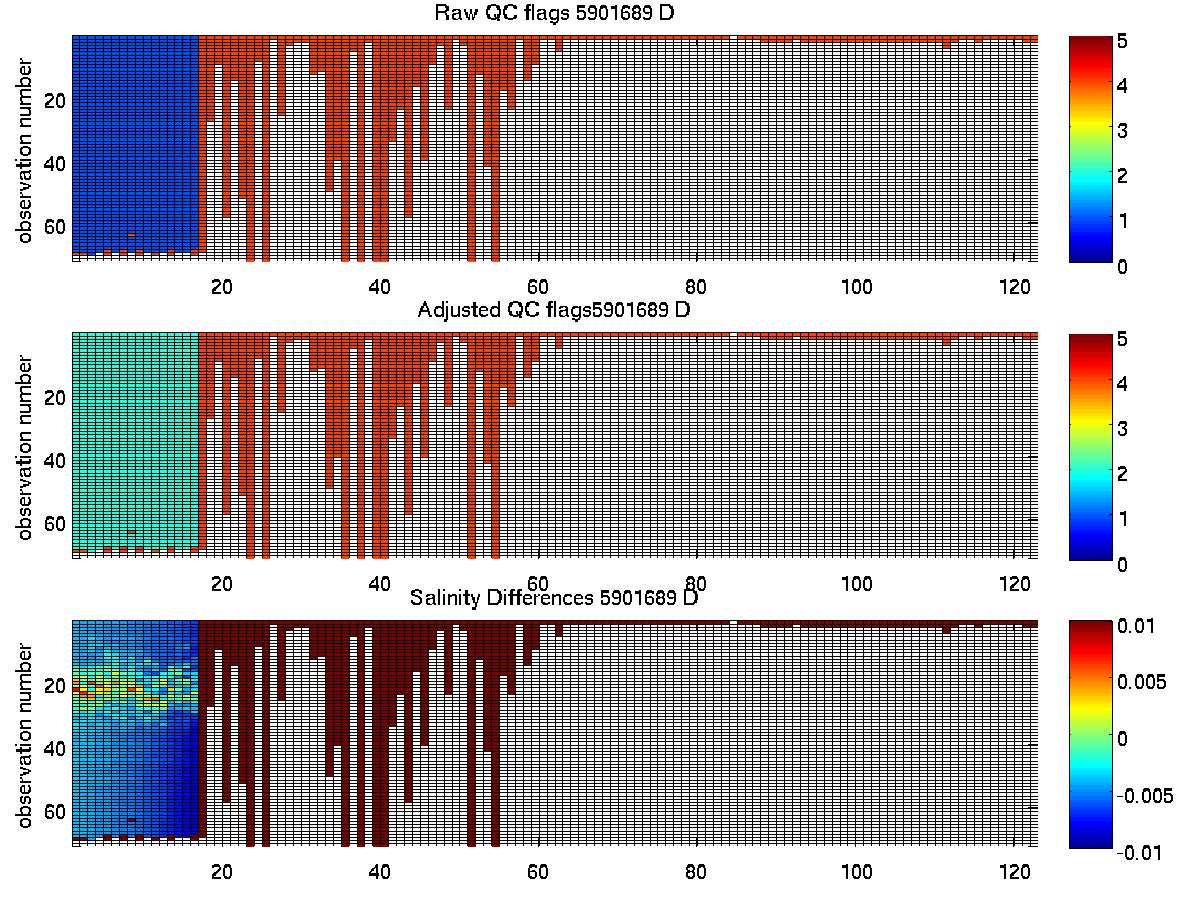
Significant bad data due to Druck microleak issue. Flagged the bottom values of pf 3 and 11. Flagged all of pf 17 onwards as QC=4 due to DML, the pressure error was 10 db or greater and data has numerous spikes/errors.
The plot below shows the analysis of salinity drift using the OW software.

The four plots below show the salinity anomalies on theta surfaces compared to (a) the Gouretski and Kolterman climatology, (b) the CARS (CSIRO Atlas of Regional Seas)/WOA (World Ocean Atlas) climatology, (c) the anomalies within the float series itself, (i.e. the salinity anomaly of each profile from the mean profile average for the float and (d) the raw float salinity compared to the CARS and G&K climatological salinity on a deep theta surface.
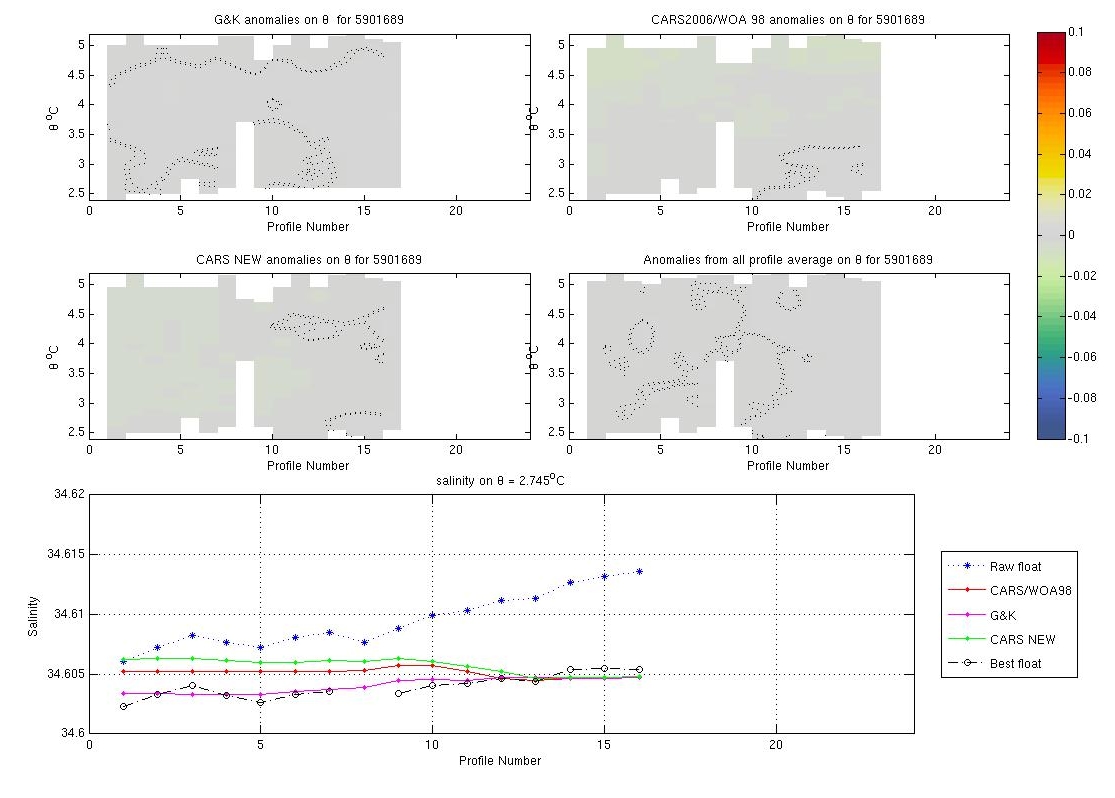
The float becomes offset from climatology due to the Druck microleak.
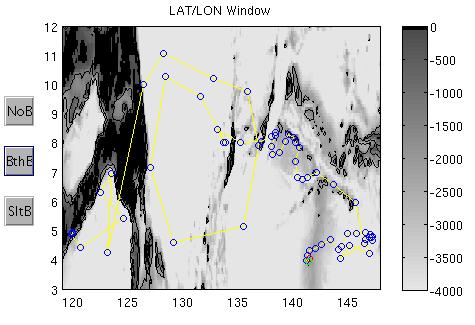
The plots below show the raw float salinity data (solid blue line) compared to neighbouring argo floats (coloured symbols) on a deep potential temperature surface. The locality map shows the location of the profiles for this float and for neighbouring floats.
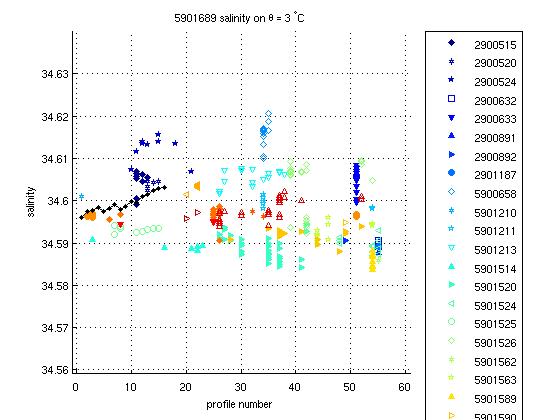
This float suffers significant drift due to the Druck microleak.
This float has a significant salinity drift caused by the DML. Use OW to correct pfs 1 to 16. All other profiles beyond this deemed unrecoverable and QC'd as 4 for all parameters.
The plot below summarises the QC flags and salinity differences for the raw and adjusted salinity fields in the final delayed mode files submitted to the GDAC.