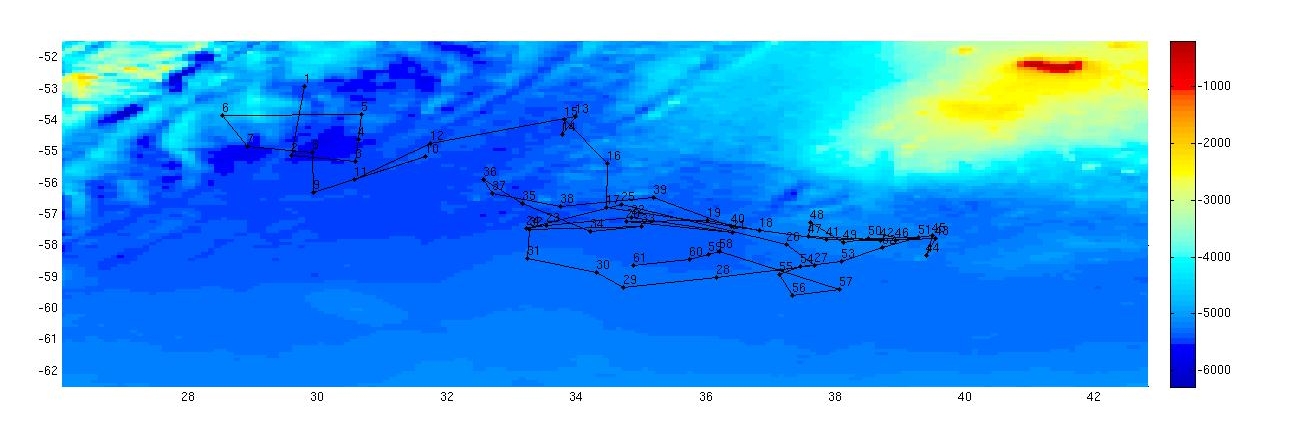
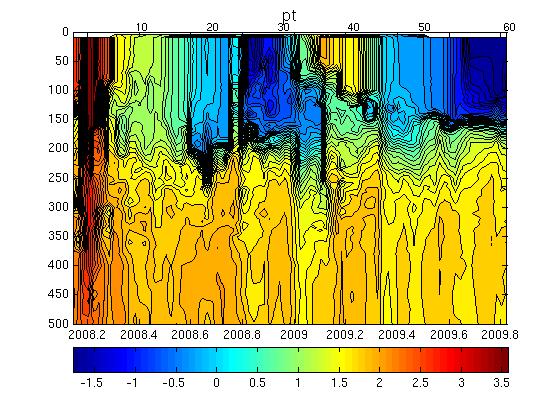
The float did not ground anywhere and there were no missing profiles. The large spike in profile 10 in T & S at 1400 m depth was flagged as QC=4. The last two values of profile 7 were flagged as QC4 as was a spike in the surface mixed layer in profile 1.
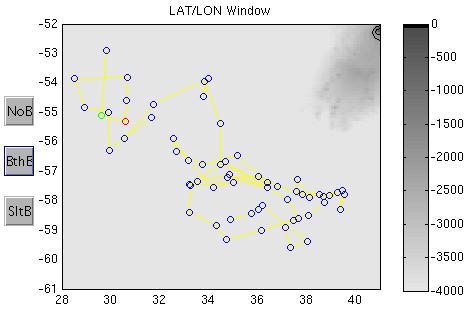
Float trajectory overlayed on bathymetry
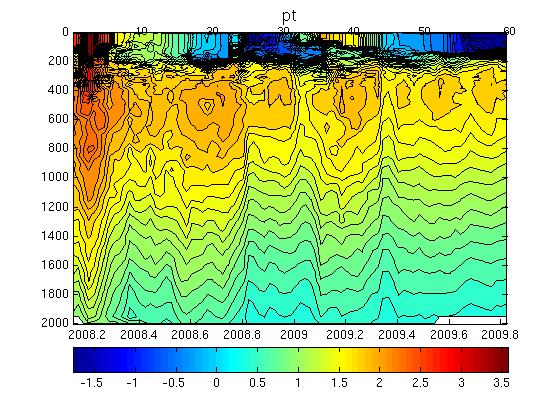
Potential temperature section with time, (left) surface to 2000m and (right) surface to 500m
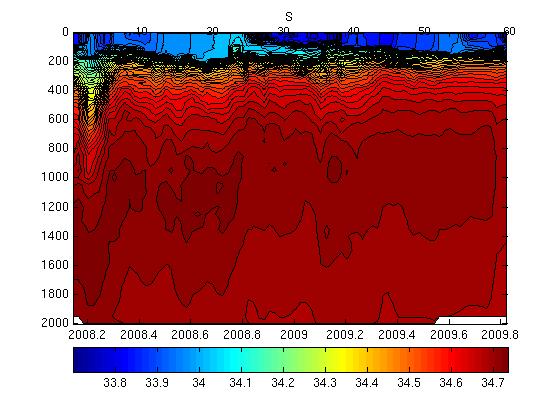
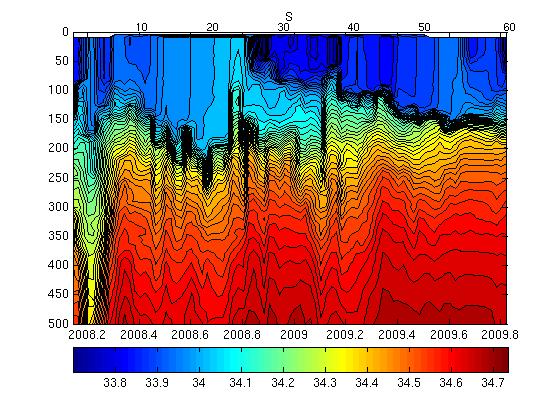
Salinity section with time, (left) surface to 2000m and (right) surface to 500m
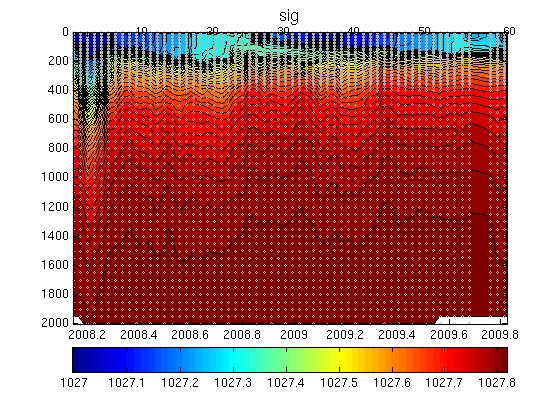
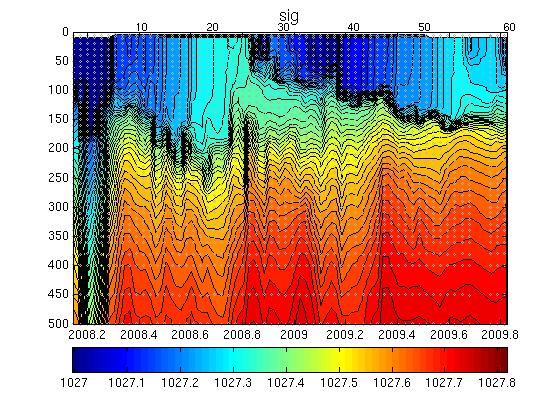
Potential density section with time, (left) surface to 2000m and (right) surface to 500m
Section 9: WJO/OW Results
The plot below shows the analysis of salinity drift using the WJO/OW software.

The float was very close to mapped salinity and no correction was required.
Section 10: Anomaly Plots
The four plots below show the salinity anomalies on theta surfaces compared to (a) the Gouretski and Kolterman climatology, (b) the CARS (CSIRO Atlas of Regional Seas)/WOA (World Ocean Atlas) climatology, (c) the anomalies within the float series itself, (i.e. the salinity anomaly of each profile from the mean profile average for the float and (d) the raw float salinity compared to the CARS and G&K climatological salinity on a theta surface of 0.88 degrees C.
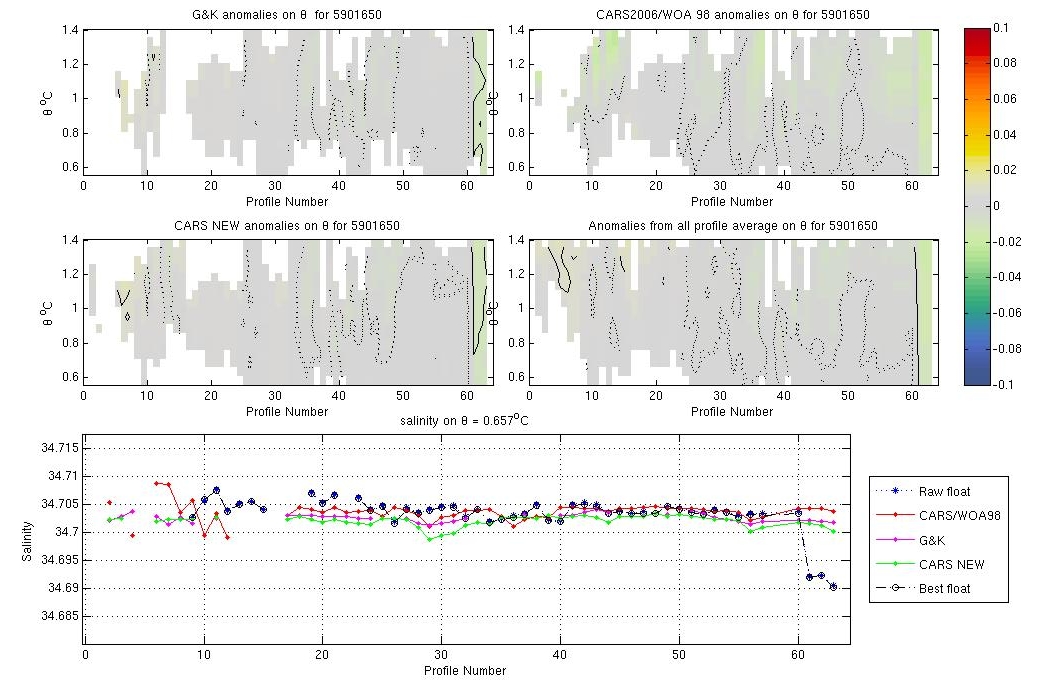
The float was very close to CARS and offset from G&K (especially for the first 12 profiles). However as the float crossed two fronts this kind of variability is reasonable.
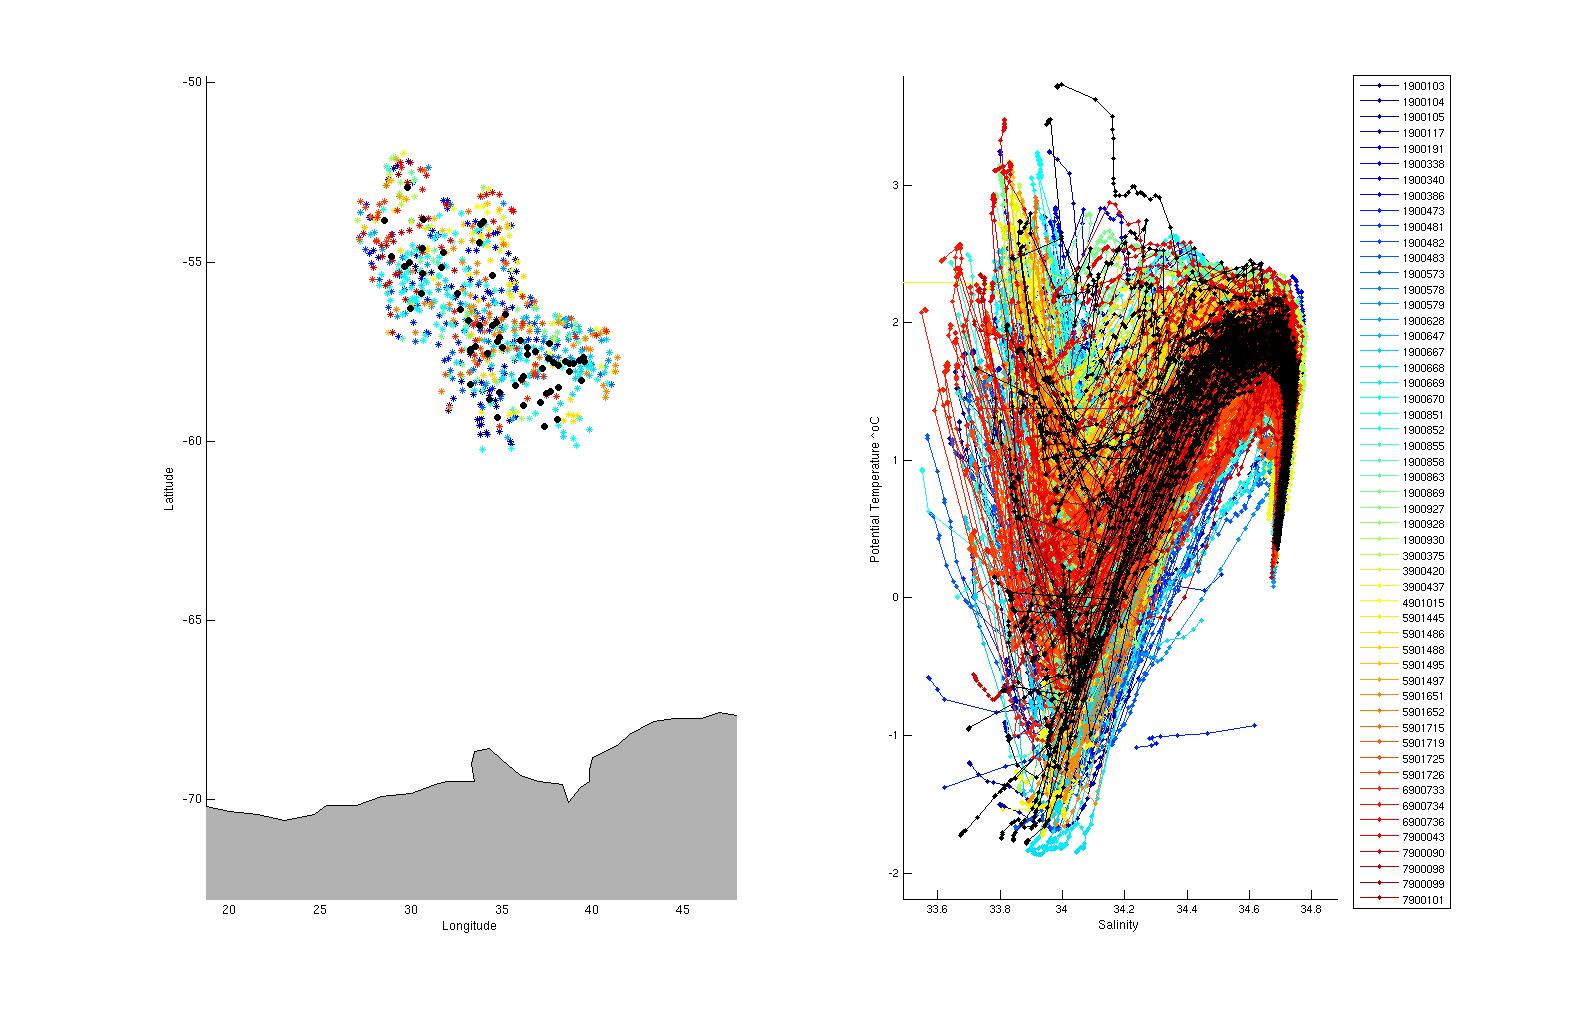
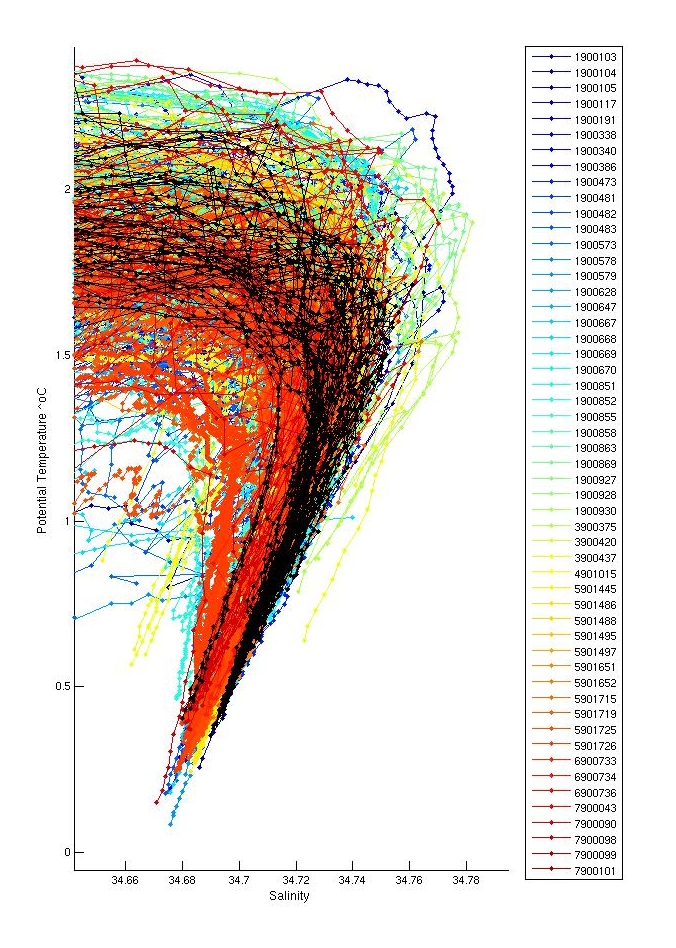
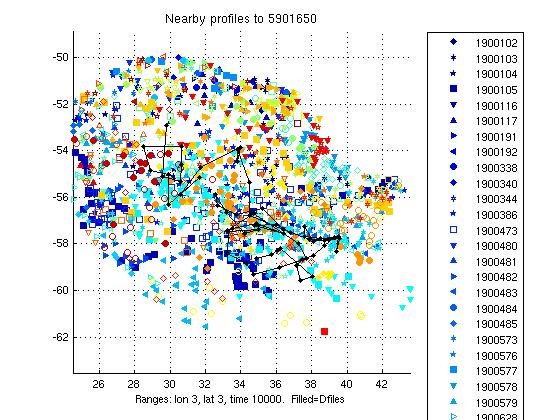
Section 11: Comparison with Nearby Argo
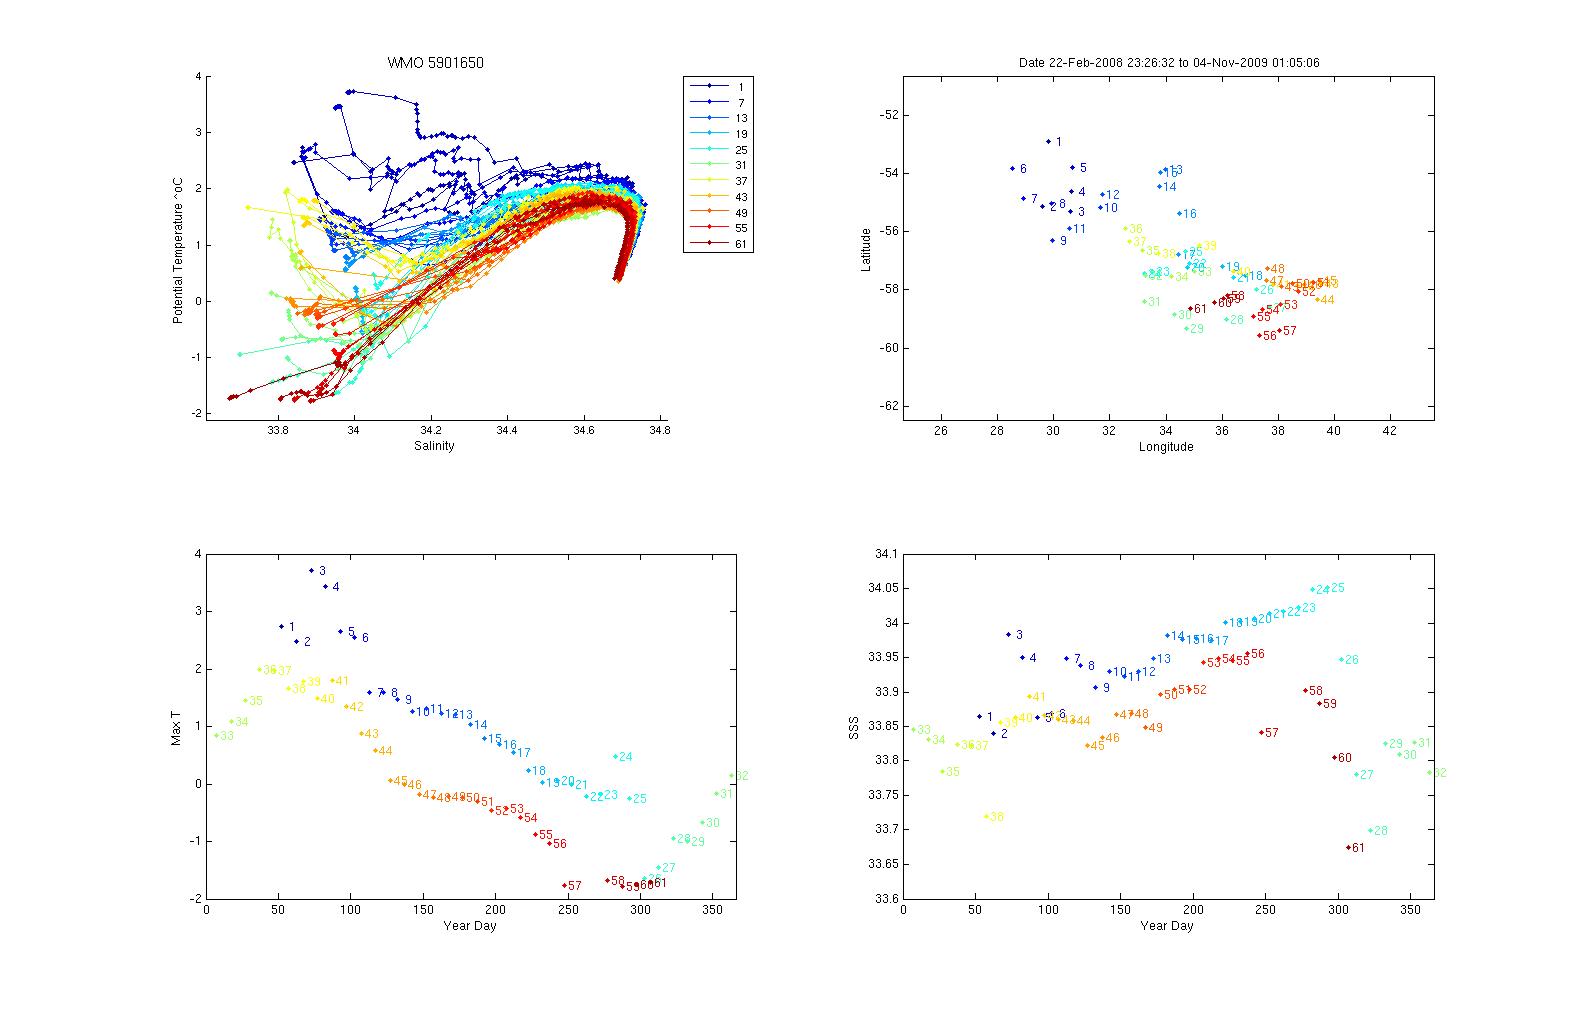
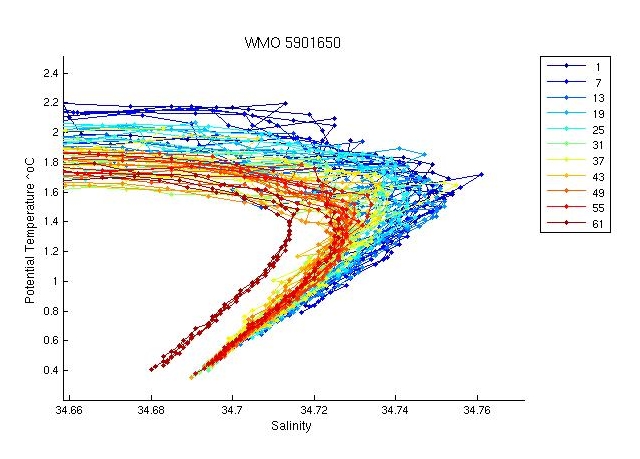
The plots below show the raw float salinity data (solid blue line) compared to neighbouring argo floats (coloured symbols) on a potential temperature surface of 0.9 degrees C. The locality map shows the location of the profiles for this float and for neighbouring floats.
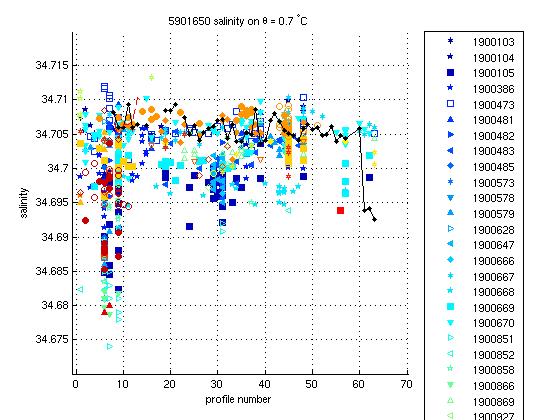
There is about a 0.01 to 0.015 spread in the salinities on a deep theta level. However this float is close to the two other floats deployed at a smilar time and given the variability of Southern Ocean fronts this is fine. The sharp fresh offset is most likely due to the float shifting closer to the continent into fresher water masses, several other southerly floats show similar values so do not think this is due to drift.
Section 12: Salinity Drift Assessment
This float required no salinity drift correction.
Section 13: Float Summary
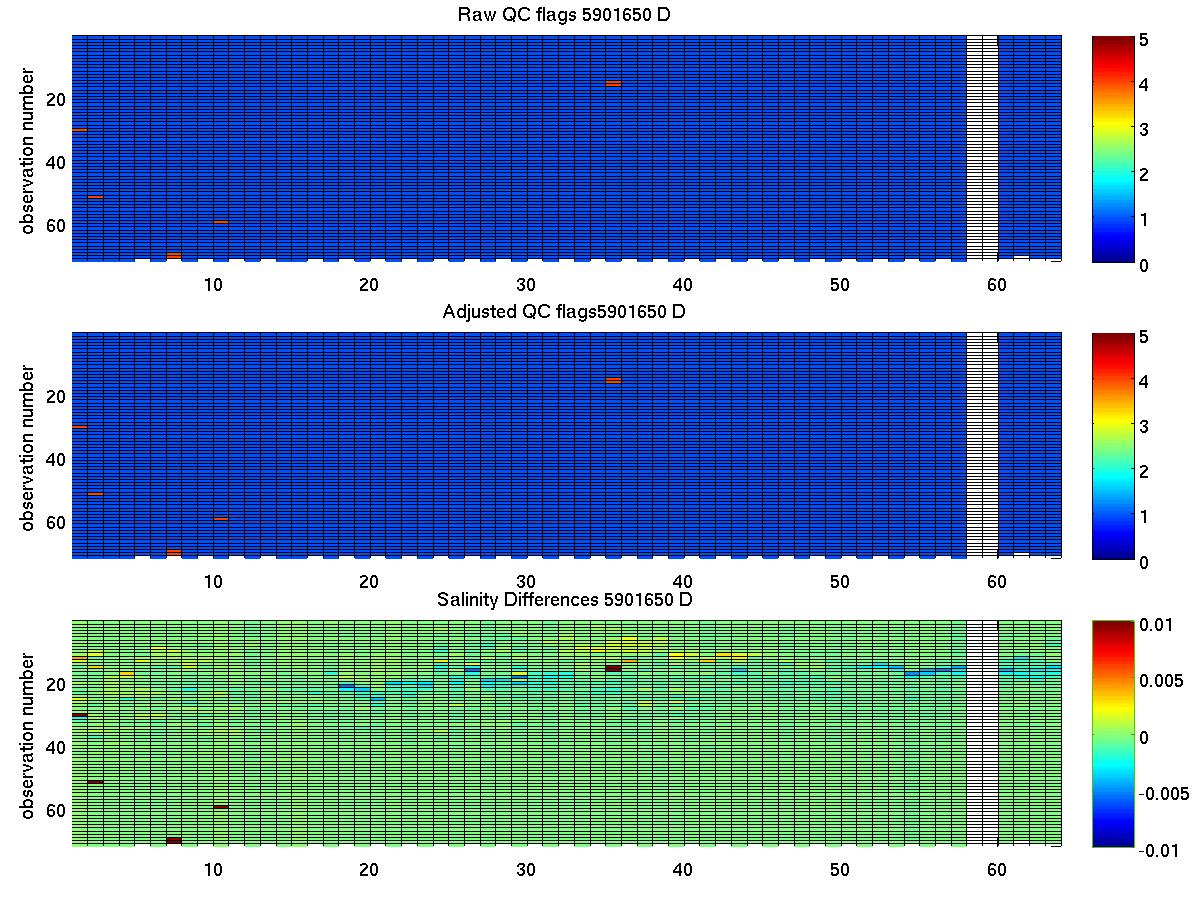
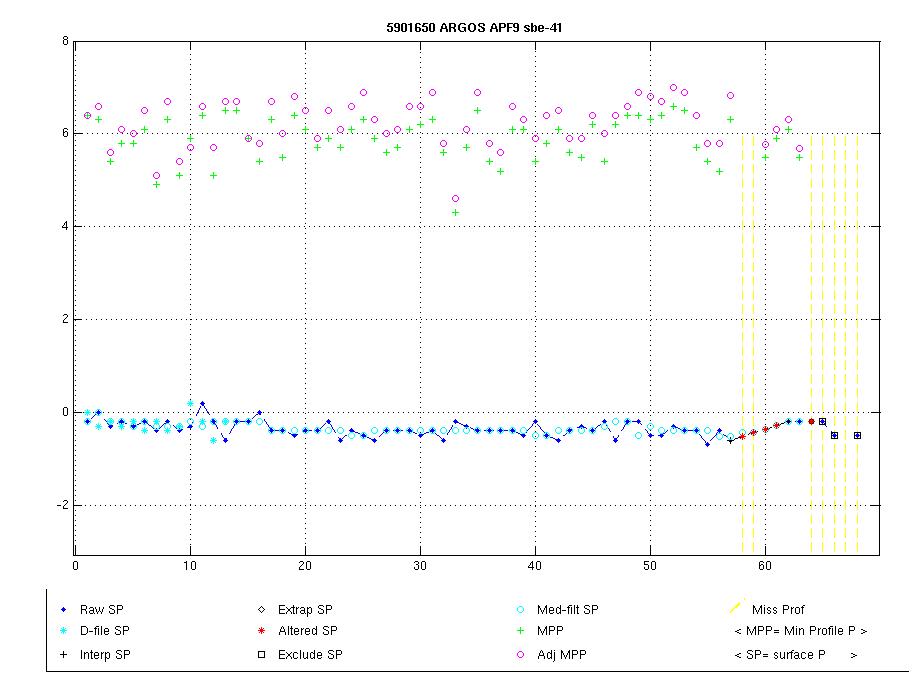
The plot below summarises the QC flags and salinity differences for the raw and adjusted salinity fields in the final delayed mode files submitted to the GDAC.
Created 27-07-2010