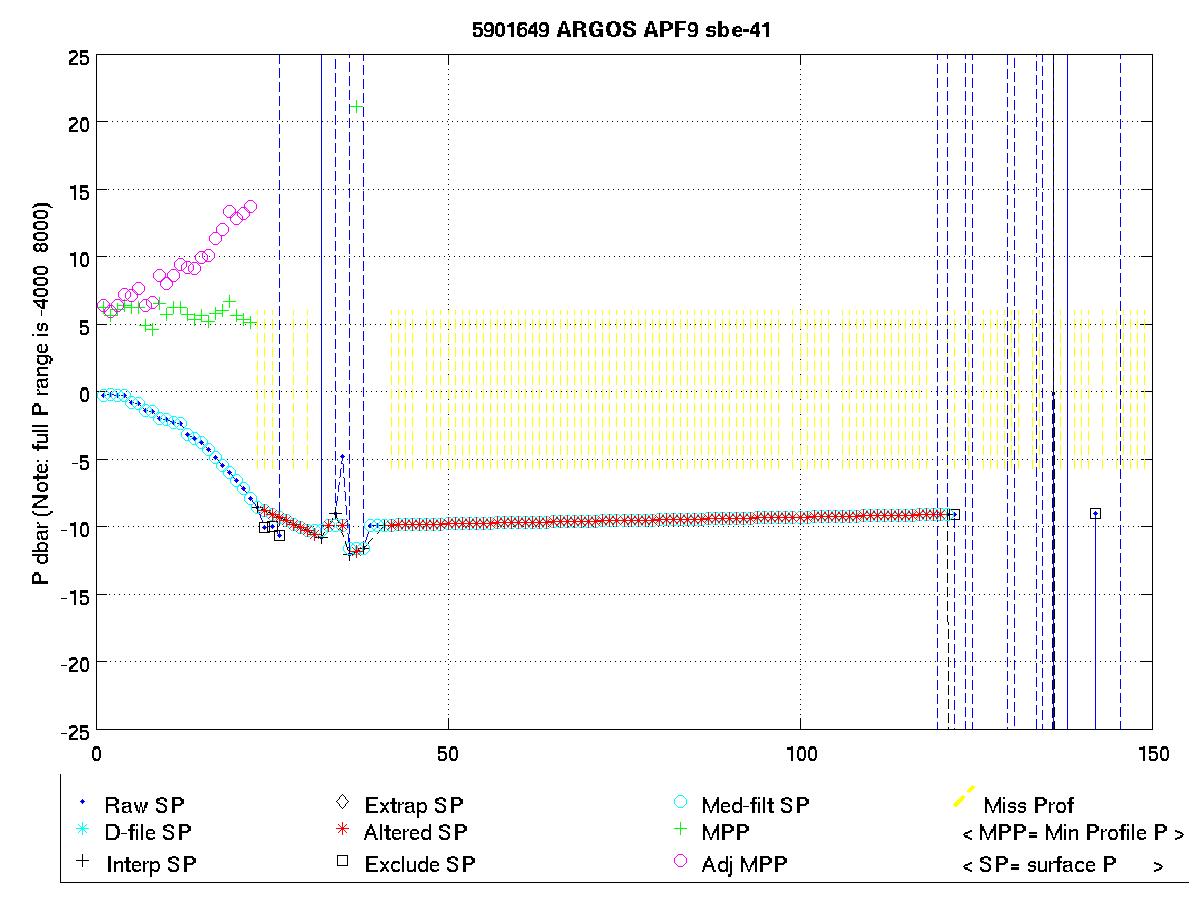
All profiles have been set to QC=4 for all parameters. This float has an errant pressure sensor caused by the Druck microleak issue that goes completely haywire at profile 23.
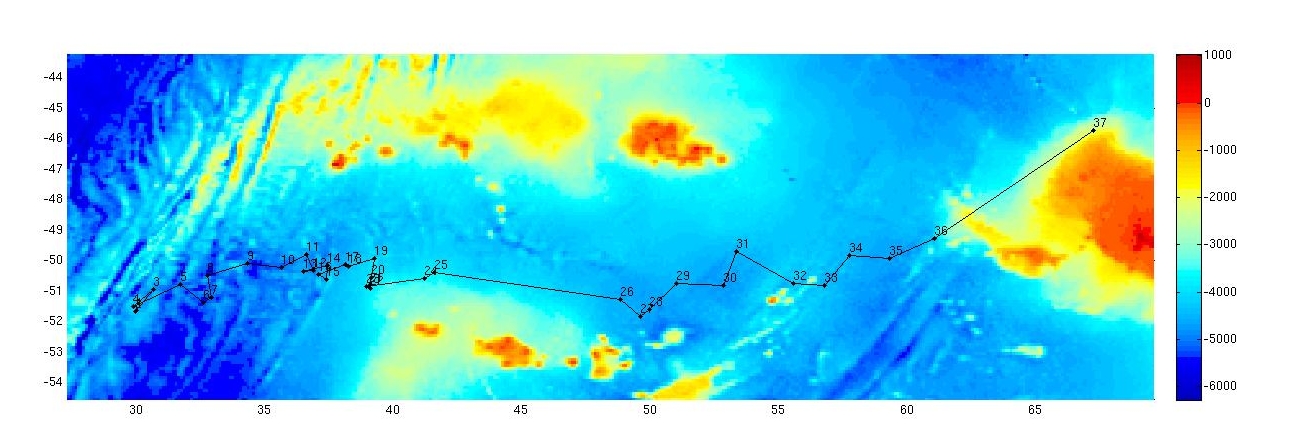
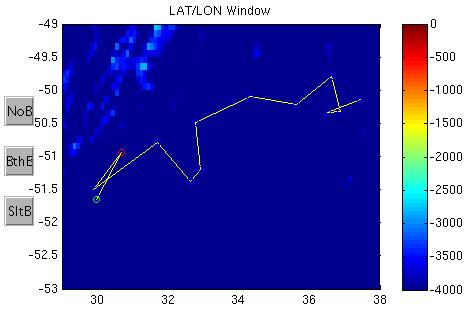
Float trajectory overlayed on bathymetry, (left) and over climatological salinity (right)
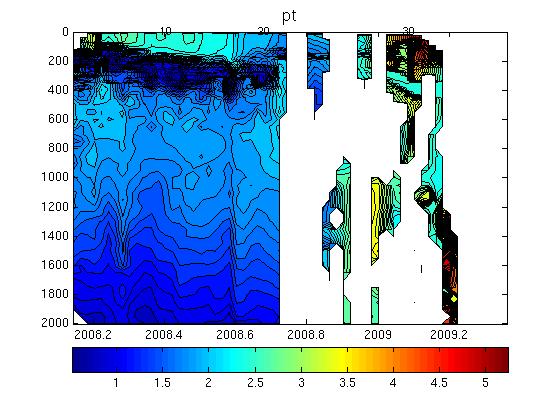
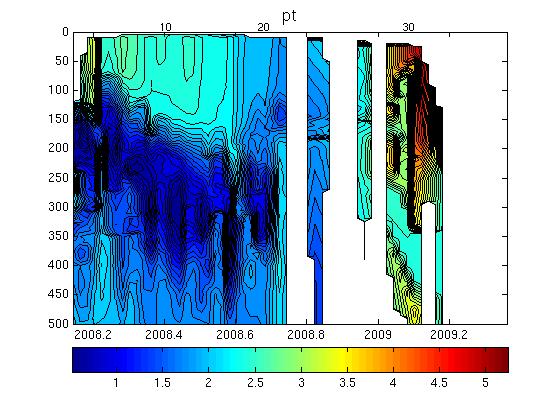
Potential temperature section with time, (left) surface to 2000m and (right) surface to 500m
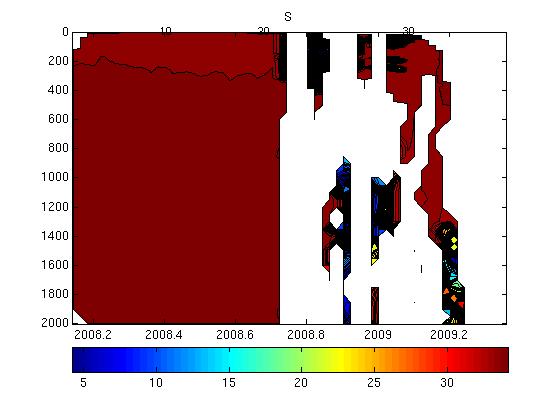
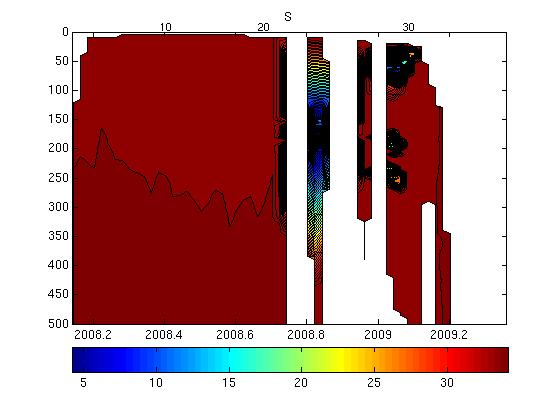
Salinity section with time, (left) surface to 2000m and (right) surface to 500m
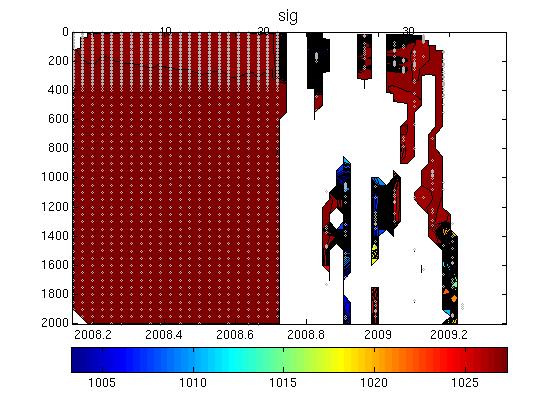
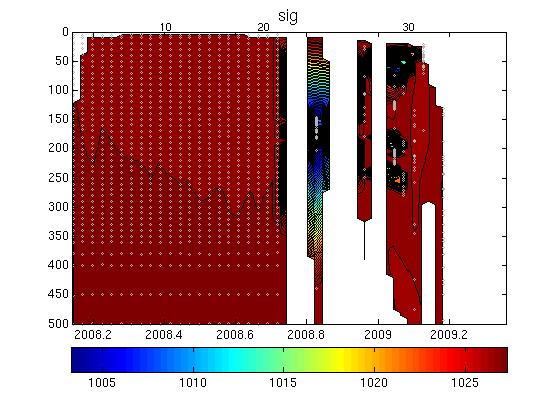
Potential density section with time, (left) surface to 2000m and (right) surface to 500m
Section 9: WJO/OW Results
The plot below shows the analysis of salinity drift using the WJO/OW software.

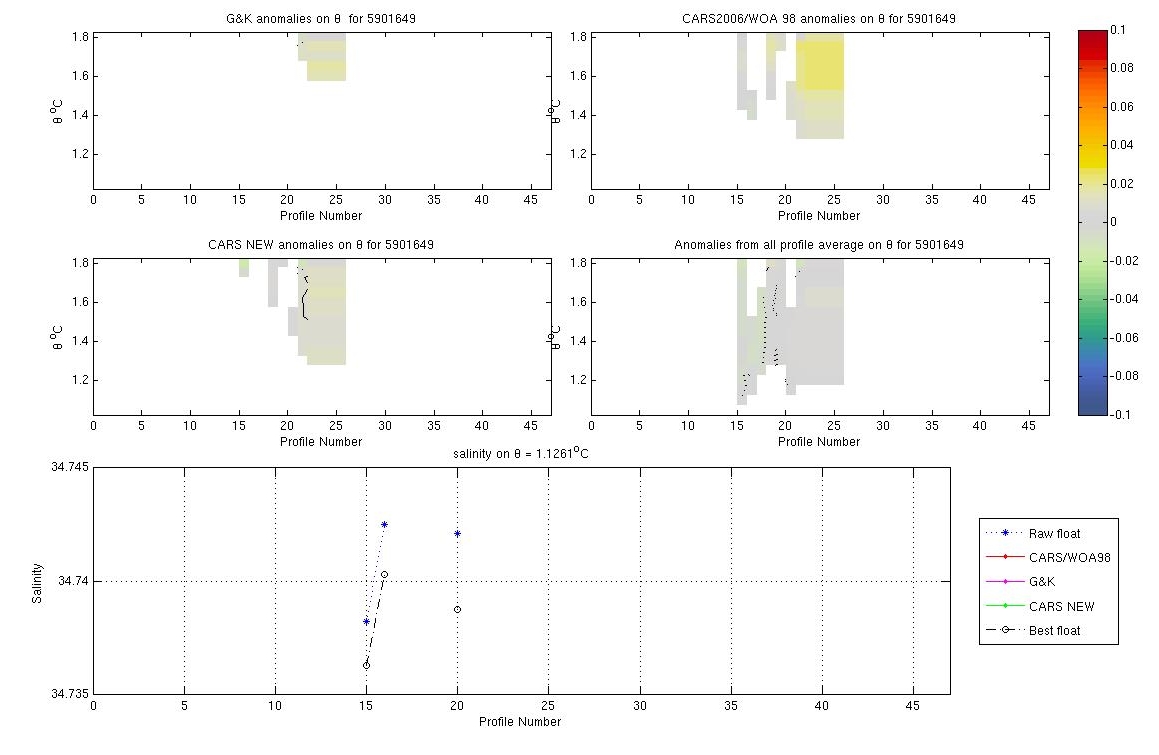
Section 10: Anomaly Plots
The four plots below show the salinity anomalies on theta surfaces compared to (a) the Gouretski and Kolterman climatology, (b) the CARS (CSIRO Atlas of Regional Seas)/WOA (World Ocean Atlas) climatology, (c) the anomalies within the float series itself, (i.e. the salinity anomaly of each profile from the mean profile average for the float and (d) the raw float salinity compared to the CARS and G&K climatological salinity on a theta surface of 0.xx degrees C.
Bad data, all parameters QC'd as 4.
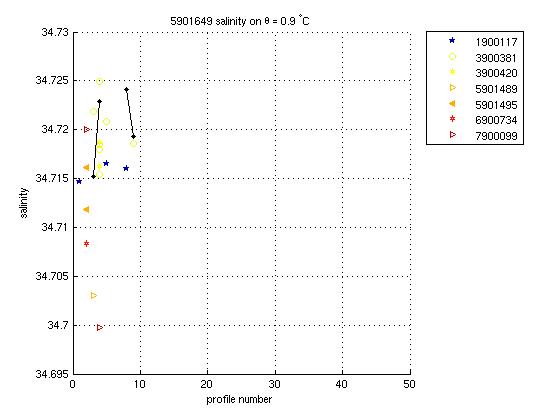
Section 11: Comparison with Nearby Argo
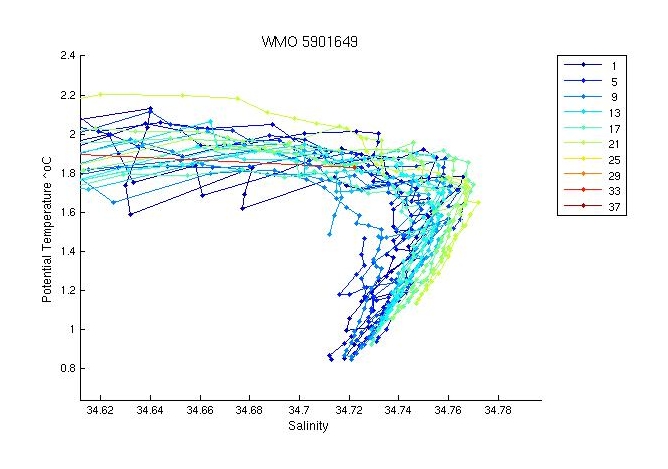
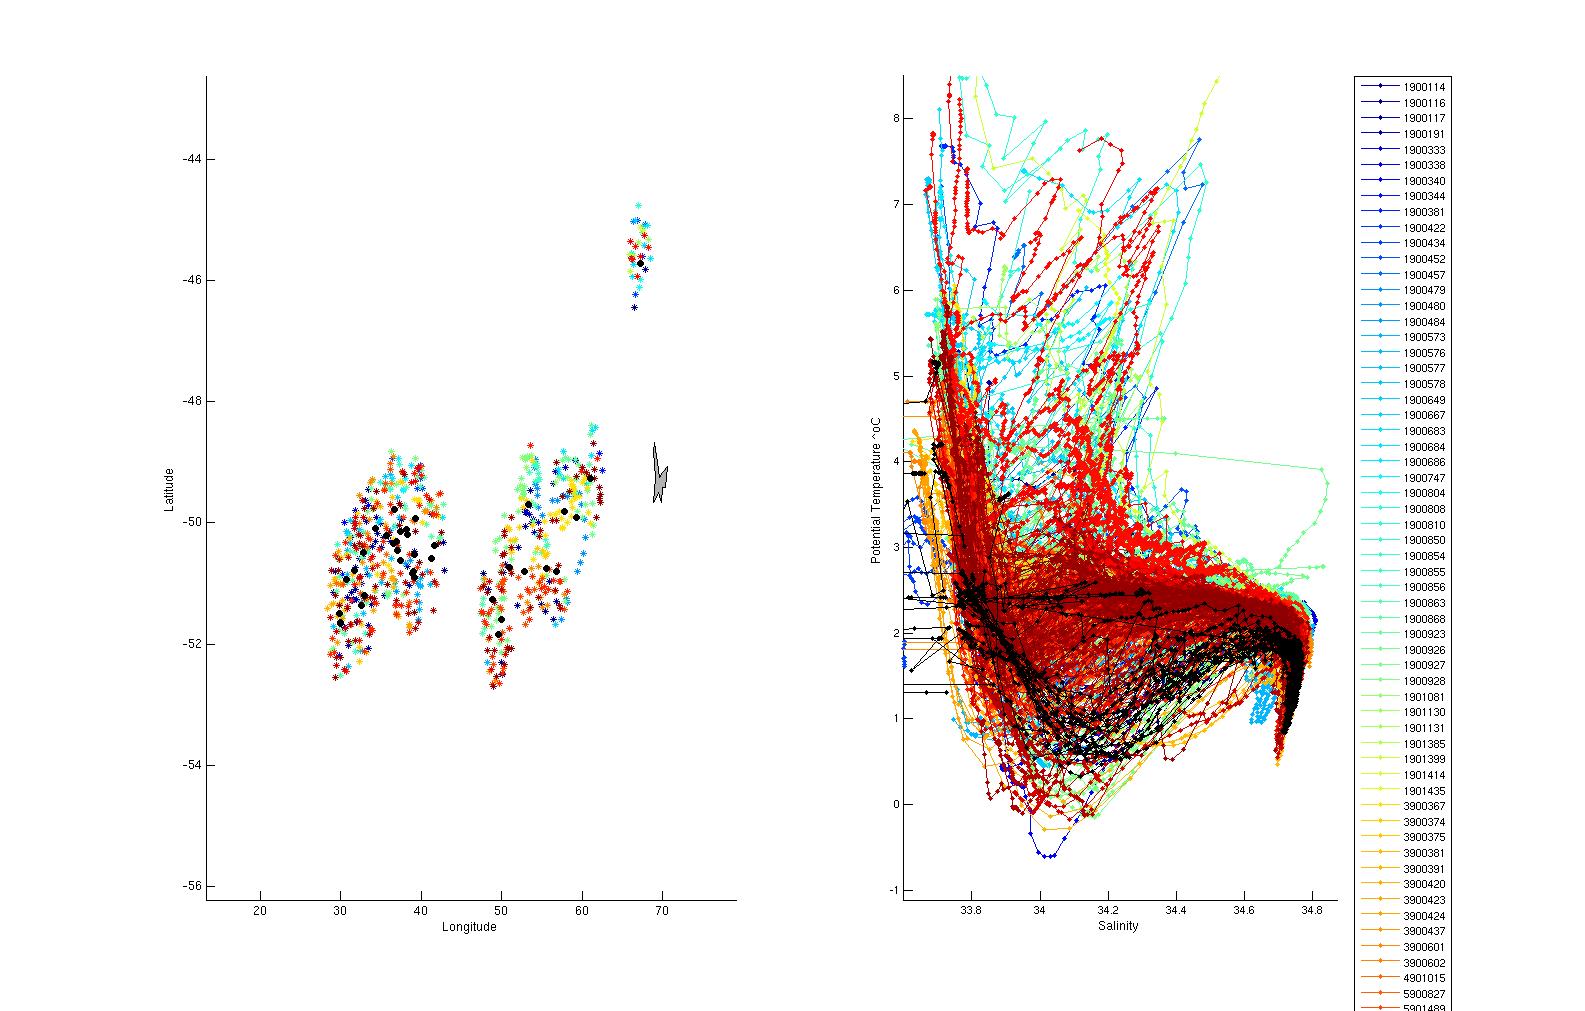
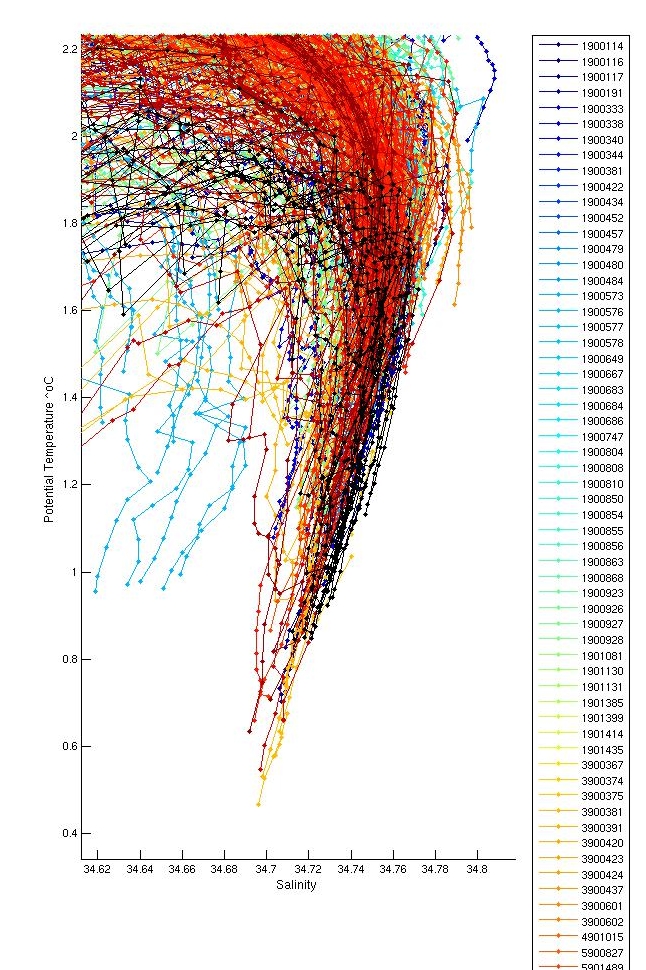
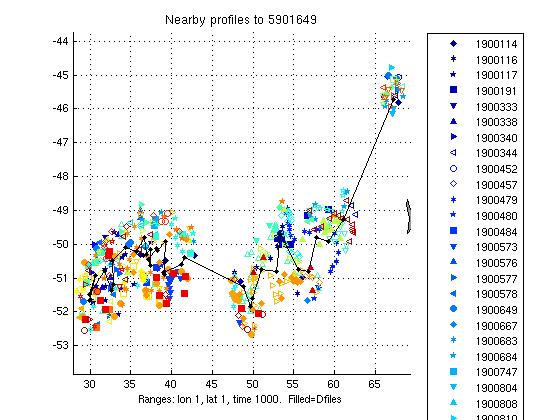
The plots below show the raw float salinity data (solid blue line) compared to neighbouring argo floats (coloured symbols) on a potential temperature surface of xx degrees C. The locality map shows the location of the profiles for this float and for neighbouring floats.
Anomalous data.
Section 12: Salinity Drift Assessment
This float is greylisted and all data is set to QC=4 for all parameters and all profiles.
Section 13: Float Summary
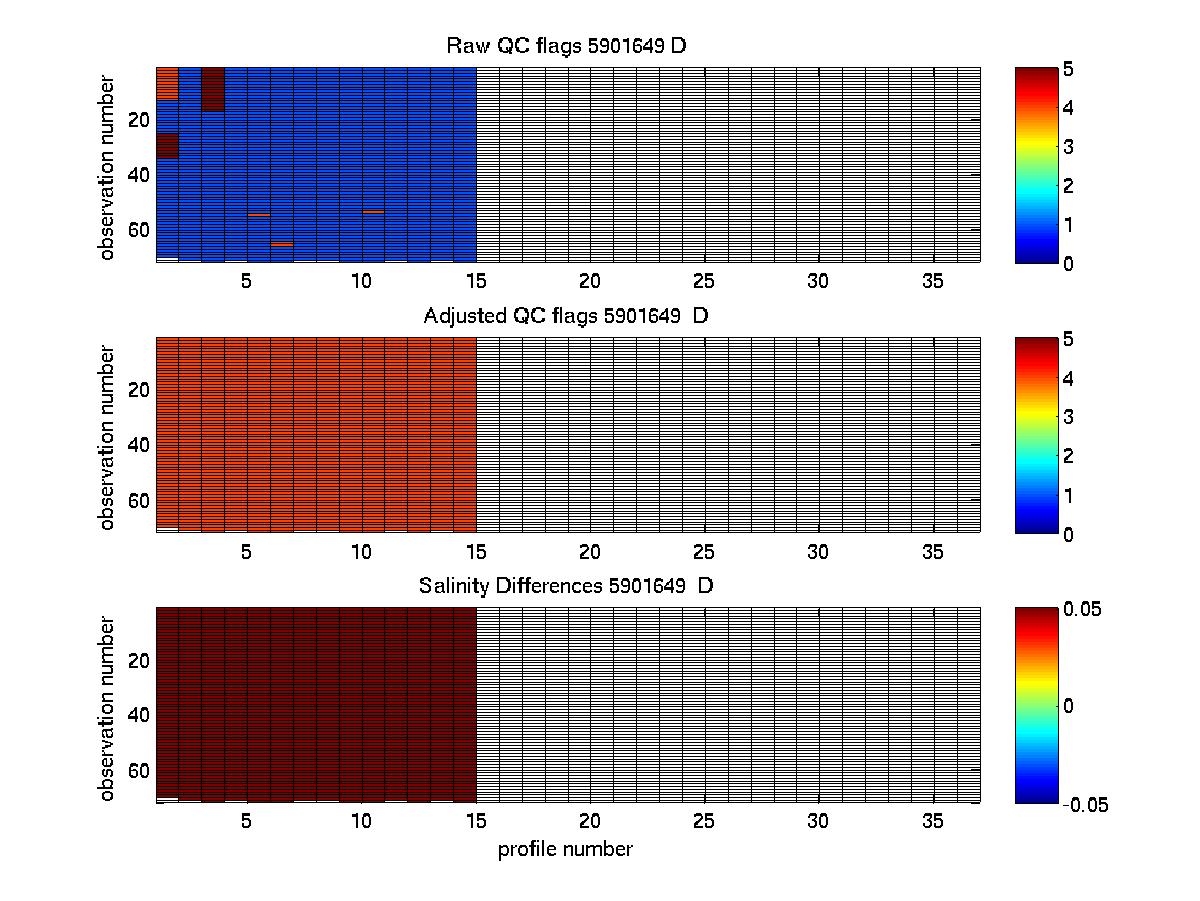
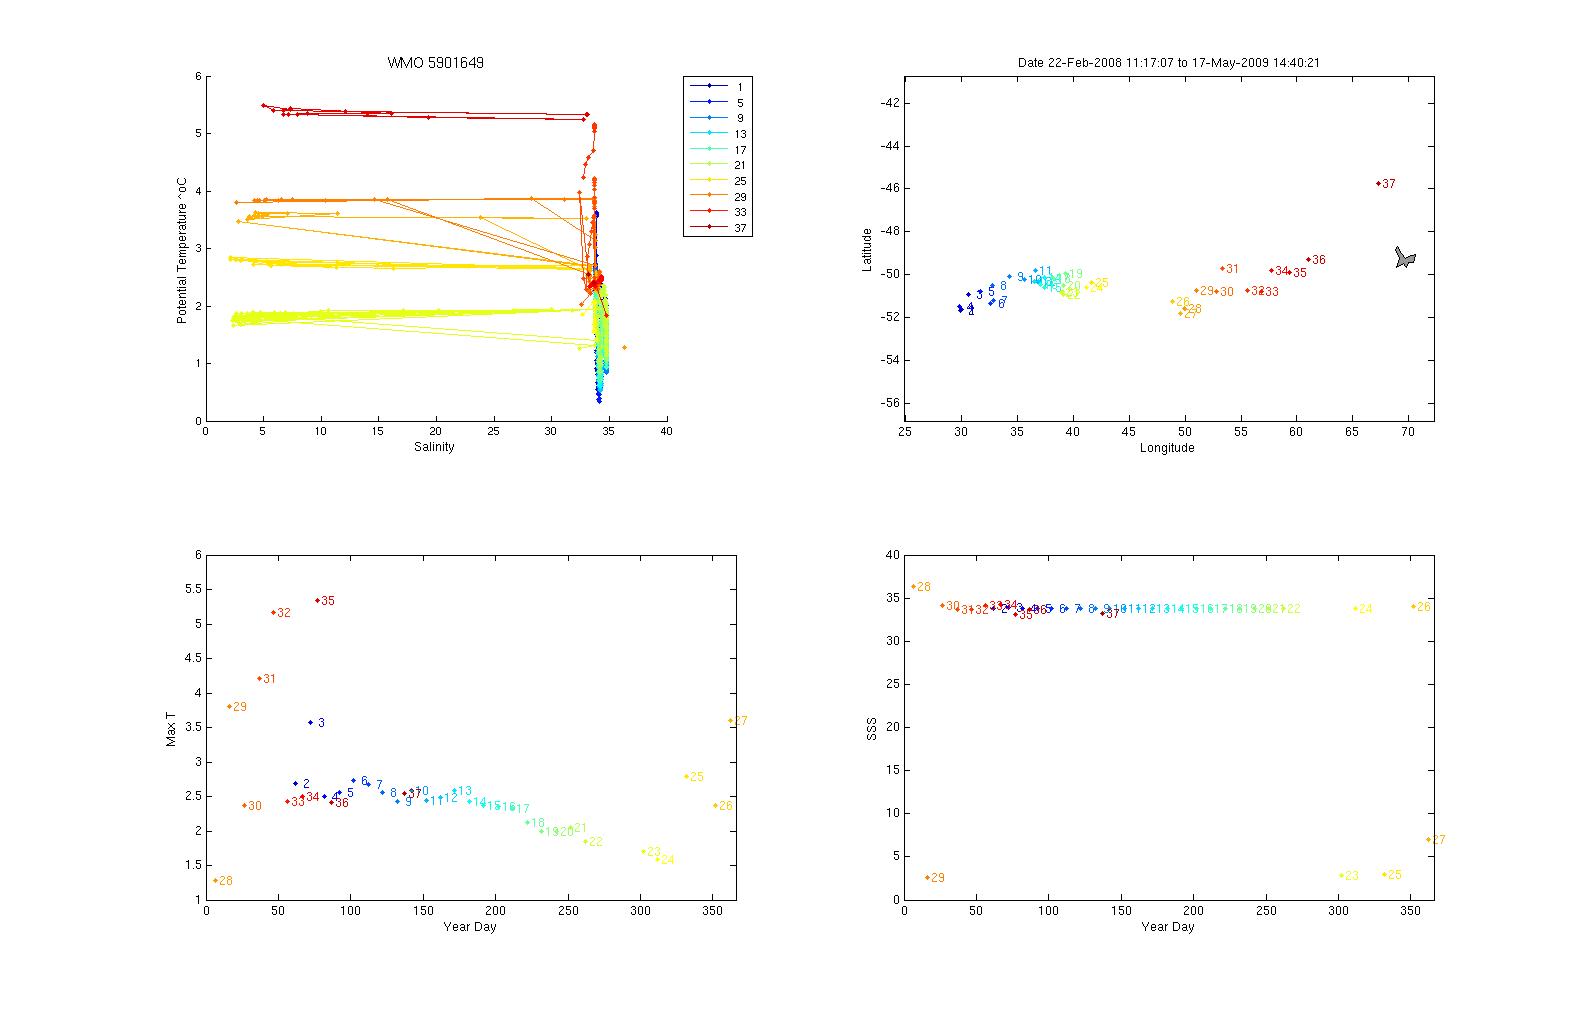
Problem Float! The plot below summarises the QC flags and salinity differences for the raw and adjusted salinity fields in the final delayed mode files submitted to the GDAC.
Created 06-08-2010