Float WMO_ID: 5901648

Float WMO_ID: 5901648


Table of Contents

  1. Float Information
  2. Float Location
  3. Surface Pressure
  4. Potential Temperature-Salinity Plot
  5. Temperature-Salinity Comparison with Nearby Floats
  6. Inversions
  7. Salt Hooks
  8. Parameter Sections and Initial QC Notes
  9. WJO/OW Results
  10. Anomaly Plot
  11. Comparison with Nearby Argo
  12. Salinity Drift Assessment
  13. Float Summary


Section 1: Float Information

The table below provides basic information about the float, including primary sensors, mission parameters and current status of profiles.


Institute CSIRO
Principal InvestigatorSusan Wijffels
Pressure SensorDruck (serial number=2458987)
CTD SensorAPEX-SBE-41 (serial number=3605)
CTD Sampling ModeBurst Sampler
Controller BoardAPF 9
Additional Sensors/SoftwareAanderaa Oxygen Optode 3830 serial number(881)
Park Depth1000 m
Profile Depth2000 m
Launch Date17-01-2008
Number of D-moded Profiles74
Calibration Date27-07-2010
Pressure DriftSurface Pressure Offset corrected
Salinity DriftNo salinity drift detected


Section 2: Float Location

Float trajectory and location plot

This float was located to the east of the Kerguelen Plateau in the Southern Indian Ocean in a region bounded by 76 to 95 ºE and 45 to 50 º S.


Section 3: Reported Surface Pressure

The surface pressure for this float is shown in the plot below. There is no discernible drift in the value of the Surface Pressure Offset.


Surface Pressure plot

Section 4: Potential Temperature-Salinity Plot

Potential Temperature-Salinity (a), Location (b, Max Temperature (c) and Sea Surface Salinity (d) plots located below.

Potential Temperature-Salinity, Location and Max Temperature and Sea Surface Salinity plots

Surface temperatures generally varied between 6.5 and 10.5 ºC and surface salinities from 33.6 to 34.6.


The plot below shows the potential-temperature/salinity curve for the deepest theta levels where the relationship between the two parameters should show the least variation.

Potential Temperature-Salinity deepest theta levels plot

The deep profiles look reasonable.


Section 5: Temperature-Salinity Comparison with Nearby Floats

The two plots below show a). the location of this float (black circles) in relation to the position of other nearby argo floats (coloured circles) and b). The potential-temperature/salinity curve for this float (in black) compared to nearby argo floats (coloured).

Potential Temperature-Salinity nearby comparison plot

The potential-temperature/salinity curve for the deepest theta levels for this float (in black) and nearby argo floats (coloured) is displayed below.


Potential Temperature-Salinity nearby deep comparison plot

This float looks fine compared to neighbouring floats.


Section 6: Inversions

There was one inversion in profile 12 at 30 m which was QC'd as 4 for both T & S.


Section 7: Salt Hooks

Salt hooks were located in profiles; 4,6,7,11,14,16,25,31,33,35,39,43,51,59,63,67,73. These were flagged as QC 4 for both T & S.


Section 8: Parameter Sections and Initial QC Notes

The float grounded on profiles; 1, 2, 3, 21 and 22. A few near bottom values were flagged as QC4 in profiles 1 and 2 which grounded.


Float trajectory overlayed on bathymetry, (left) and over climatological salinity (right)
Float trajectory and bathymetry plot


Potential temperature section with time, (left) surface to 2000m and (right) surface to 500m

Potential Temperature Plot - Full Depth Range Potential Temperature Plot - Surface to 500m

Salinity section with time, (left) surface to 2000m and (right) surface to 500m

Salinity Plot - Full Depth Range Salinity Plot - Surface to 500m

Potential density section with time, (left) surface to 2000m and (right) surface to 500m

Potential Density Plot - Full Depth Range Potential Density Plot - Surface to 500m

Section 9: WJO/OW Results

The plot below shows the analysis of salinity drift using the WJO/OW software.


WJO/OW plot

.


Section 10: Anomaly Plots

The four plots below show the salinity anomalies on theta surfaces compared to (a) the Gouretski and Kolterman climatology, (b) the CARS (CSIRO Atlas of Regional Seas)/WOA (World Ocean Atlas) climatology, (c) the anomalies within the float series itself, (i.e. the salinity anomaly of each profile from the mean profile average for the float and (d) the raw float salinity compared to the CARS and G&K climatological salinity on a theta surface of 2.27 degrees C.


Anomaly Plot

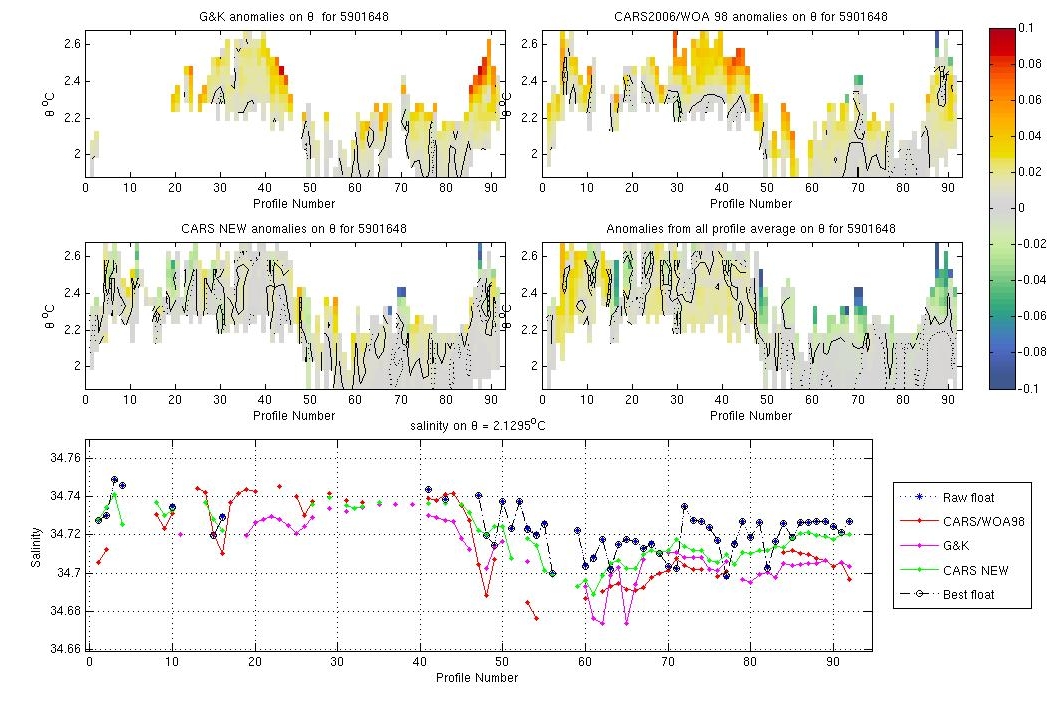
This float is similar to climatology. There is a large spread (up to 0.02) in the salinity data between some profiles as the float straddles a front.


Section 11: Comparison with Nearby Argo

The plots below show the raw float salinity data (solid blue line) compared to neighbouring argo floats (coloured symbols) on a potential temperature surface of 2.2 degrees C. The locality map shows the location of the profiles for this float and for neighbouring floats.


Nearby Argo Comparison Plot Nearby Argo Location Plot

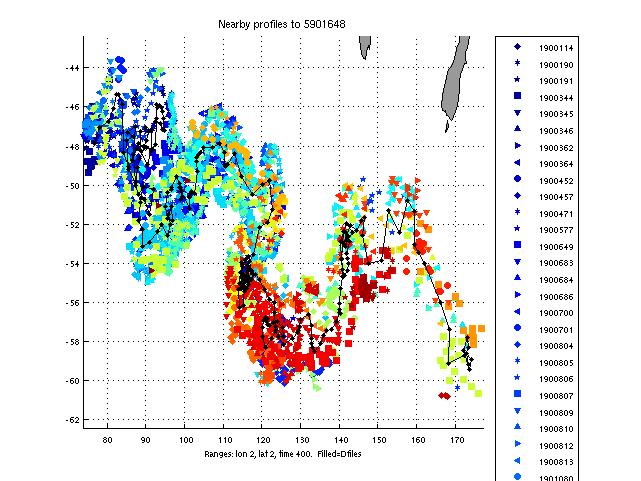
High variability region, and high variability in the float record - however this float looks reasonable given the wide spread evident in the data.


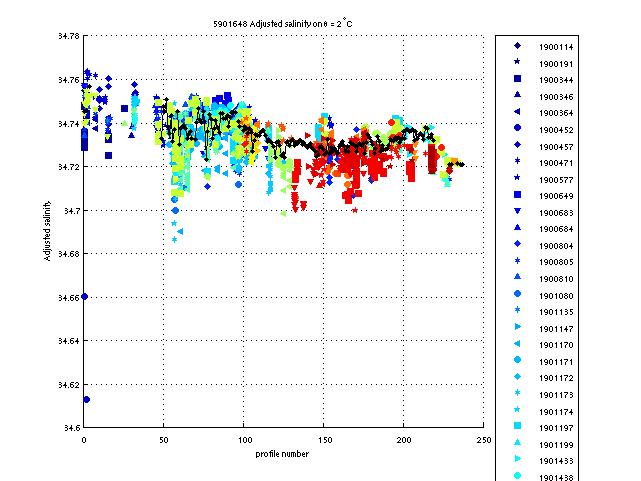
Section 12: Salinity Drift Assessment

This float required no salinity drift correction.


Section 13: Float Summary

Final Check Plot

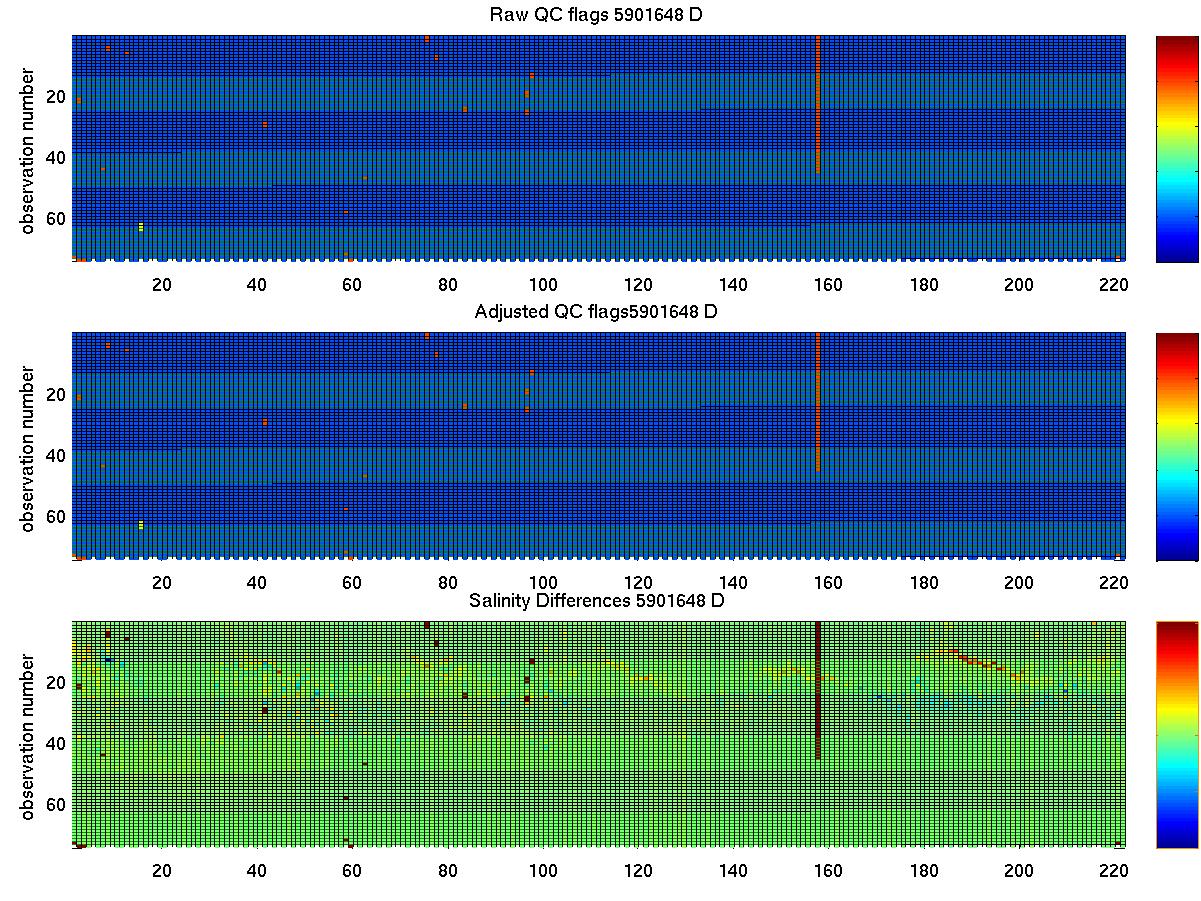
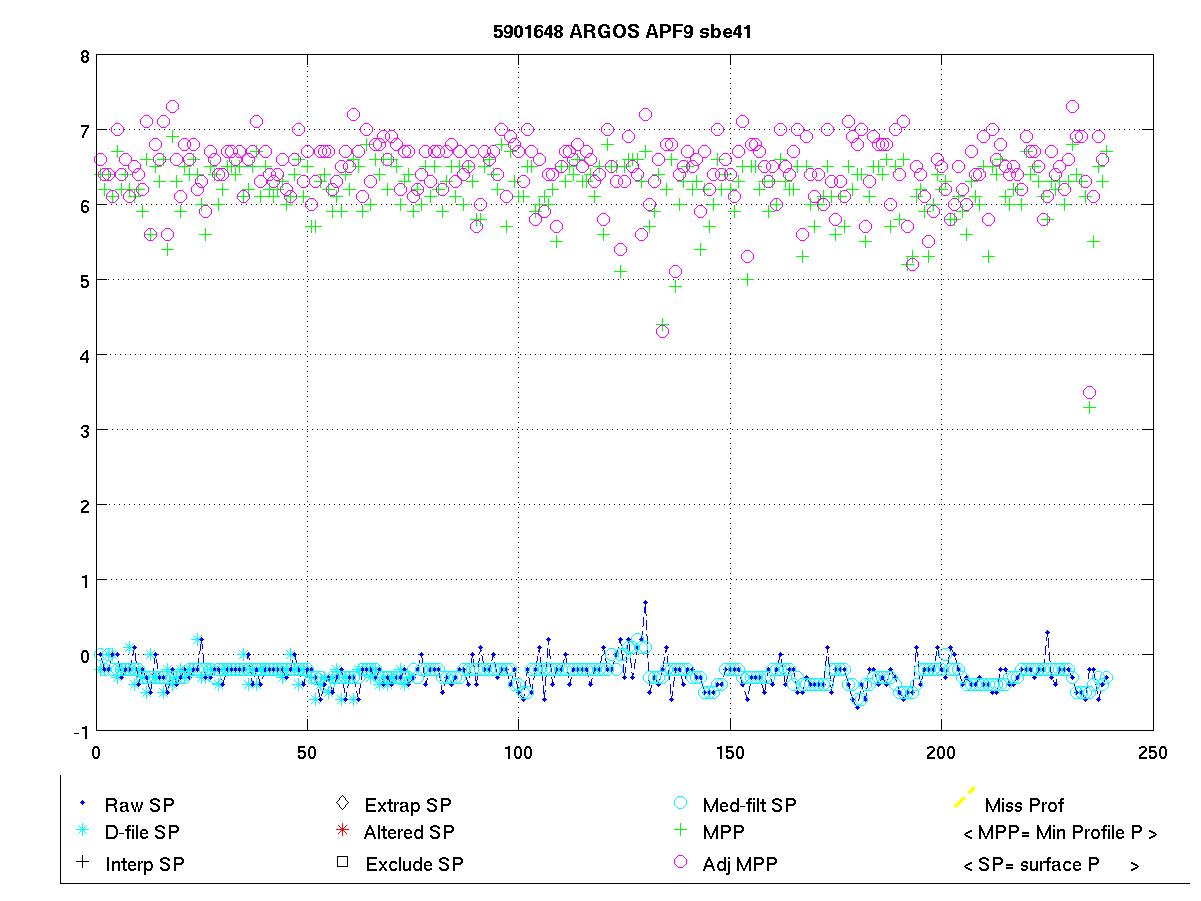
The plot below summarises the QC flags and salinity differences for the raw and adjusted salinity fields in the final delayed mode files submitted to the GDAC.


Created 27-07-2010