The table below provides basic information about the float, including primary sensors, mission parameters and current status of profiles.
| Institute | CSIRO |
| Principal Investigator | Susan Wijffels |
| Pressure Sensor | Druck (serial number=2458985) |
| CTD Sensor | APEX-SBE-41 (serial number=3604) |
| CTD Sampling Mode | Burst Sampler |
| Controller Board | APF 9 |
| Additional Sensors/Software | Aanderaa Oxygen Optode 3830 serial number(880) |
| Park Depth | 1000 m |
| Profile Depth | 2000 m |
| Launch Date | 13-01-2008 |
| Number of D-moded Profiles | 75 |
| Calibration Date | 27-07-2010 |
| Pressure Drift | Surface Pressure Offset corrected |
| Salinity Drift | No salinity drift detected |

This float was deployed to the east of the northern Kerguelen Plateau in an area bounded by 70 to 120 şE and 44 to 54 ş S.
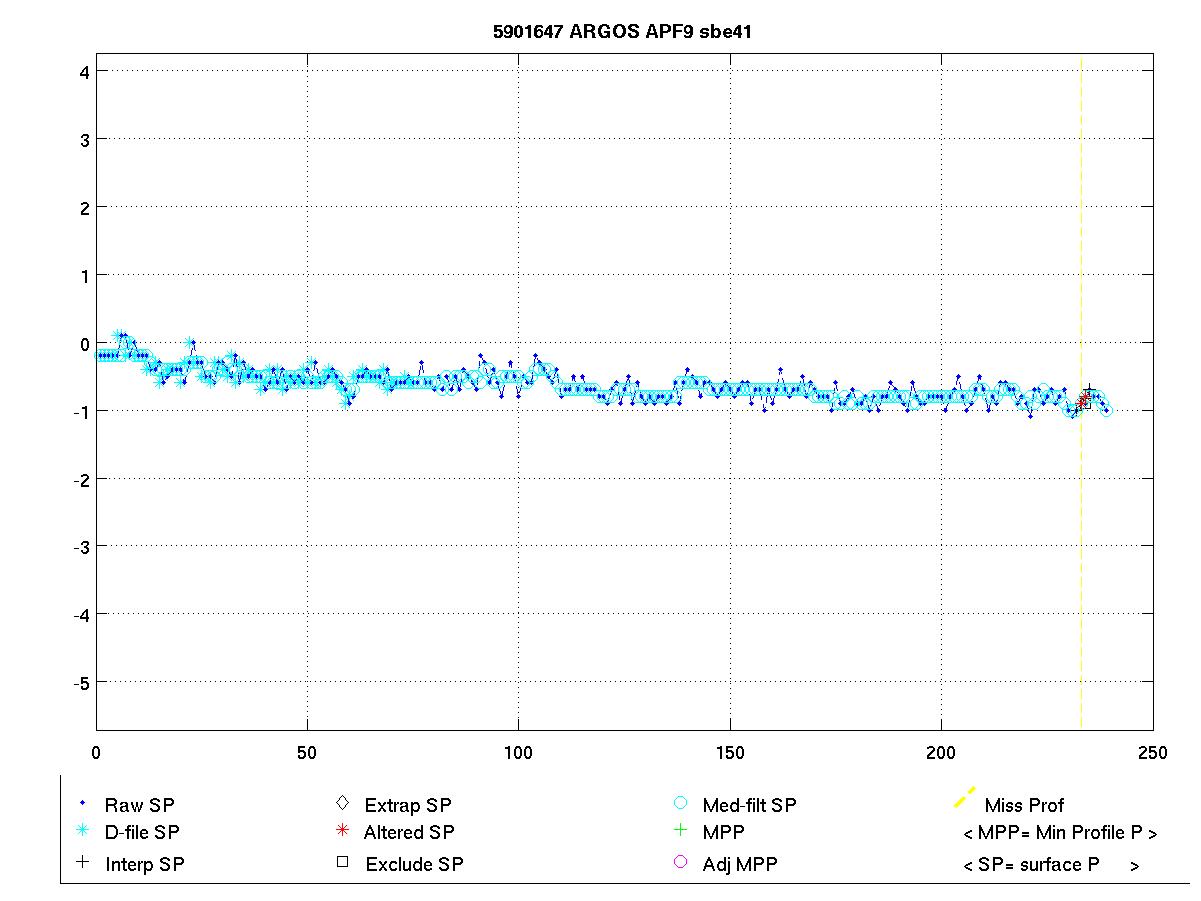
The surface pressure for this float is shown in the plot below. There is no drift in the surface pressure offset.
Potential Temperature-Salinity (a), Location (b, Max Temperature (c) and Sea Surface Salinity (d) plots located below.

Surface temperatures generally varied between 1 and 12 şC and surface salinities from 33.6 to 34.2.
The plot below shows the potential-temperature/salinity curve for the deepest theta levels where the relationship between the two parameters should show the least variation.

There is a very large spread in the profiles, particularly in temperature.
The two plots below show a). the location of this float (black circles) in relation to the position of other nearby argo floats (coloured circles) and b). The potential-temperature/salinity curve for this float (in black) compared to nearby argo floats (coloured).

The potential-temperature/salinity curve for the deepest theta levels for this float (in black) and nearby argo floats (coloured) is displayed below.

There is a large spread in the profiles at depth however it seems comparable to neighbouring floats especially given the distance this flaot has traversed.
There were two inversions in profile 3; one at the surface and one in the mixed layer. None of these were significant and there were not flagged.
Salt hooks were located in profiles; 6, 8, 11, 12 and 15. These were flagged as QC 4 for both T & S.
Real-time software flagged a couple of points in middwater in profile 12 as bad. Checked these and they appear good, so changed back to QC=1. Profile 6 looks dodgy, therefore QC the upper half of the profile as QC=4 for both T & S. Profile 5 had a spike at 110 m depth in T & S so QC'd this as 4.


The plot below shows the analysis of salinity drift using the WJO/OW software.

The four plots below show the salinity anomalies on theta surfaces compared to (a) the Gouretski and Kolterman climatology, (b) the CARS (CSIRO Atlas of Regional Seas)/WOA (World Ocean Atlas) climatology, (c) the anomalies within the float series itself, (i.e. the salinity anomaly of each profile from the mean profile average for the float and (d) the raw float salinity compared to the CARS and G&K climatological salinity on a theta surface of 1.89 degrees C.
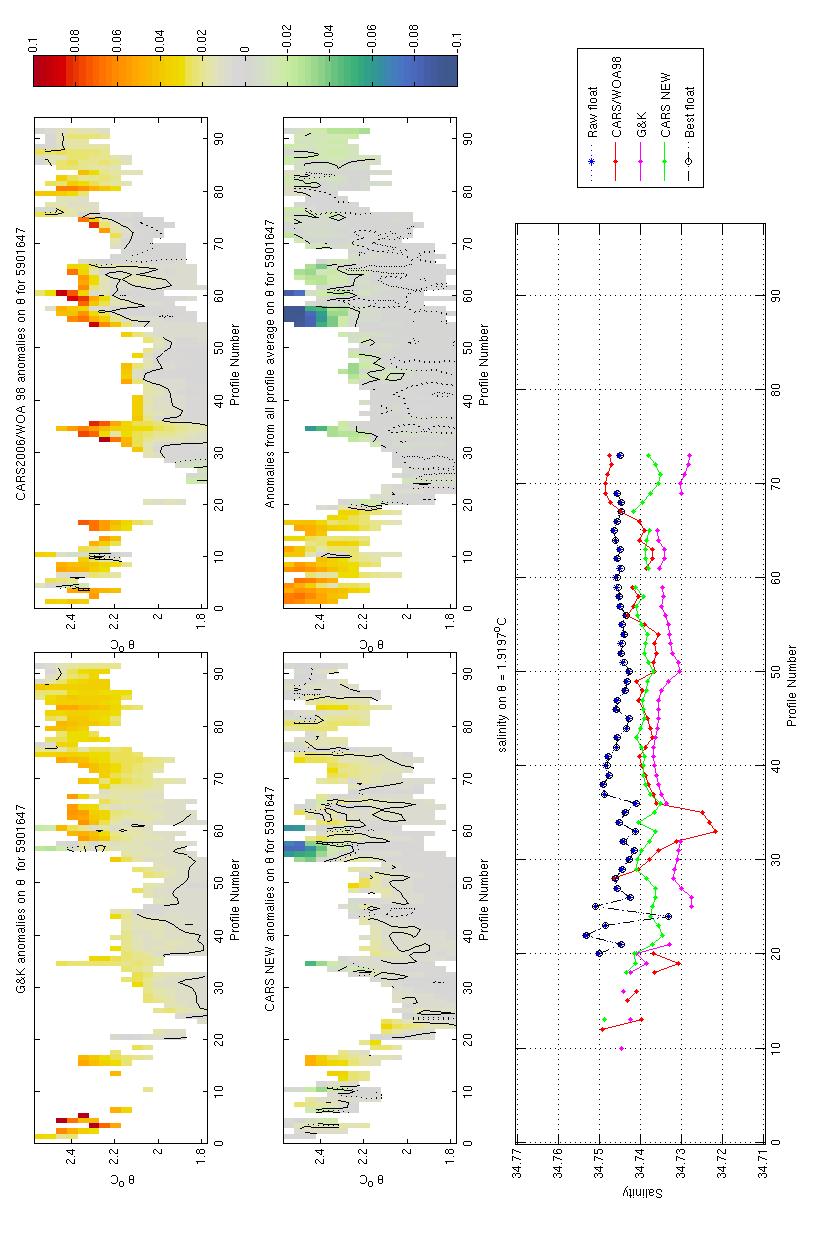
Float is close to climatologies.
The plots below show the raw float salinity data (solid blue line) compared to neighbouring argo floats (coloured symbols) on a potential temperature surface of 2.2 degrees C. The locality map shows the location of the profiles for this float and for neighbouring floats.
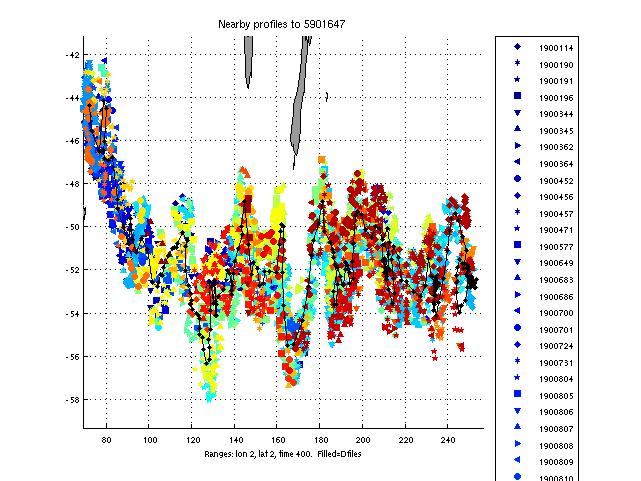
There is a large spread in the salinity data (up to 0.03). The float is towards the upper end of the spectrum but looks fine.
In the absence of further information do not correct this float for salinity drift.
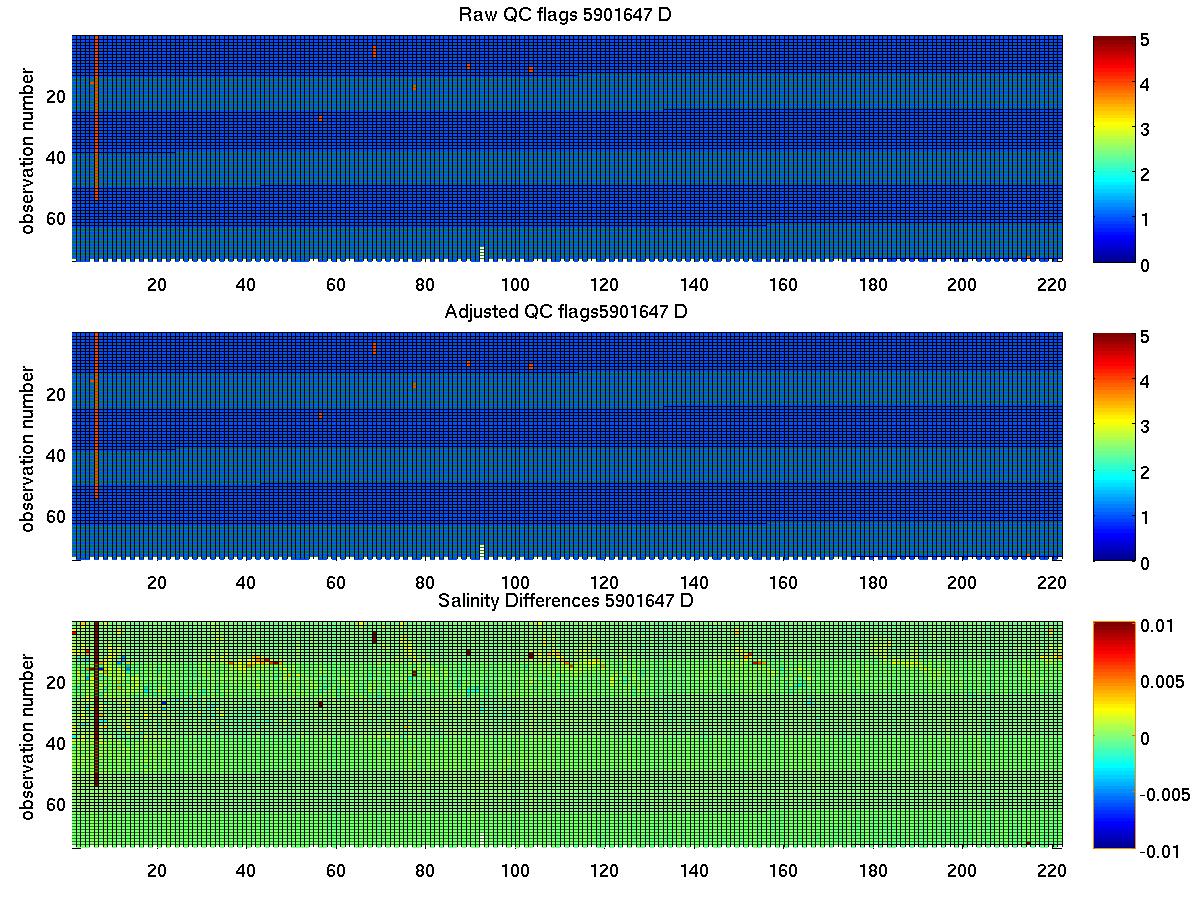
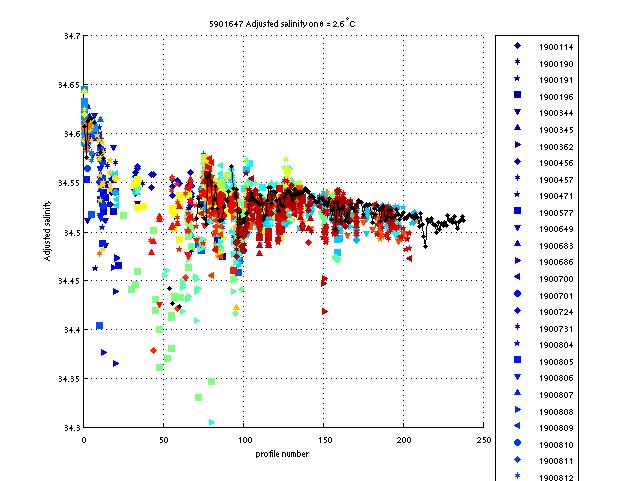
The plot below summarises the QC flags and salinity differences for the raw and adjusted salinity fields in the final delayed mode files submitted to the GDAC.
Created 27-07-2010