The table below provides basic information about the float, including primary sensors, mission parameters and current status of profiles.
| Institute | CSIRO |
| Principal Investigator | Susan Wijffels |
| Pressure Sensor | Druck (serial number=2458984) |
| CTD Sensor | APEX-SBE-41 (serial number=3603) |
| CTD Sampling Mode | Burst Sampler |
| Controller Board | APF 9 |
| Additional Sensors/Software | Aanderaa Oxygen Optode 3830 serial number(876) |
| Park Depth | 1000 m |
| Profile Depth | 2000 m |
| Launch Date | 08-01-2008 |
| Number of D-moded Profiles | 75 |
| Calibration Date | 27-07-2010 |
| Pressure Drift | Surface Pressure Offset corrected |
| Salinity Drift | No salinity drift detected |

This float was deployed to the north of the Kerguelen Plateau in the Southern Indian ocean in an area bounded by 62 to 95 şE and 41 to 45 ş S.
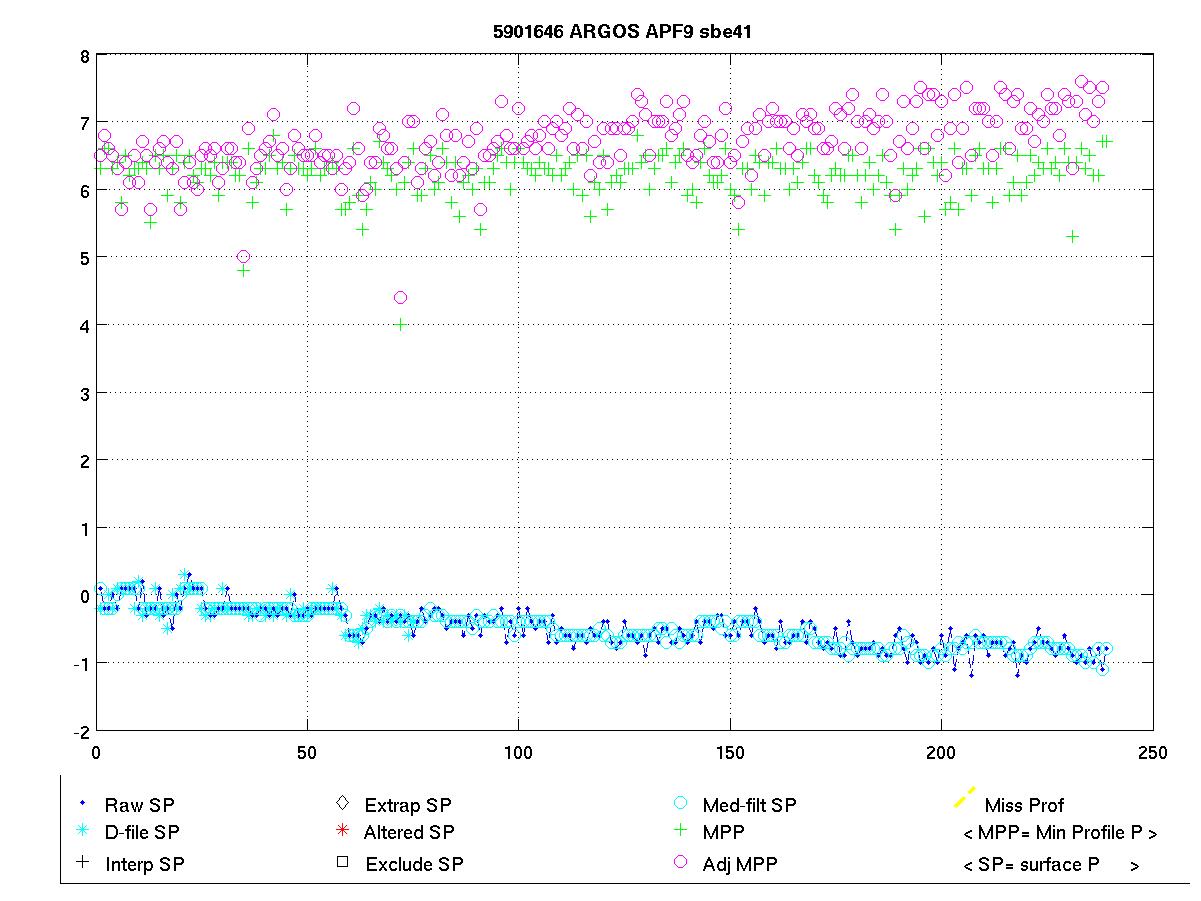
The surface pressure for this float is shown in the plot below. There is no indication of a drift in the value of the Surface Pressure Offset.
Potential Temperature-Salinity (a), Location (b, Max Temperature (c) and Sea Surface Salinity (d) plots located below.

Surface temperatures generally varied between 9 and 17 şC and surface salinities from 34.1 to 35.2.
The plot below shows the potential-temperature/salinity curve for the deepest theta levels where the relationship between the two parameters should show the least variation.

The deep profiles look fine. There is a noticeable fresh intrusion in some of the early profiles at depth.
The two plots below show a). the location of this float (black circles) in relation to the position of other nearby argo floats (coloured circles) and b). The potential-temperature/salinity curve for this float (in black) compared to nearby argo floats (coloured).

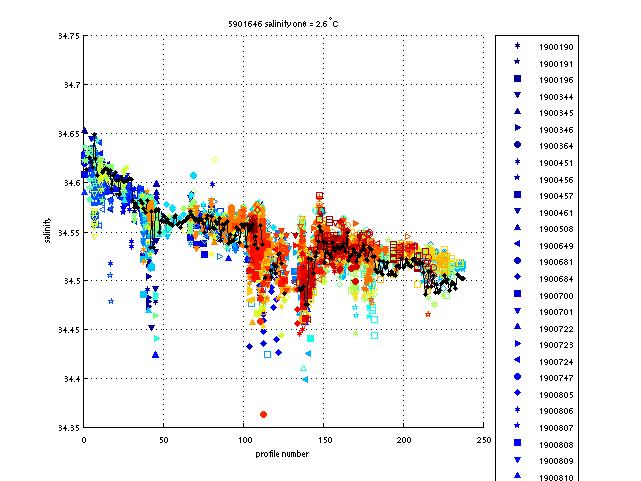
The potential-temperature/salinity curve for the deepest theta levels for this float (in black) and nearby argo floats (coloured) is displayed below.

The fresh intrusions at depth between 2.6 and 3 degrees C occur over more than one profile (11 to 13) and over multiple values and are therefore probably reeal. Similar intrusions are seen in neighbouring profiles hence we leave these in.
There were no inversions.
Salt hooks were located in profiles; 1,4,12,17,19,22,24,28,33,35,37,41,47,50,69. These were flagged as QC 4 for both T & S.
The float did not ground anywhere but had a couple of shortened profiles. Profile 13 had unusually low salinity values below the thermocline. This could be real as the float may have crossed into an eddy or front as the water properties here are similar to those from profile 30 onwards. However this could also be due to gunk in the cell and to be conservative these values were QC'd as 4. The top part of profile 3 has been QC'd as 4 as this looks suspicious - see neighbouring TS plot.


The plot below shows the analysis of salinity drift using the WJO/OW software.

The four plots below show the salinity anomalies on theta surfaces compared to (a) the Gouretski and Kolterman climatology, (b) the CARS (CSIRO Atlas of Regional Seas)/WOA (World Ocean Atlas) climatology, (c) the anomalies within the float series itself, (i.e. the salinity anomaly of each profile from the mean profile average for the float and (d) the raw float salinity compared to the CARS and G&K climatological salinity on a theta surface of 0.xx degrees C.
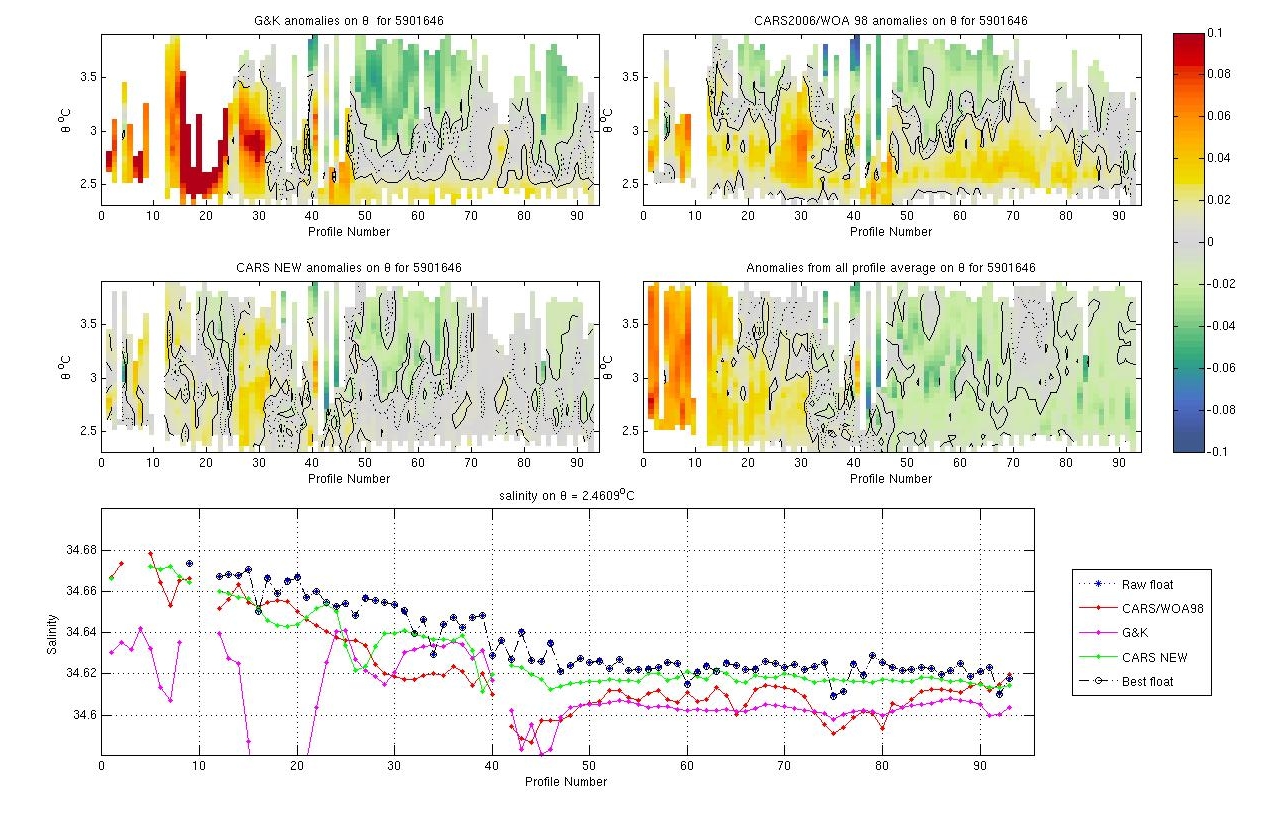
This float is similar to CARS initially and then salty offset by about 0.02-0.03. The float is salt offset by about 0.04 from G&K. However the float data seems reasonable and does not require correction.
The plots below show the raw float salinity data (solid blue line) compared to neighbouring argo floats (coloured symbols) on a potential temperature surface of xx degrees C. The locality map shows the location of the profiles for this float and for neighbouring floats.
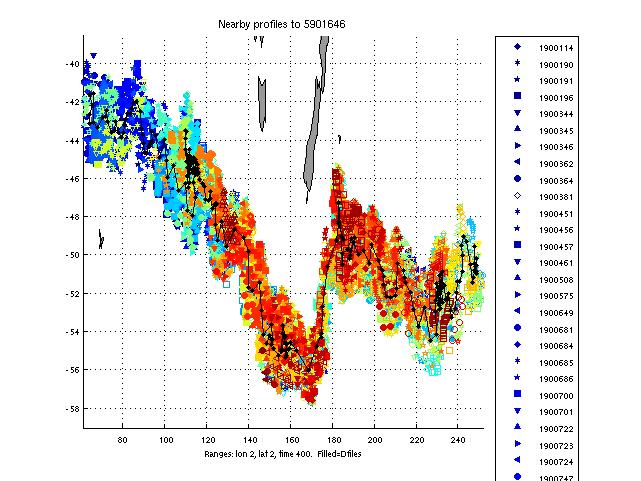
This float is at the upper end of the salinity spectrum when compared to nearby floats but follws the same major trend and seems reasonable.
This float required no salinity drift correction.
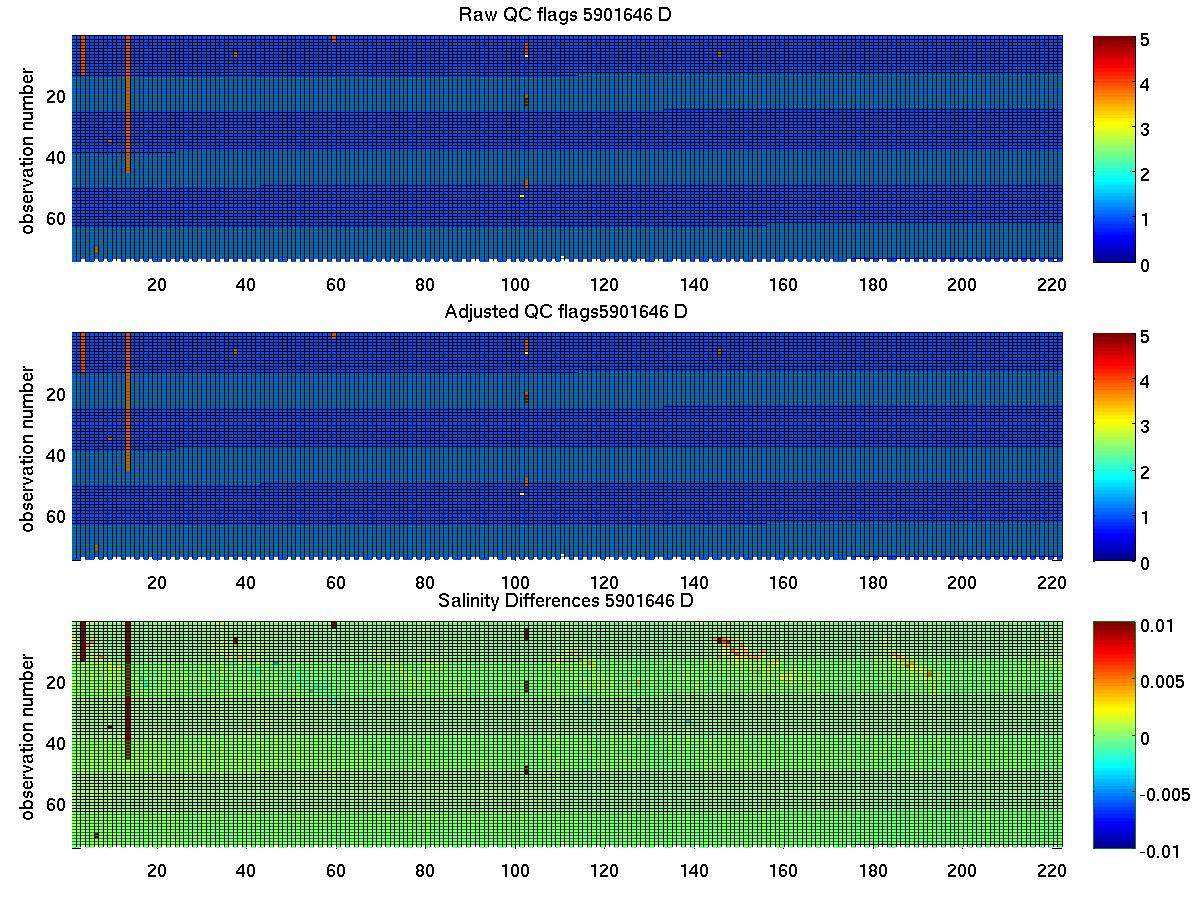
The plot below summarises the QC flags and salinity differences for the raw and adjusted salinity fields in the final delayed mode files submitted to the GDAC.
Created 27-07-2010