The table below provides basic information about the float, including primary sensors, mission parameters and current status of profiles.
| Institute | CSIRO |
| Principal Investigator | Susan Wijffels |
| Pressure Sensor | Druck (serial number=2465204) |
| CTD Sensor | APEX-SBE-41 (serial number=3610) |
| CTD Sampling Mode | Burst Sampler |
| Controller Board | APF 9 |
| Additional Sensors/Software | Aanderaa Oxygen Optode 3830 (serial number=886) |
| Park Depth | 1000 m |
| Profile Depth | 2000 m |
| Launch Date | 17-12-2007 |
| Number of D-moded Profiles | 78 |
| Calibration Date | 28-07-2010 |
| Pressure Drift | Surface Pressure Offset corrected |
| Salinity Drift | No salinity drift detected |

This float was located to the west of Tasmania, Australia in the Southern Ocean in an area bounded by 139 to 146 şE and 41 to 45 ş S.
The surface pressure for this float is shown in the plot below. This float shows a very slight drift in surface pressure offset which has been corrected.

Potential Temperature-Salinity (a), Location (b, Max Temperature (c) and Sea Surface Salinity (d) plots located below.

Surface temperatures generally varied between 10 and 15 şC and surface salinities from 34.8 to 35.4.
The plot below shows the potential-temperature/salinity curve for the deepest theta levels where the relationship between the two parameters should show the least variation.

The deep profiles look fine, the very first profile has a fresher bottom value however this is significantly east of the other profiles so seems reasonable.
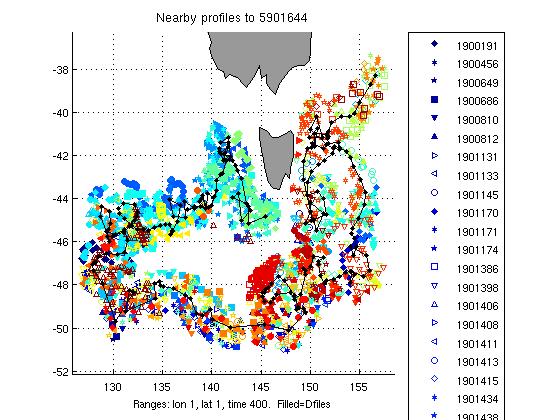
The two plots below show a). the location of this float (black circles) in relation to the position of other nearby argo floats (coloured circles) and b). The potential-temperature/salinity curve for this float (in black) compared to nearby argo floats (coloured).

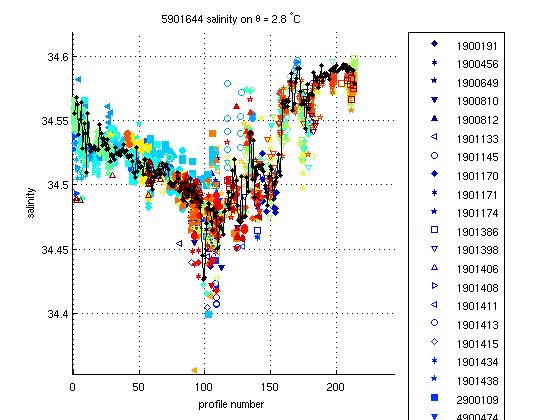
The potential-temperature/salinity curve for the deepest theta levels for this float (in black) and nearby argo floats (coloured) is displayed below.

There are some fresher intrusions in multiple profiles (and over multiple values) at the salinity minimum, however these also occur in neighbouring floats so this is real.
Inversions were located in profiles; 1, 6, 7, 8, 13 and 25. None of these were significant and therefore none were flagged.
Salt hooks were located in profiles; 9, 16, 19 and 21. These were flagged as QC 4 for both T & S.
The float appears to have several shortened profiles; 1, 2, 3, 4, 10, 38 and 39. No changes were made.


The plot below shows the analysis of salinity drift using the WJO/OW software.

The four plots below show the salinity anomalies on theta surfaces compared to (a) the Gouretski and Kolterman climatology, (b) the CARS (CSIRO Atlas of Regional Seas)/WOA (World Ocean Atlas) climatology, (c) the anomalies within the float series itself, (i.e. the salinity anomaly of each profile from the mean profile average for the float and (d) the raw float salinity compared to the CARS and G&K climatological salinity on a theta surface of 0.xx degrees C.
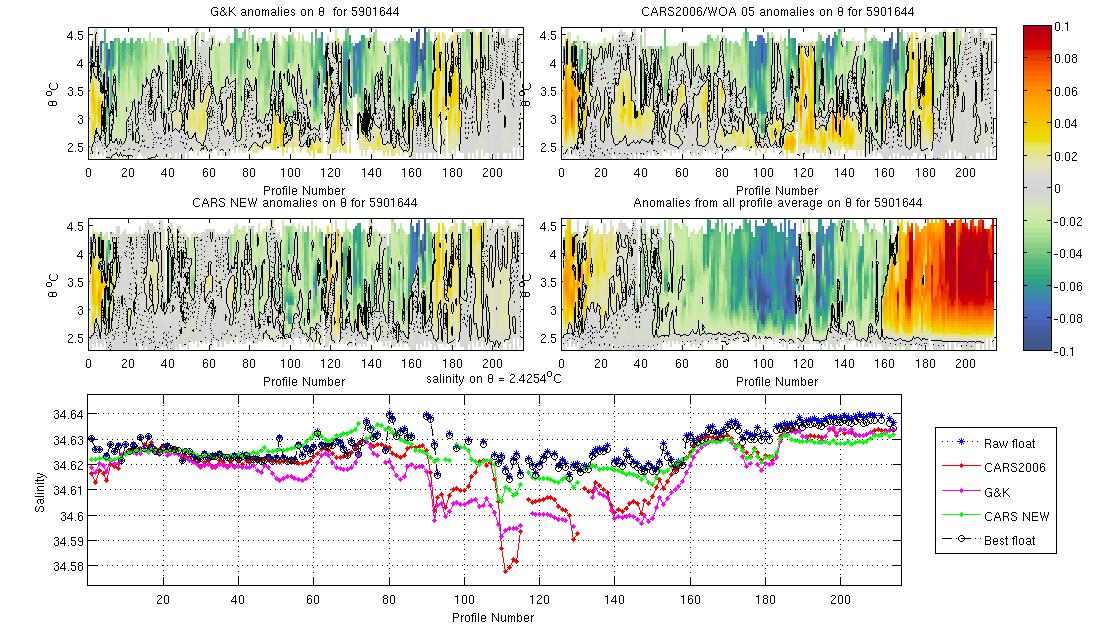
This float is very stable within itself. It is initially offset from both CARS and G&K for the first 9 profiles before becoming very close to CARS and offset by only 0.005 from G&K.
The plots below show the raw float salinity data (solid blue line) compared to neighbouring argo floats (coloured symbols) on a potential temperature surface of xx degrees C. The locality map shows the location of the profiles for this float and for neighbouring floats.
This float is similar to other nearby floats.
This float required no salinity drift correction.
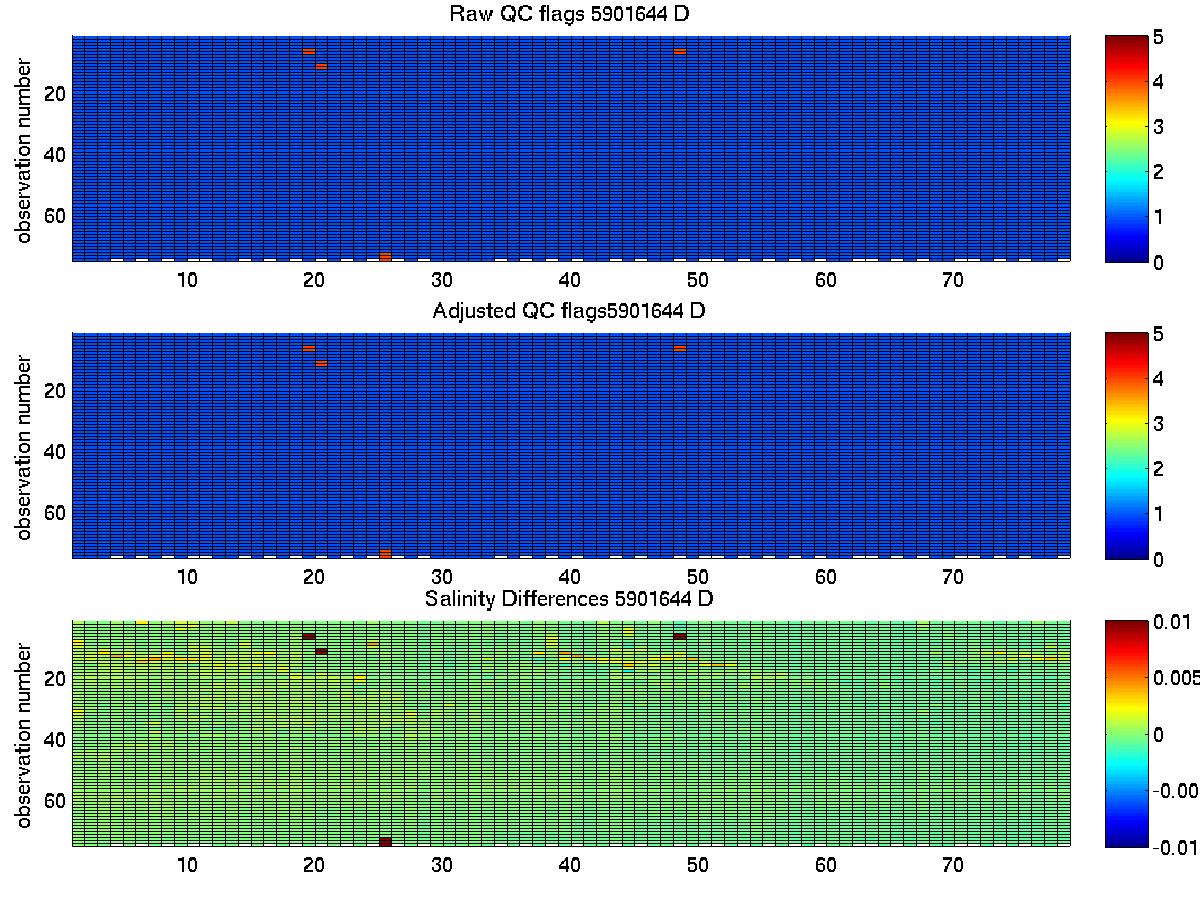
The plot below summarises the QC flags and salinity differences for the raw and adjusted salinity fields in the final delayed mode files submitted to the GDAC.
Created 28-07-2010