The table below provides basic information about the float, including primary sensors, mission parameters and current status of profiles.
| Institute | CSIRO |
| Principal Investigator | Susan Wijffels |
| Pressure Sensor | Druck (serial number=2355591) |
| CTD Sensor | APEX-SBE-41 (serial number=3184) |
| CTD Sampling Mode | Burst Sampler |
| Controller Board | APF 8 |
| Additional Sensors/Software | None |
| Park Depth | 1000 m |
| Profile Depth | 2000 m |
| Launch Date | 22-11-2007 |
| Number of D-moded Profiles | 80 |
| Calibration Date | 28-07-2010 |
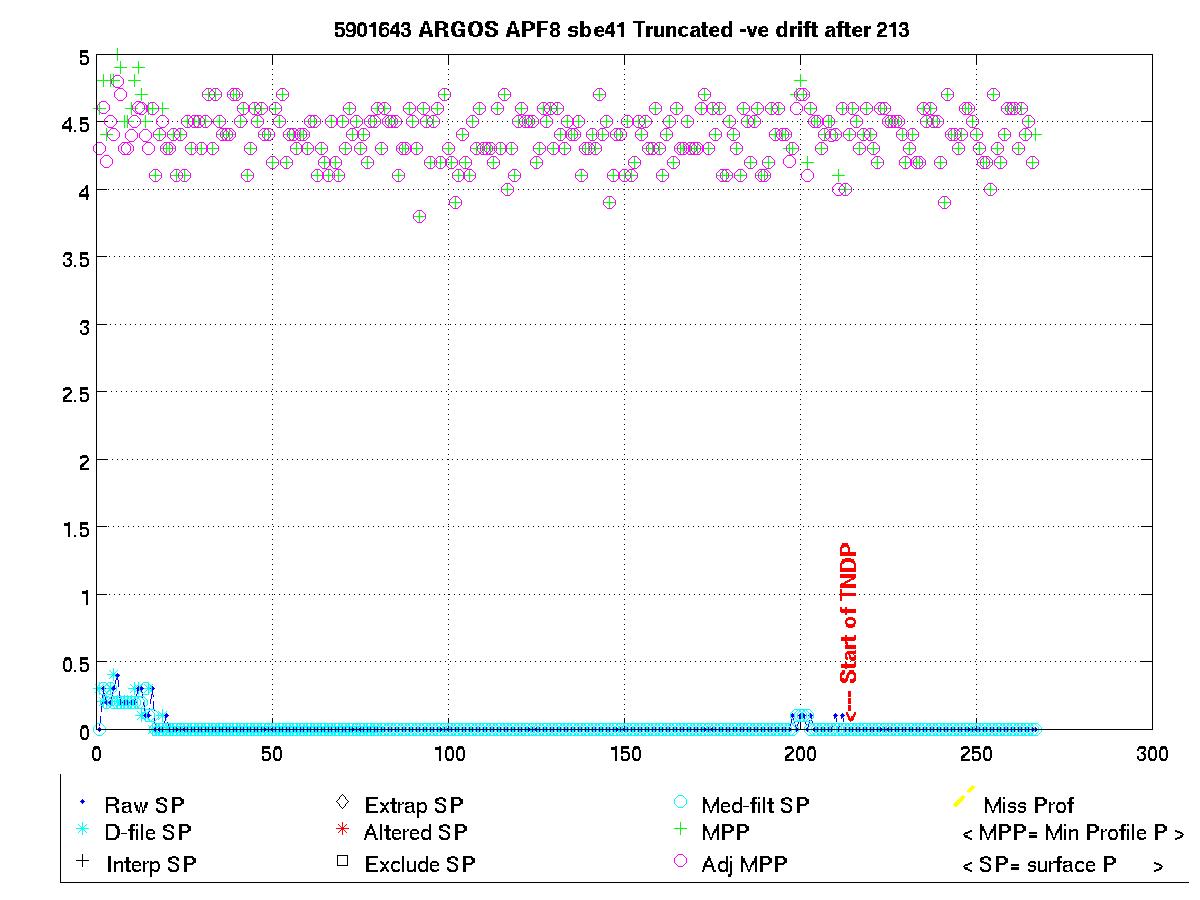
| Pressure Drift | Surface Pressure Offset corrected for profiles 1 to 20. Surface Pressure Offset unknown and uncorrectable from profile 21 onwards, TNDP float, no anomalous TS data, QC=2, serial number > 2324175 |
| Salinity Drift | No salinity drift detected |
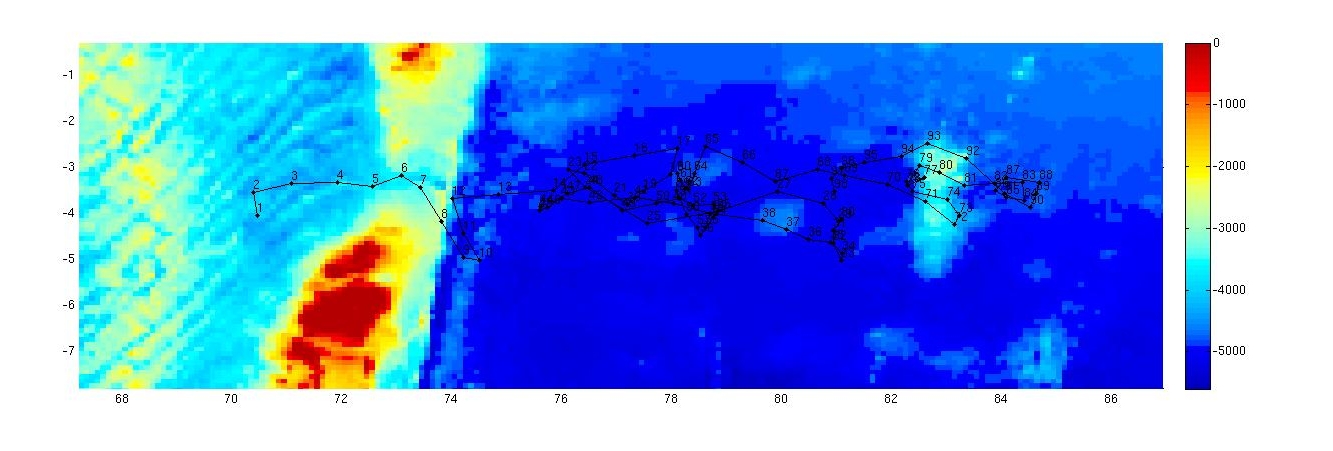
This float was located in the Indian Ocean to the south of Sri Lanka and to the north of the Chagos Archipelago and Diego Garcia, in an area bounded by 70 to 82 şE and 3 to 5 ş S.
The surface pressure for this float is shown in the plot below. This float has a negative drift in the Surface Pressure offset.
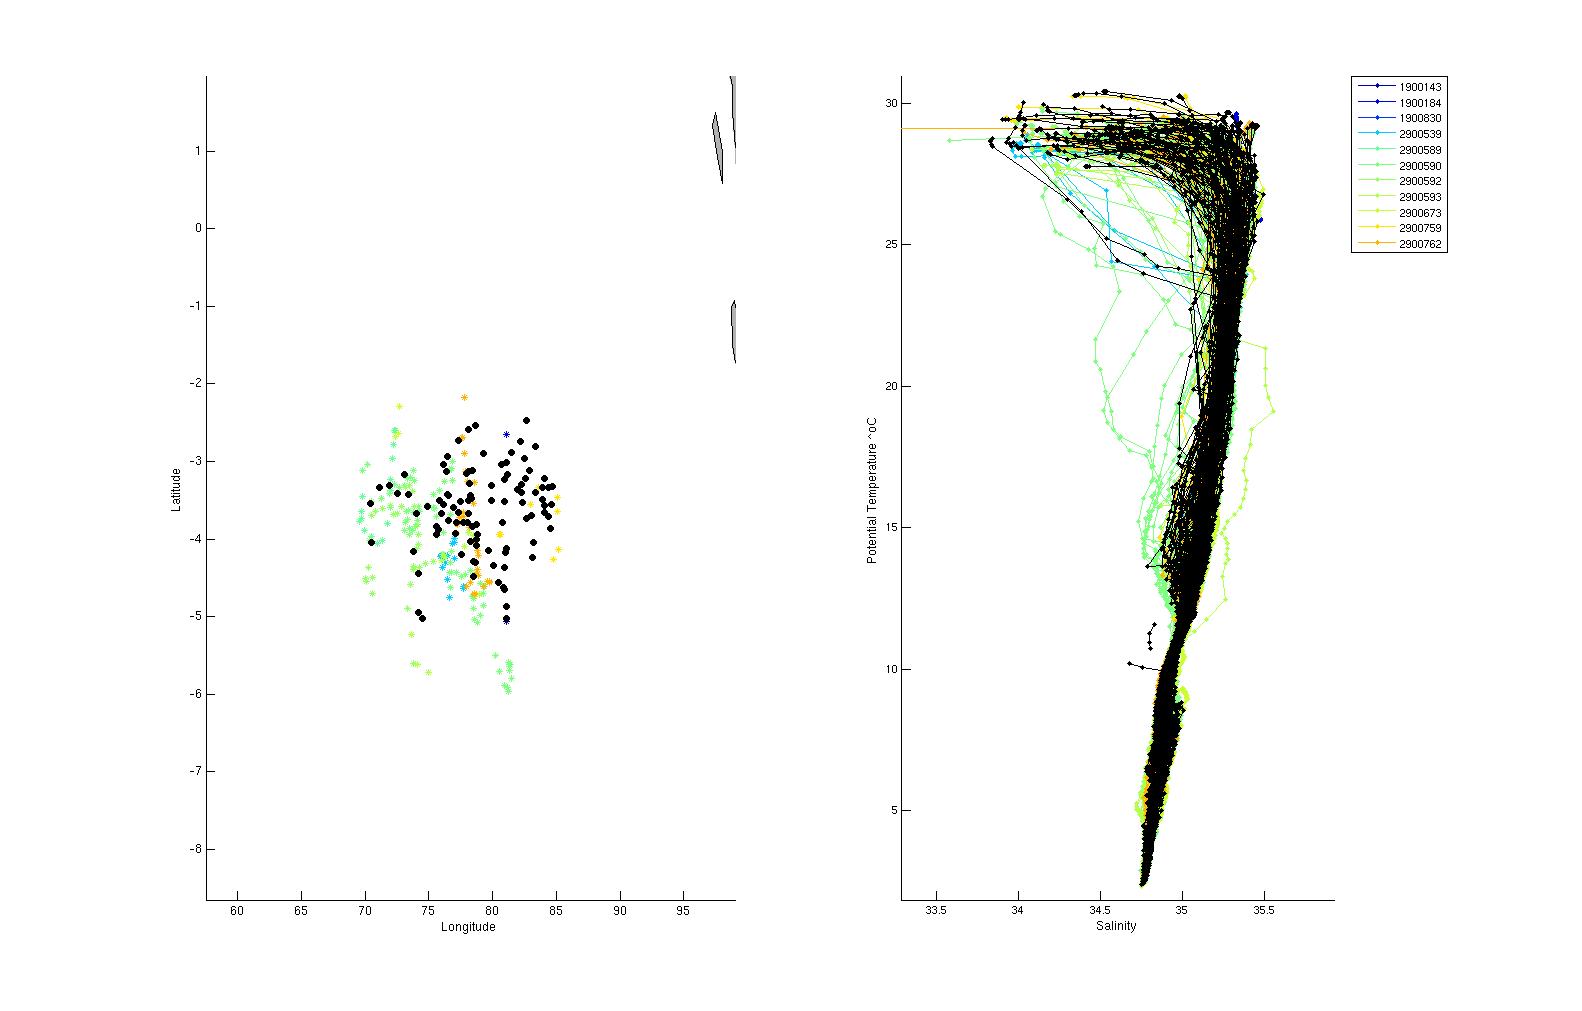
Potential Temperature-Salinity (a), Location (b, Max Temperature (c) and Sea Surface Salinity (d) plots located below.
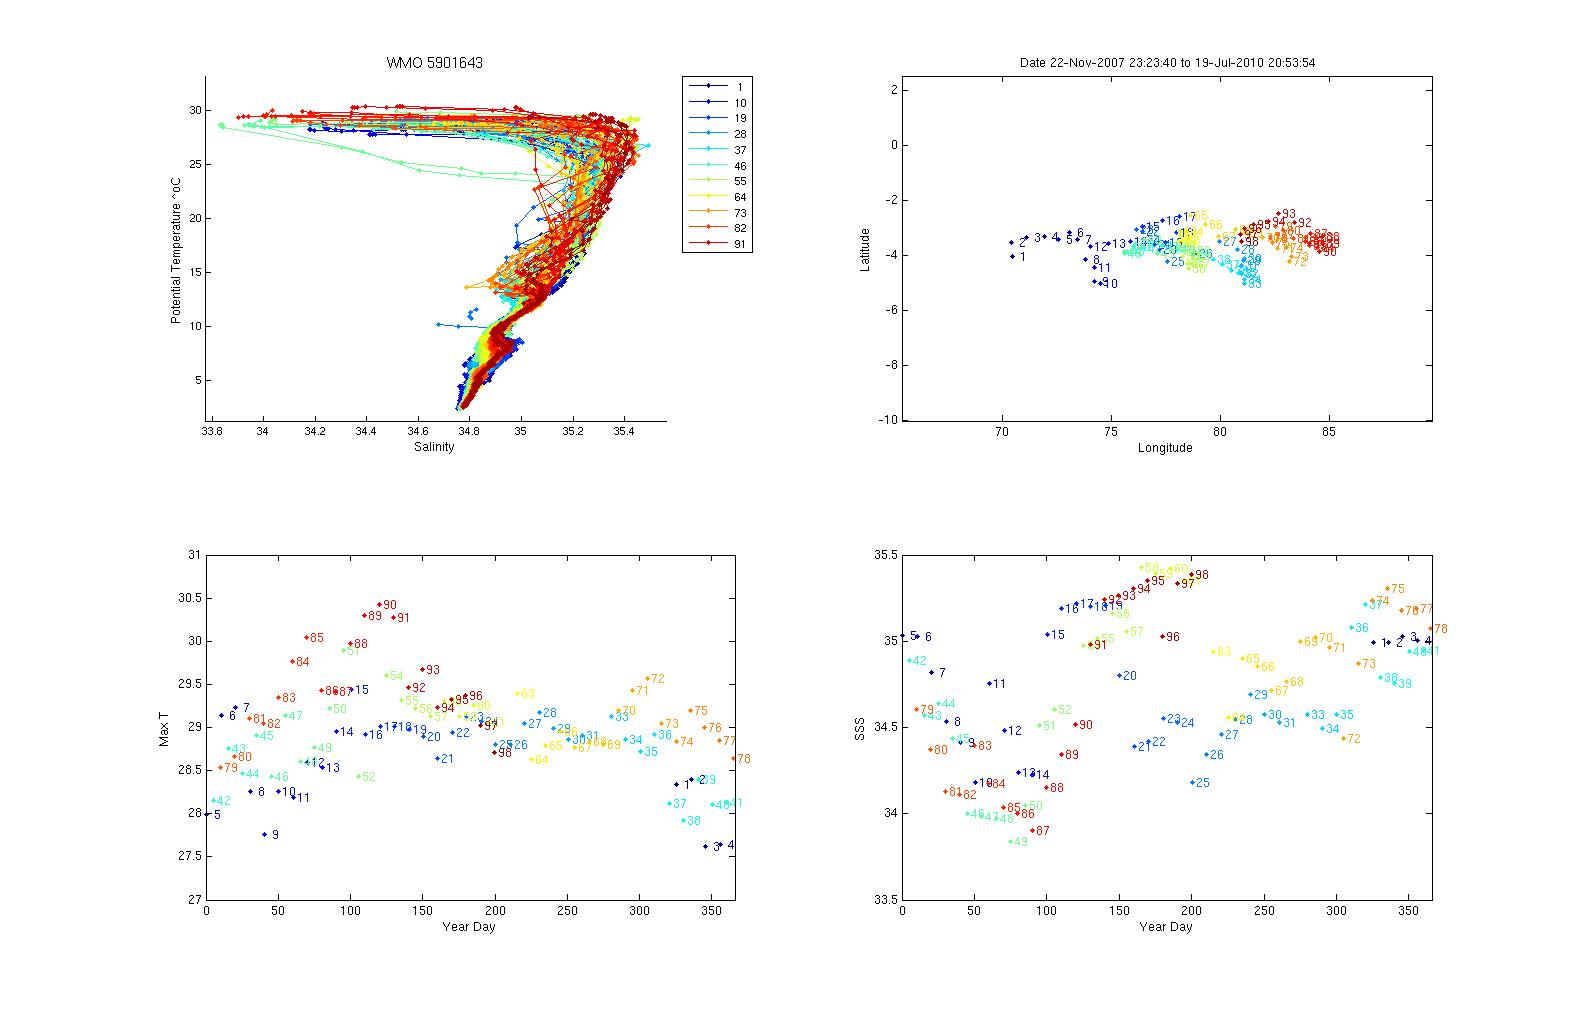
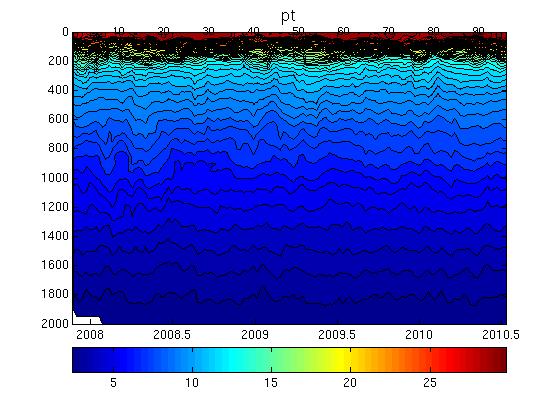
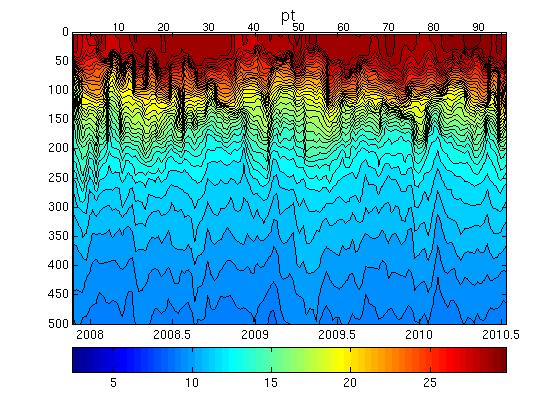
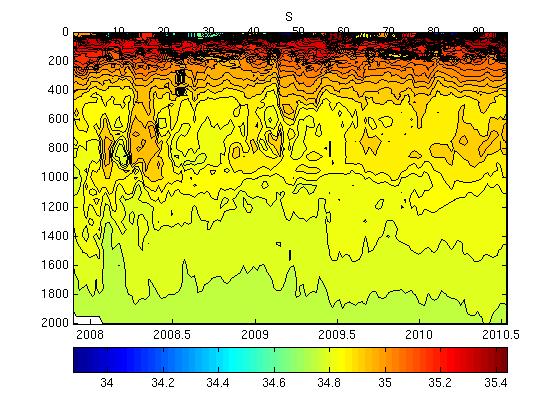
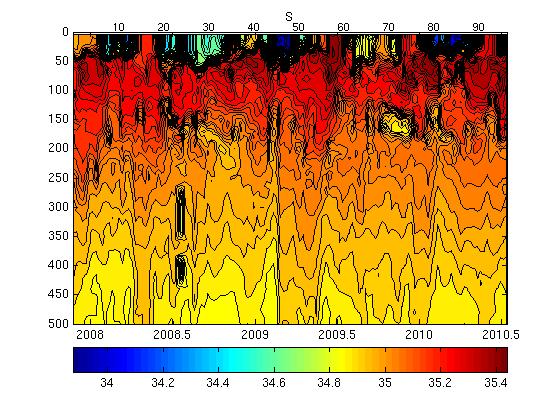
Surface temperatures generally varied between 27.5 and 29.5 şC and surface salinities from 34.0 to 35.3.
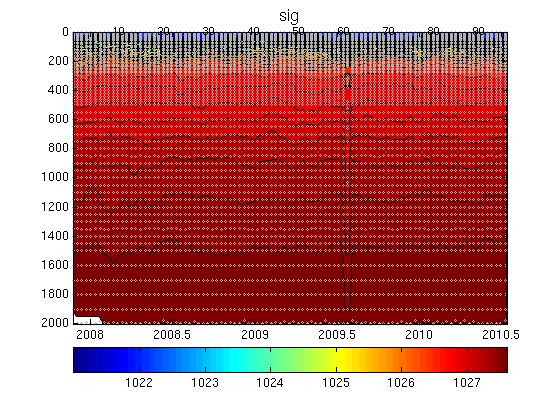
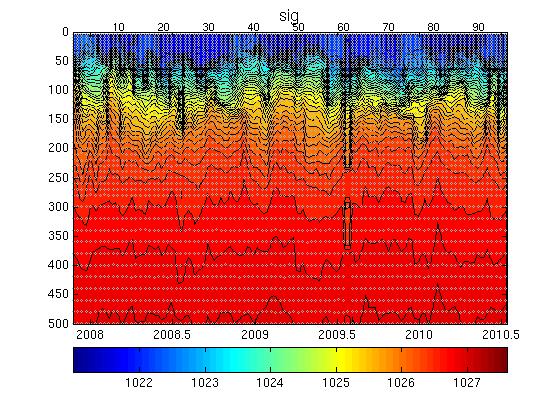
The plot below shows the potential-temperature/salinity curve for the deepest theta levels where the relationship between the two parameters should show the least variation.
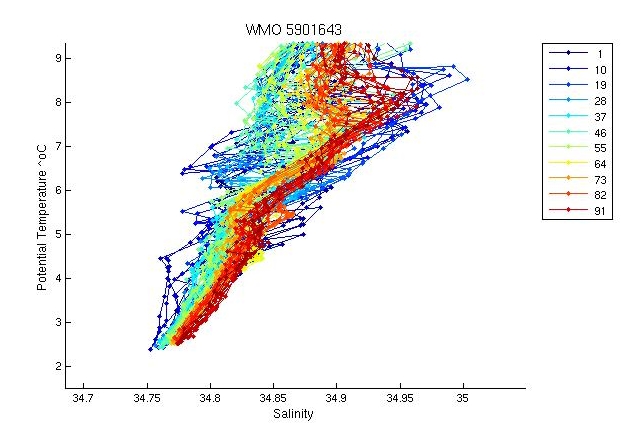
There is great variability in the TS diagram particularly at depth and in midwater. However as the float has crossed a midocean ridge with the currents/water masses expected to be different on each side, this is reasonable. Floats to the west of the ridge are in saltier water masses and floats to the east in fresher water masses. This difference is borne out in the earlier/later profiles of this float.
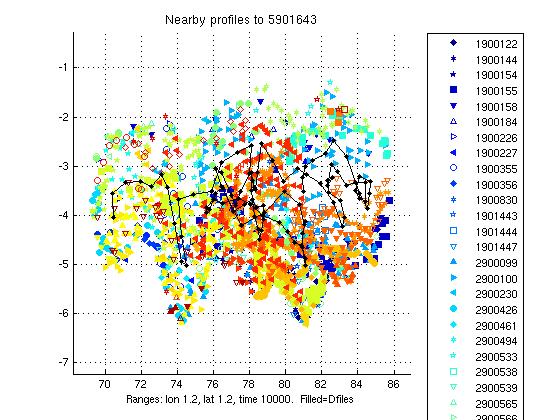
The two plots below show a). the location of this float (black circles) in relation to the position of other nearby argo floats (coloured circles) and b). The potential-temperature/salinity curve for this float (in black) compared to nearby argo floats (coloured).
The potential-temperature/salinity curve for the deepest theta levels for this float (in black) and nearby argo floats (coloured) is displayed below.
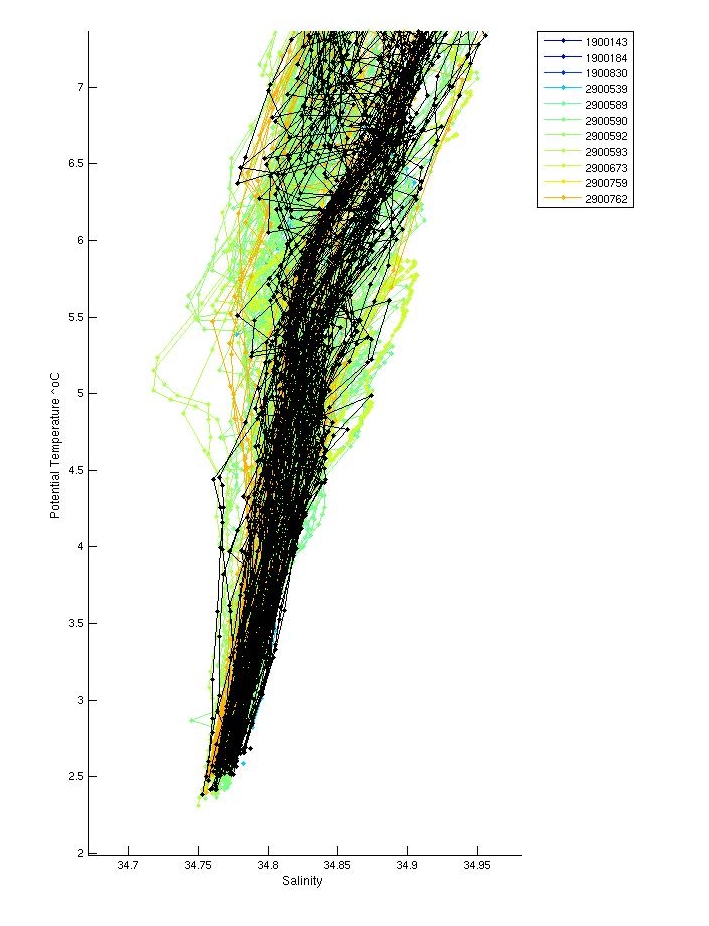
The envelope of neighbouring floats shows that this float is located middway between salty and fresh clusters of profiles, separated by the ridge.
There were inversions in profiles; 7,23,80. These were not significant and therefore were not flagged.
Salt hooks were located in profiles; 3,5,9,11,13,15,16,18,20,23,25,27,29,31,33,35,37,38,41,43,45,47,49,51,53,55,56,59,60,62,65,67,69,71,73,75,76,78. These were flagged as QC 4 for both T & S.
The real-time software flagged some data points in profiles 7 and 23 as bad. These were checked in Gilson and re-flagged to QC=1 as the data appears good. A spike in midwater in profile 6 was left as QC=4. There are only 23 profiles available for DMQC at this time. However check profile 25 next time around as there appears to be bad data between 250 and 450 m depth.
The plot below shows the analysis of salinity drift using the WJO/OW software.

This float looks fine.
The four plots below show the salinity anomalies on theta surfaces compared to (a) the Gouretski and Kolterman climatology, (b) the CARS (CSIRO Atlas of Regional Seas)/WOA (World Ocean Atlas) climatology, (c) the anomalies within the float series itself, (i.e. the salinity anomaly of each profile from the mean profile average for the float and (d) the raw float salinity compared to the CARS and G&K climatological salinity on a theta surface of 0.xx degrees C.
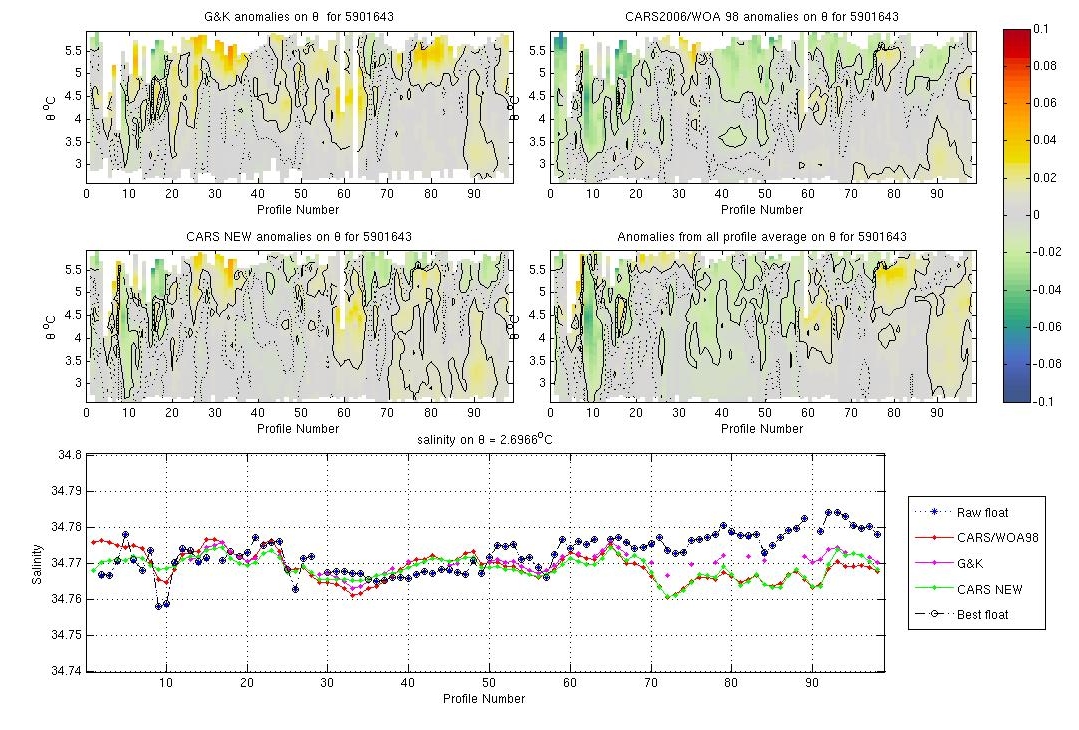
This float was close to CARS and G&K and has obviously crossed different water mass regimes over the first 15 profiles. This float looks okay.
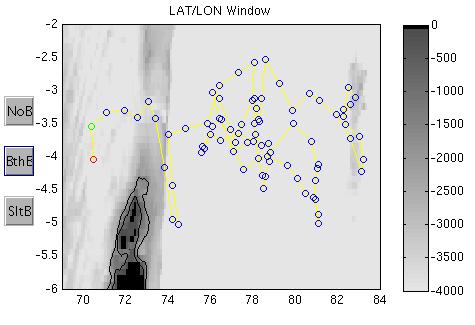
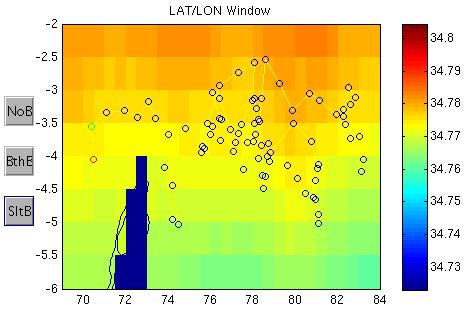
The plots below show the raw float salinity data (solid blue line) compared to neighbouring argo floats (coloured symbols) on a potential temperature surface of xx degrees C. The locality map shows the location of the profiles for this float and for neighbouring floats.
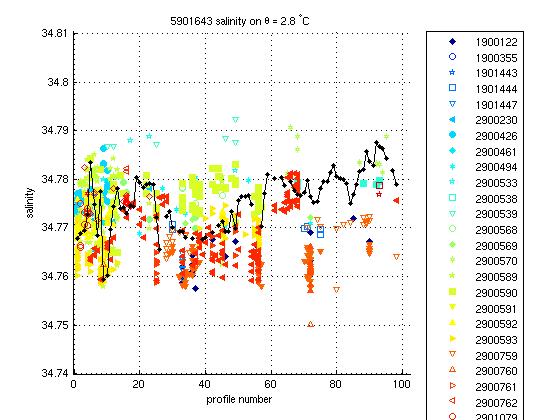
The salinity values at depth on a deep theta surface are highly varaible (up to 0.04) however this float is comparable to other nearby floats and is in a highly variable region therefore this is okay.
This float required no salinity drift correction.
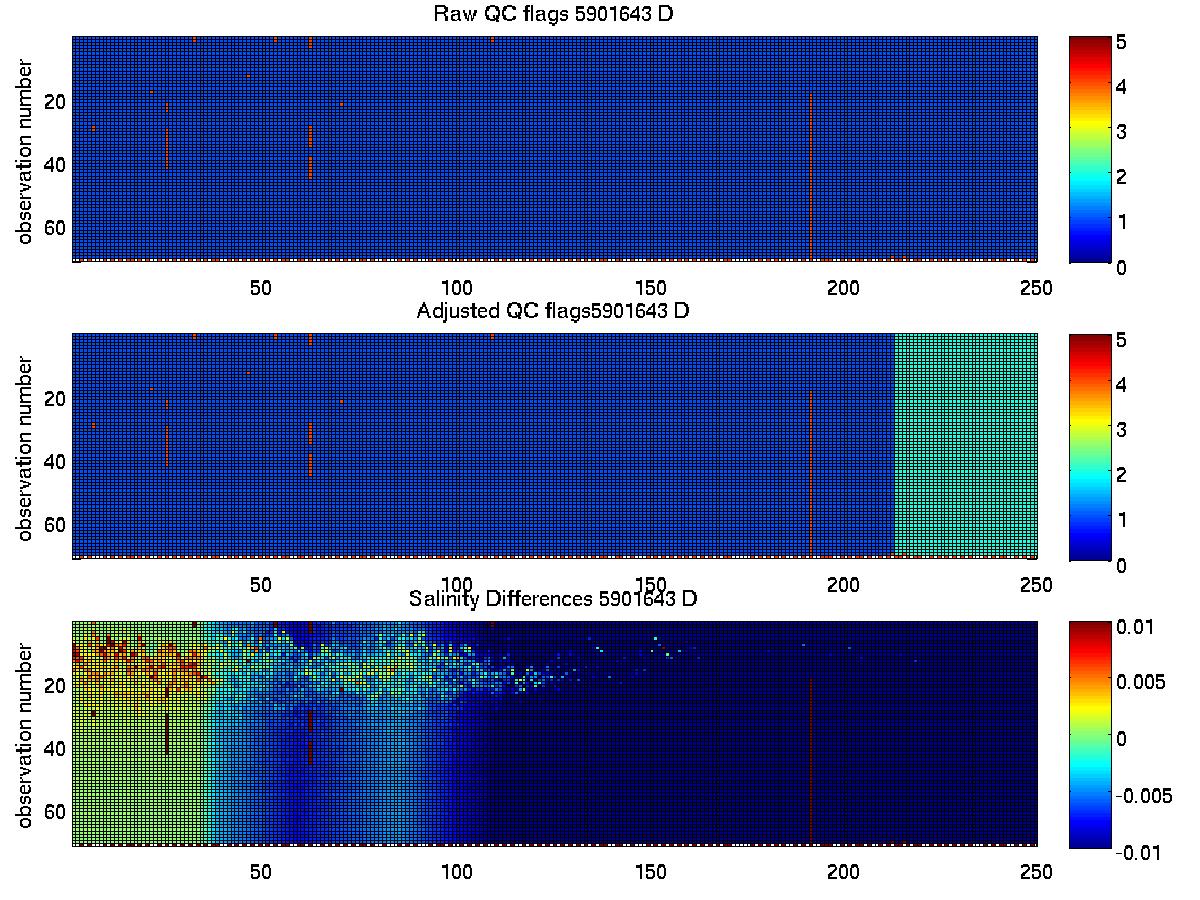
The plot below summarises the QC flags and salinity differences for the raw and adjusted salinity fields in the final delayed mode files submitted to the GDAC.
Created 28-07-2010