The table below provides basic information about the float, including primary sensors, mission parameters and current status of profiles.
| Institute | CSIRO |
| Principal Investigator | Susan Wijffels |
| Pressure Sensor | Druck (serial number=2385263) |
| CTD Sensor | APEX-SBE-41 (serial number=3307) |
| CTD Sampling Mode | Burst Sampler |
| Controller Board | APF 8 |
| Additional Sensors/Software | None |
| Park Depth | 1000 m |
| Profile Depth | 2000 m |
| Launch Date | 21-11-2007 |
| Number of D-moded Profiles | 97 |
| Calibration Date | 06-06-2012 |
| Pressure Drift | Surface Pressure Offset unknown and uncorrectable from profile 1 onwards, TNDP float, no anomalous TS data, QC=2, serial number > 2324175 |
| Salinity Drift | No salinity drift detected |
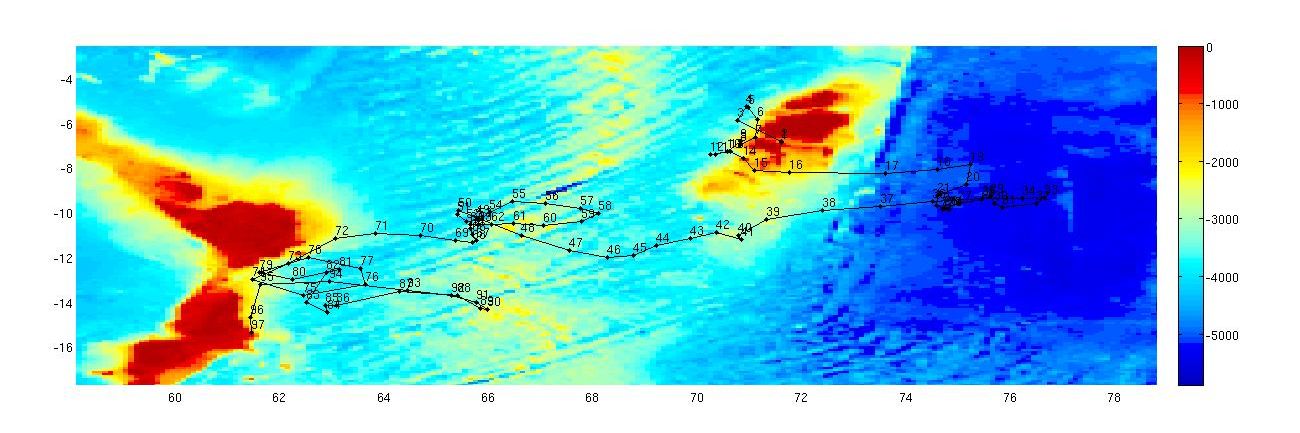
This float was located in the Indian Ocean around the Chagos Archipelago in an area bounded by 60 to 78 şE and 4 to 16 ş S.
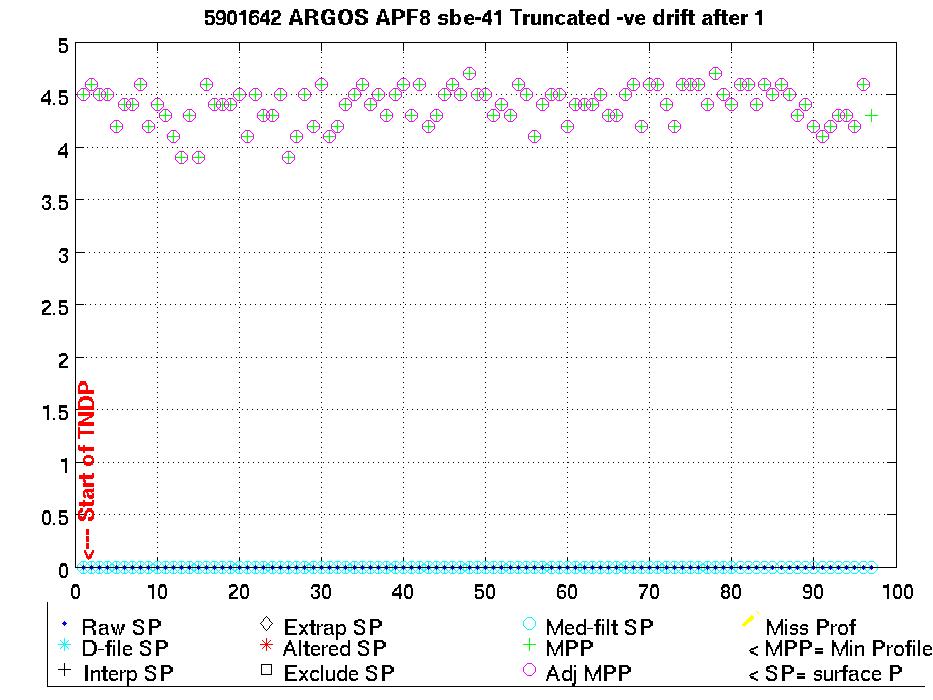
The surface pressure for this float is shown in the plot below. A negative drift in the Surface Pressure offset is present and can't be corrected.
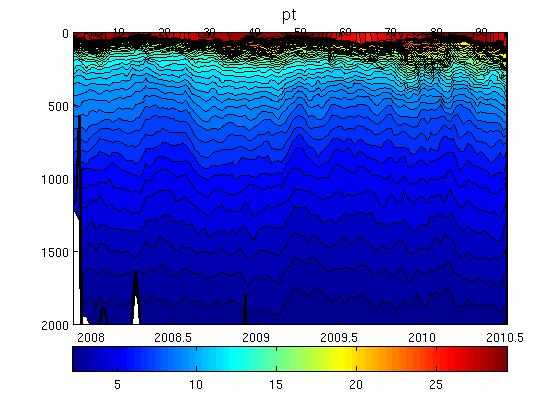
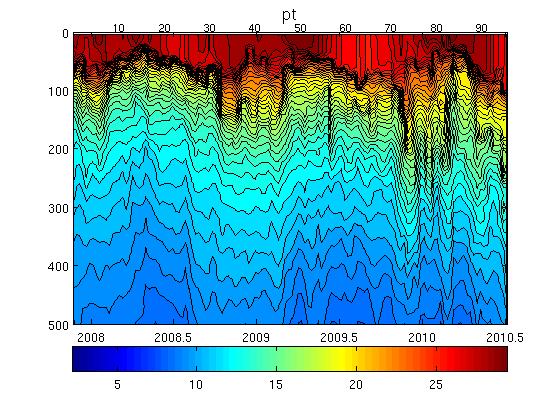
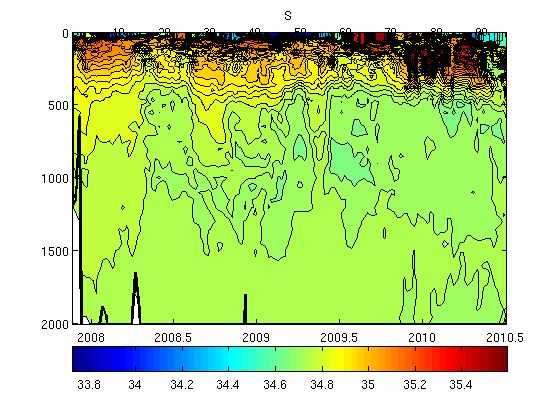
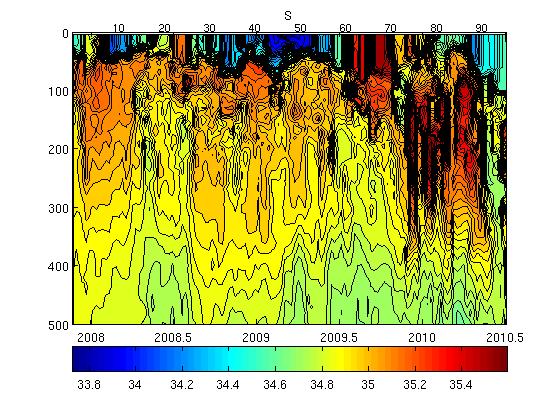
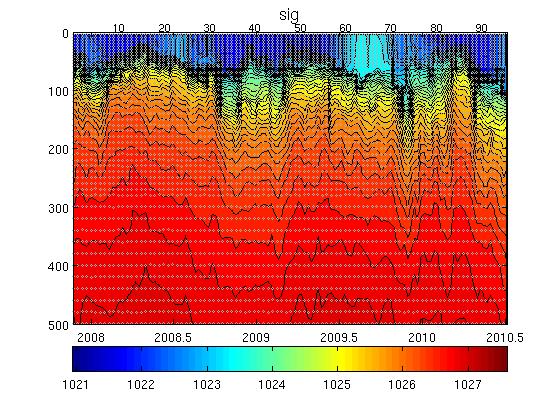
Potential Temperature-Salinity (a), Location (b, Max Temperature (c) and Sea Surface Salinity (d) plots located below.
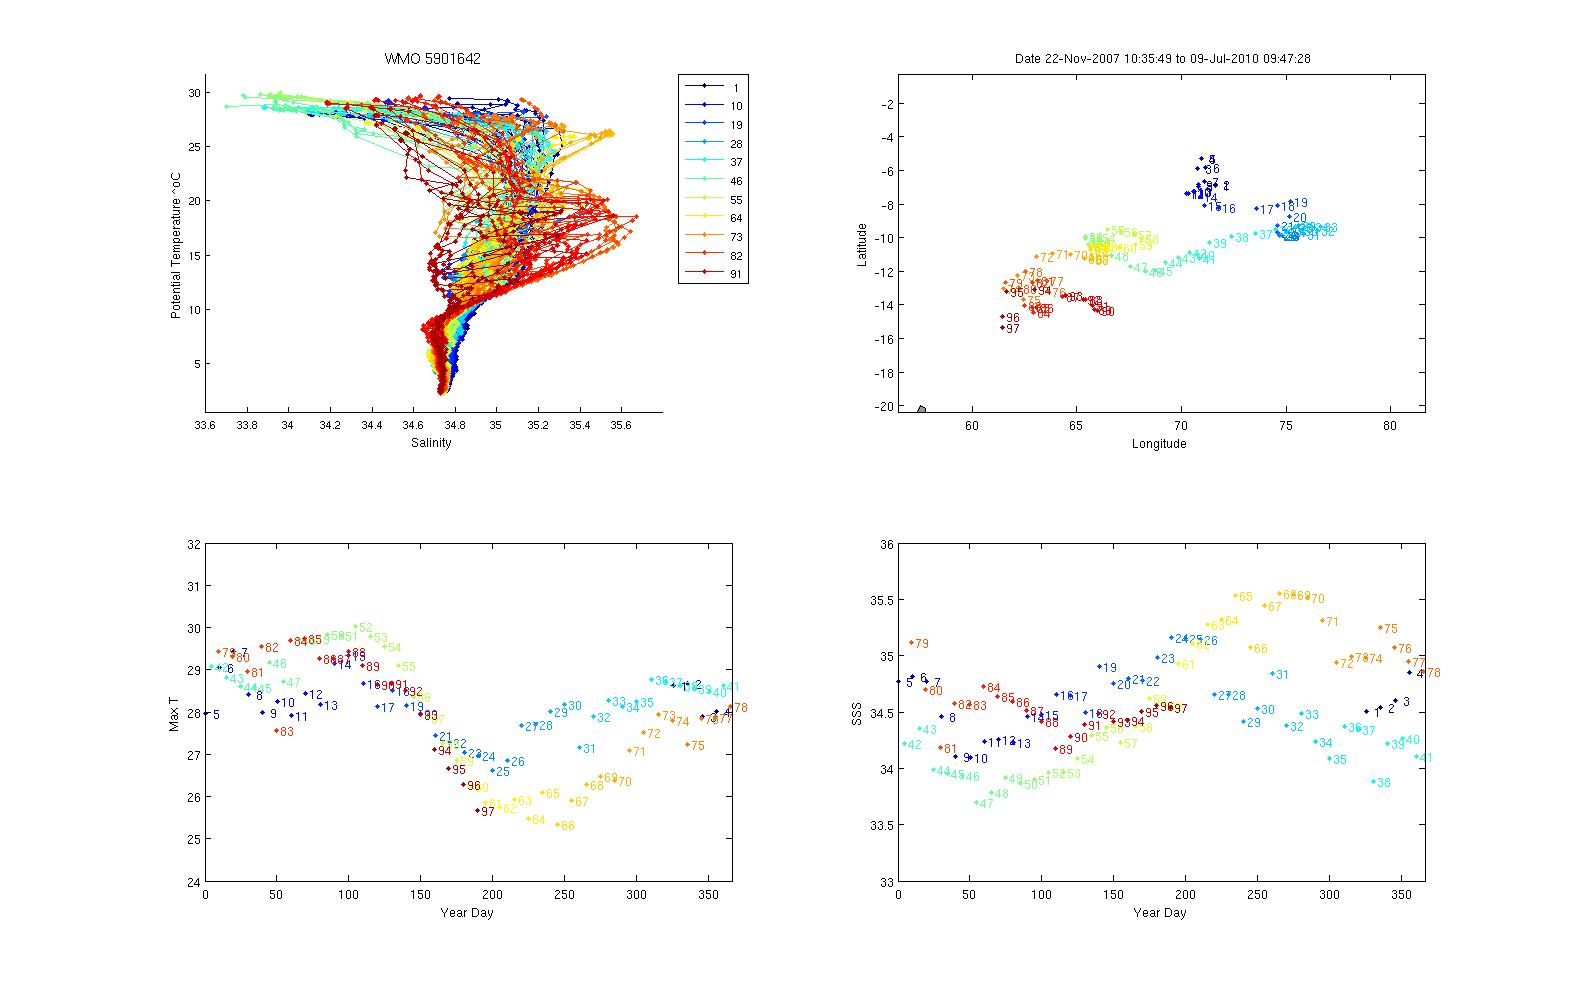
Surface temperatures generally varied between 26.5 and 29.5 şC and surface salinities from 33.8 to 35.25.
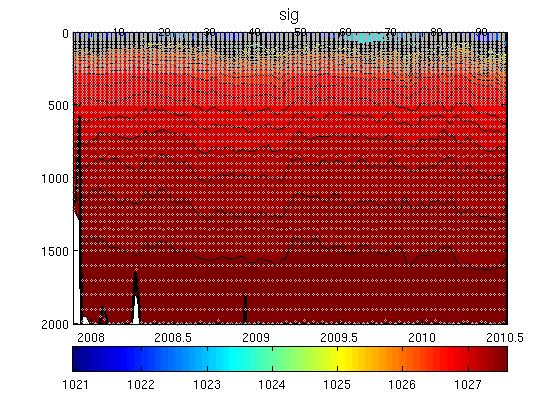
The plot below shows the potential-temperature/salinity curve for the deepest theta levels where the relationship between the two parameters should show the least variation.
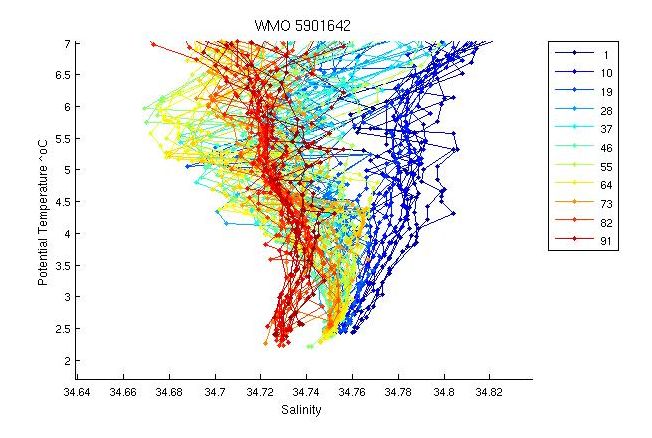
There is large variability in the deep T-S, however as the float has crossed one side of a ridge to another this is reasonable.
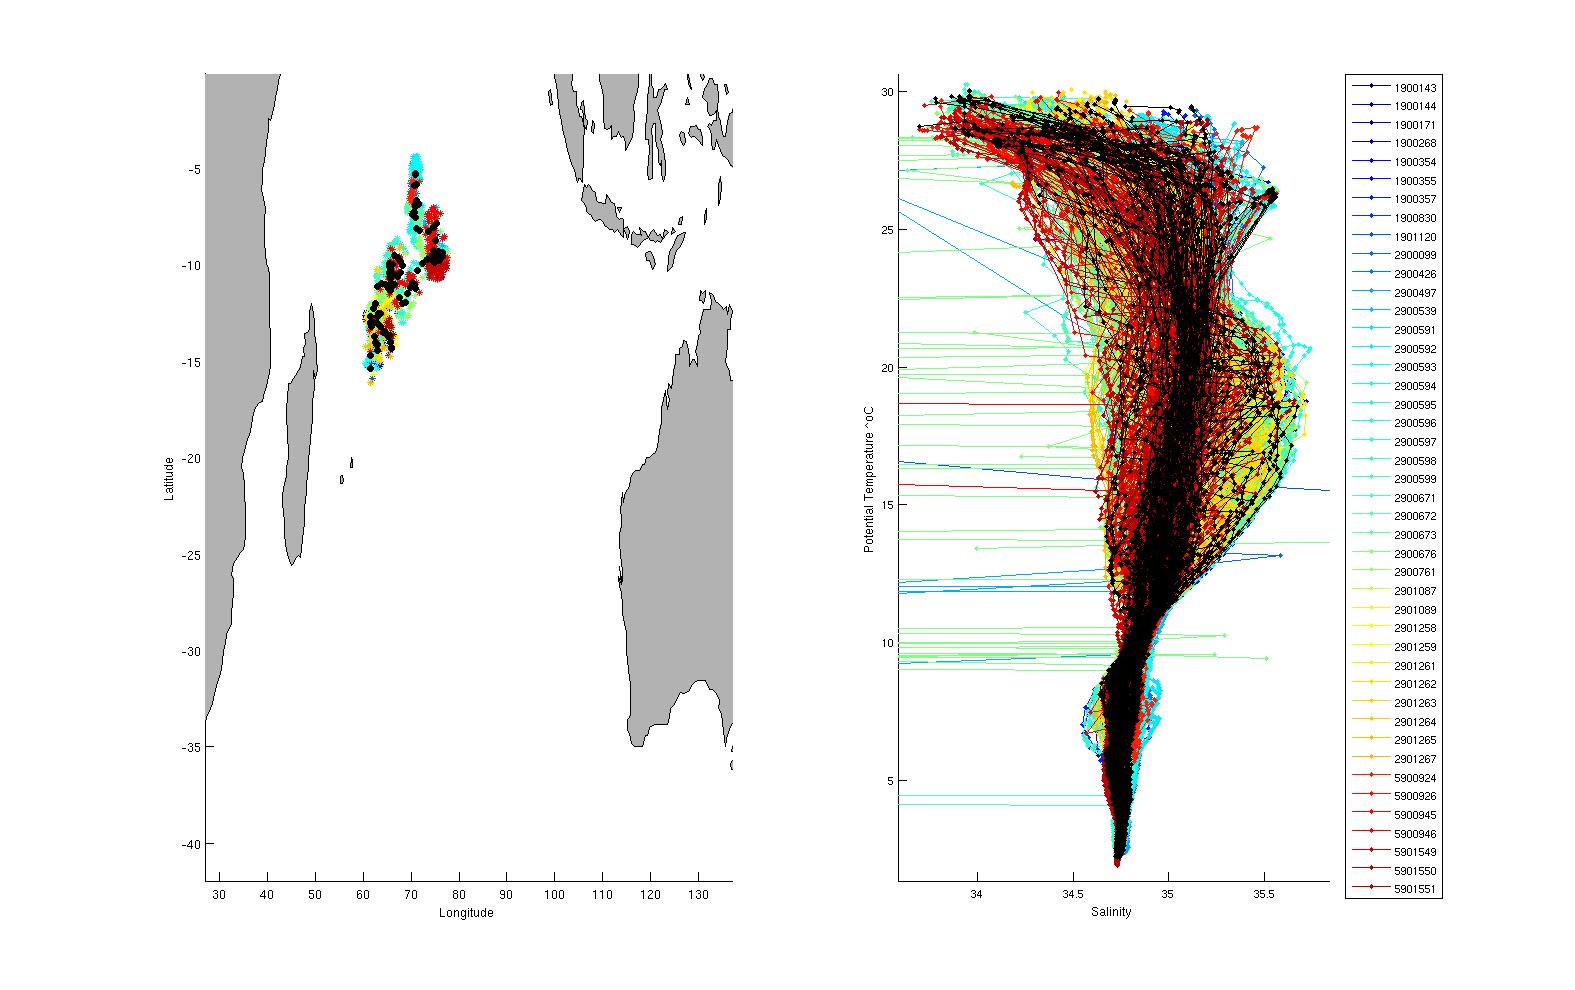
The two plots below show a). the location of this float (black circles) in relation to the position of other nearby argo floats (coloured circles) and b). The potential-temperature/salinity curve for this float (in black) compared to nearby argo floats (coloured).
The potential-temperature/salinity curve for the deepest theta levels for this float (in black) and nearby argo floats (coloured) is displayed below.
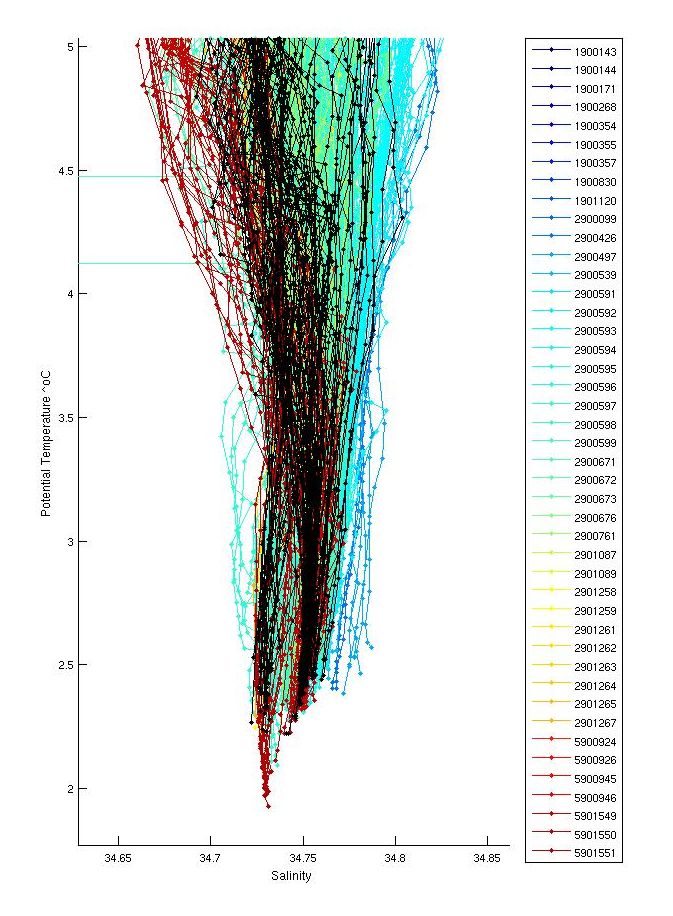
The deep TS looks reasonable compared to neighbouring floats. The high salinity intrusion seen in midwater in profile 25 is also seen in neighbouring profiles from other floats so this is left in.
There were inversions in profiles; 62,76. These were not significant and were not flagged.
Salt hooks were located in profiles; 6,9,11,14,17,18,20,22,26,28,31,35,37,39,41,43,45,47,49,51,53,57,59,61,63,65,66,68,69,72,74,76,78,80,83,85,86,89,90,93,95,97. These were flagged as QC 4 for both T & S.
There were no missing profiles. The float grounded on profiles; 1, 2, 3, 4 and 15. Near bottom values were flagged on profiles 1, 2, 3 and 15 as QC4 where the float grounded as these looked suspicious. Extra salt hooks were flagged on profiles 7 and 8.
The plot below shows the analysis of salinity drift using the WJO/OW software.

The four plots below show the salinity anomalies on theta surfaces compared to (a) the Gouretski and Kolterman climatology, (b) the CARS (CSIRO Atlas of Regional Seas)/WOA (World Ocean Atlas) climatology, (c) the anomalies within the float series itself, (i.e. the salinity anomaly of each profile from the mean profile average for the float and (d) the raw float salinity compared to the CARS and G&K climatological salinity on a theta surface of 0.xx degrees C.
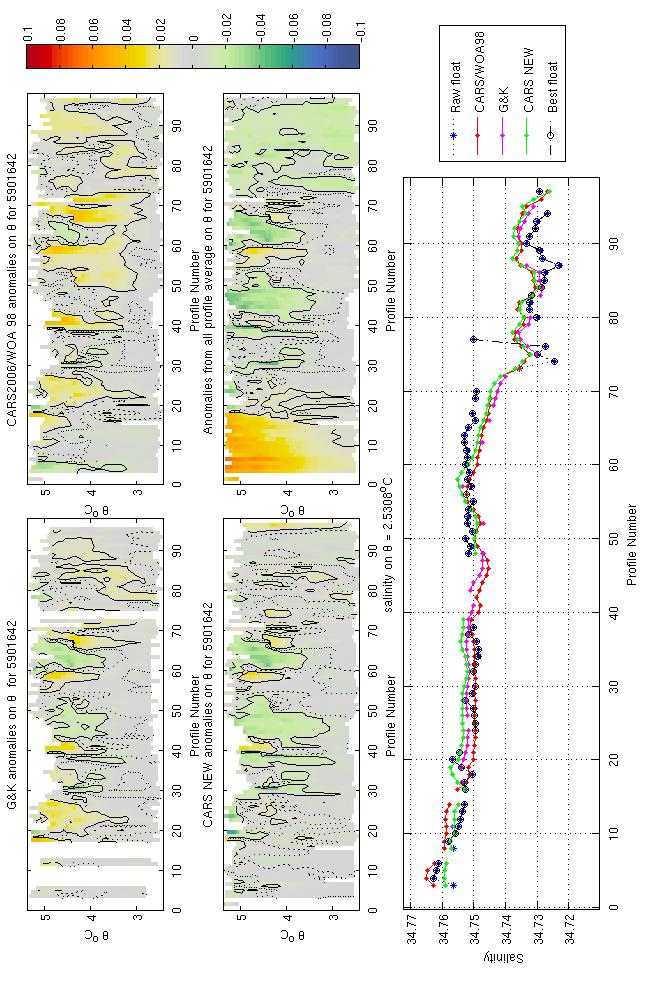
This float has crossed a strong frontal gradient several times and is very close to climatologies for the entire length of the record.
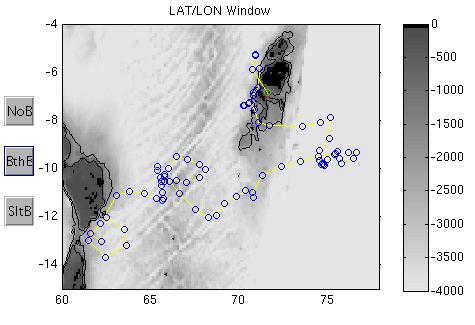
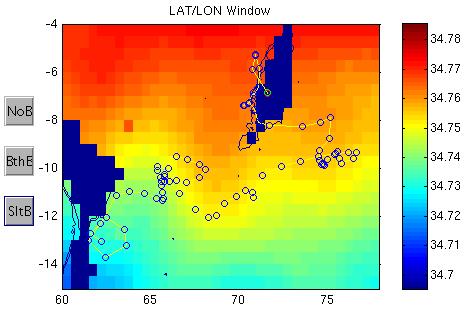
The plots below show the raw float salinity data (solid blue line) compared to neighbouring argo floats (coloured symbols) on a potential temperature surface of xx degrees C. The locality map shows the location of the profiles for this float and for neighbouring floats.
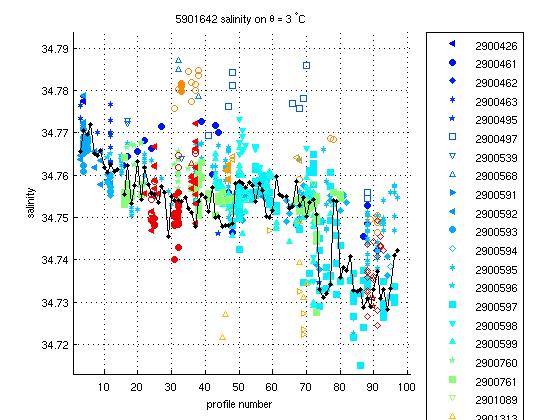
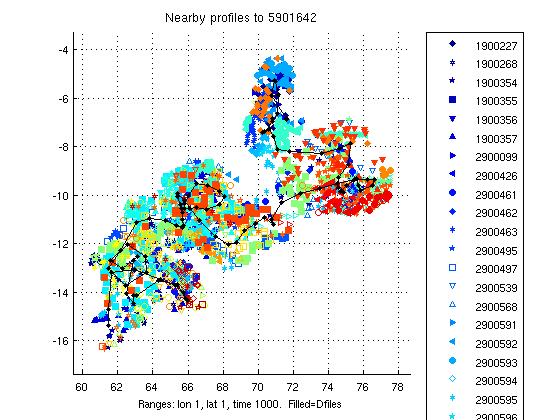
This float is in the middle of the nearby argo envelope.
This float required no salinity drift correction.
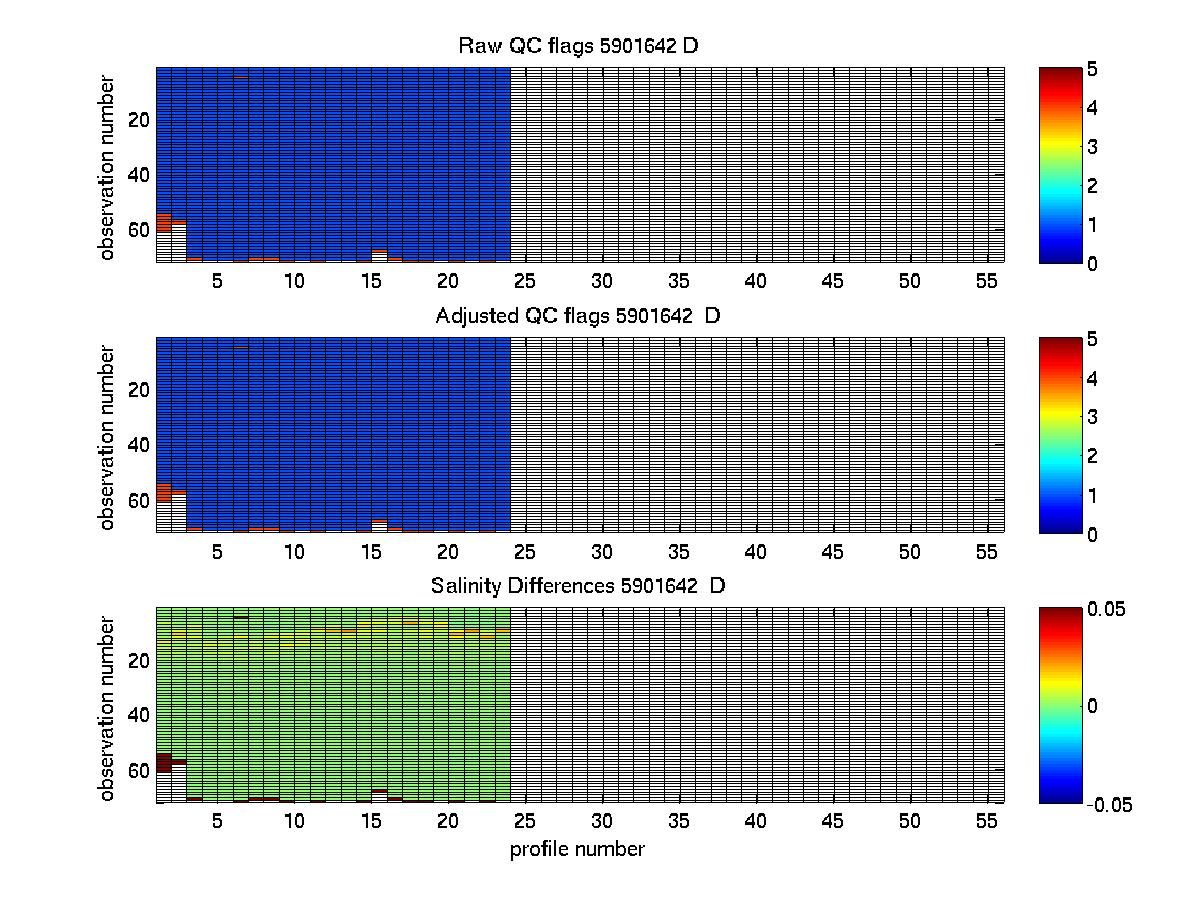
The plot below summarises the QC flags and salinity differences for the raw and adjusted salinity fields in the final delayed mode files submitted to the GDAC.
Created 06-06-2012