The table below provides basic information about the float, including primary sensors, mission parameters and current status of profiles.
| Institute | CSIRO |
| Principal Investigator | Susan Wijffels |
| Pressure Sensor | Druck (serial number=2385264) |
| CTD Sensor | APEX-SBE-41 (serial number=3308) |
| CTD Sampling Mode | Burst Sampler |
| Controller Board | APF 8 |
| Additional Sensors/Software | None |
| Park Depth | 1000 m |
| Profile Depth | 2000 m |
| Launch Date | 15-11-2007 |
| Number of D-moded Profiles | 81 |
| Calibration Date | 29-07-2010 |
| Pressure Drift | Surface Pressure Offset corrected |
| Salinity Drift | No salinity drift detected |
This float was located n the Indian Ocean, to the west of Shark Bay, W.A., in a region bounded by 99 to 102 şE and 21 to 24 ş S.
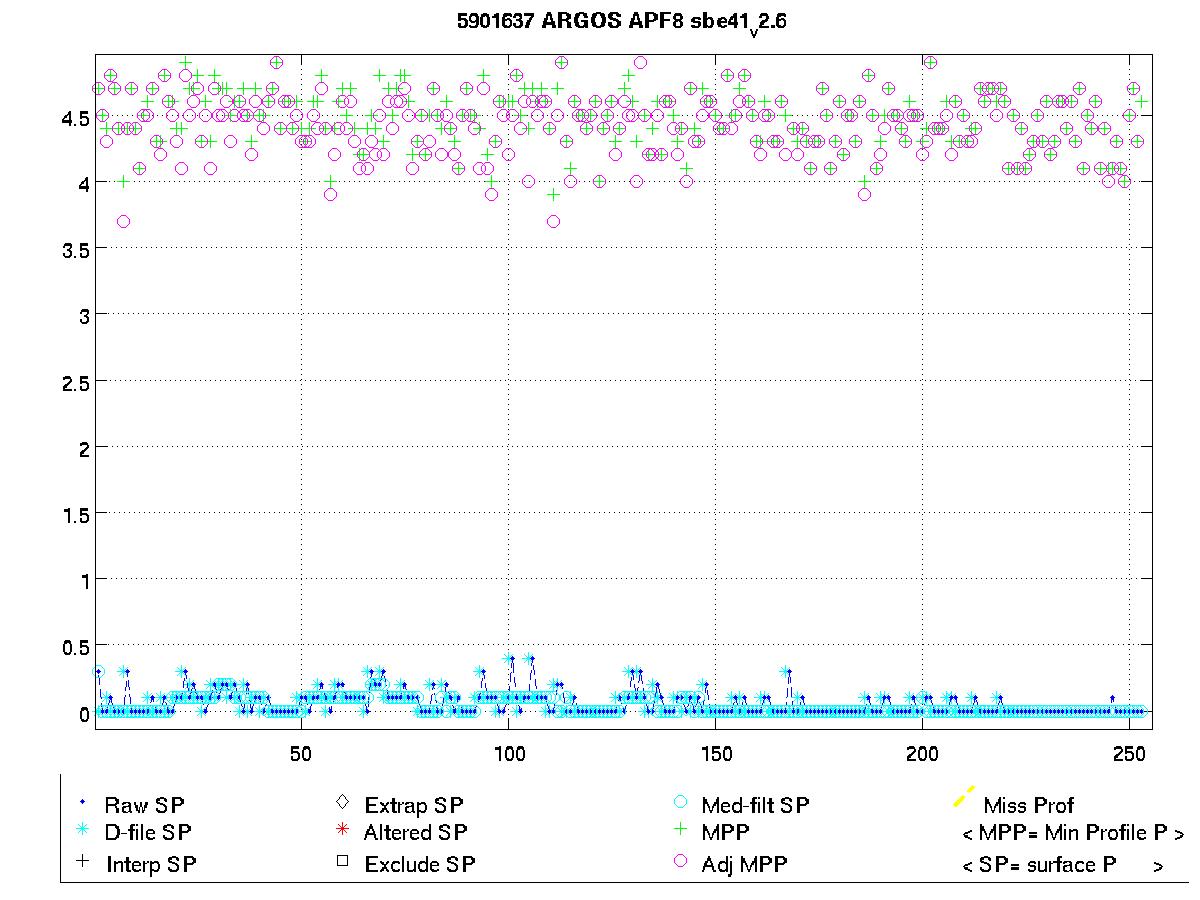
The surface pressure for this float is shown in the plot below.
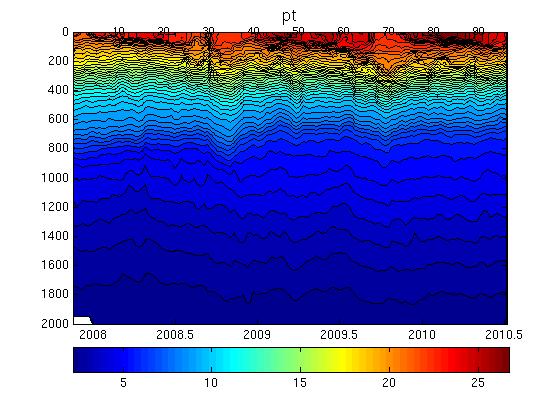
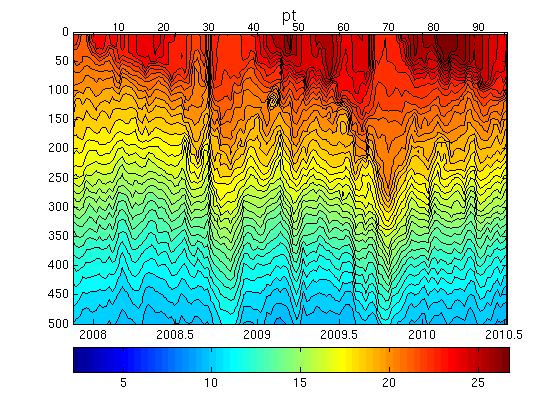
Potential Temperature-Salinity (a), Location (b, Max Temperature (c) and Sea Surface Salinity (d) plots located below.
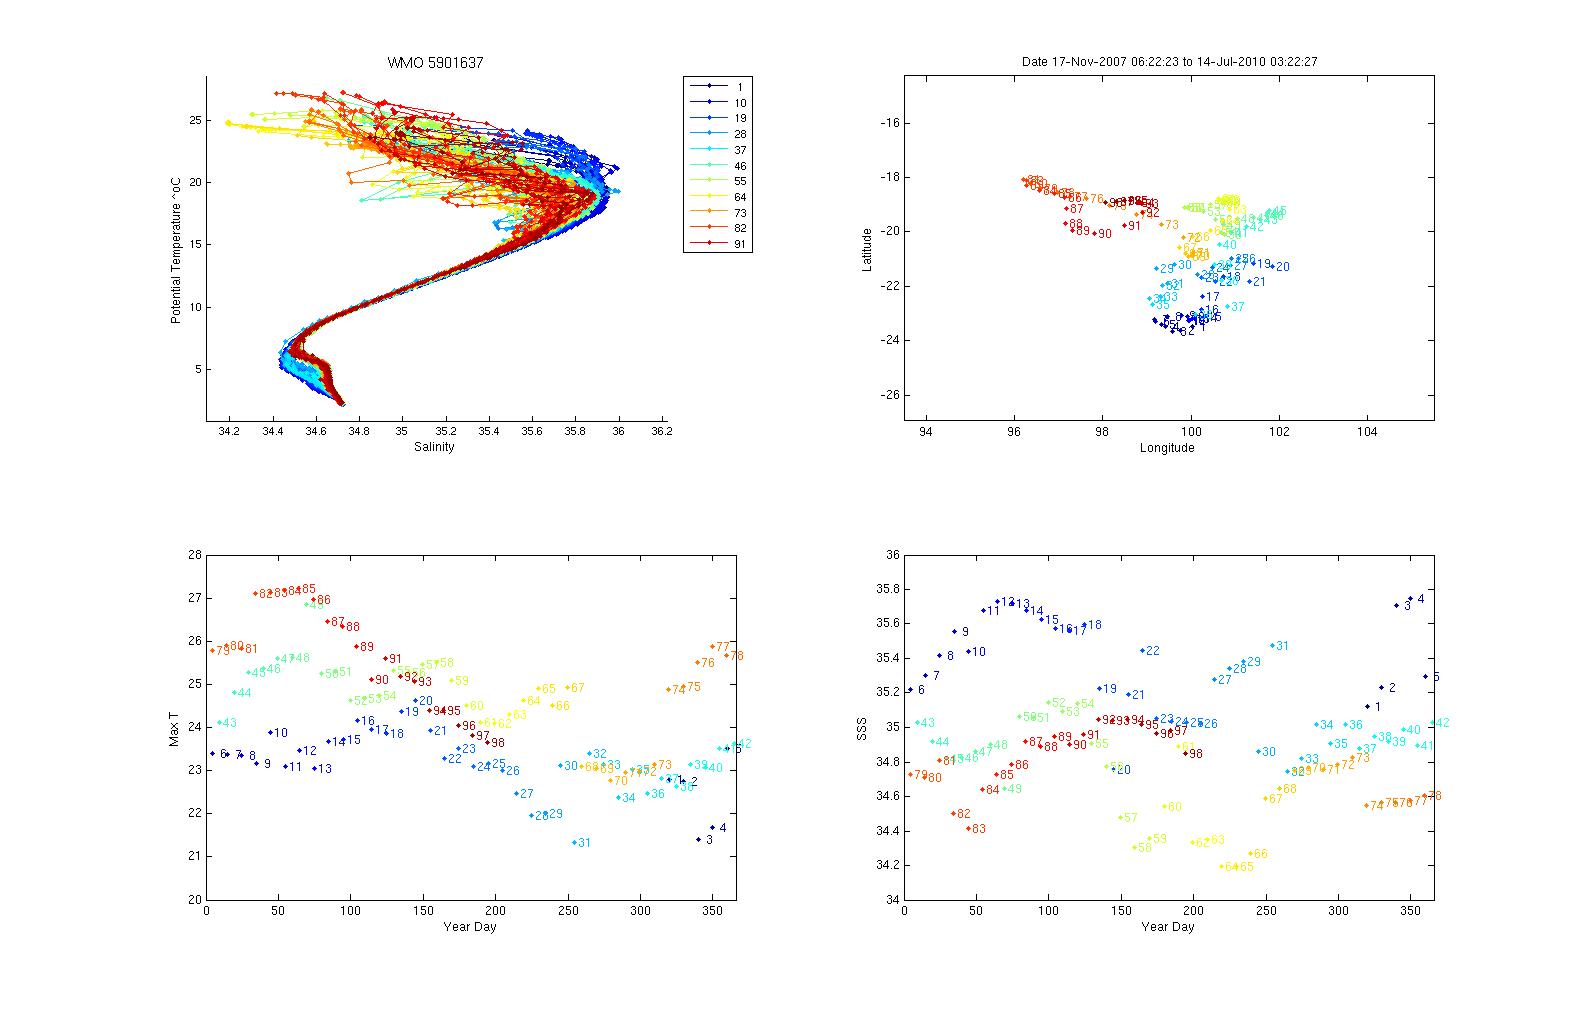
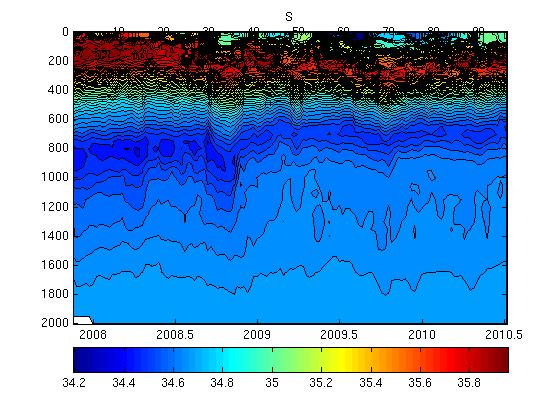
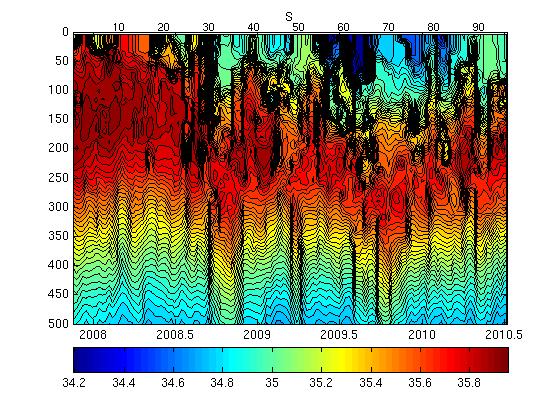
Surface temperatures generally varied between 21 and 25 şC and surface salinities from 34.7 to 35.8.
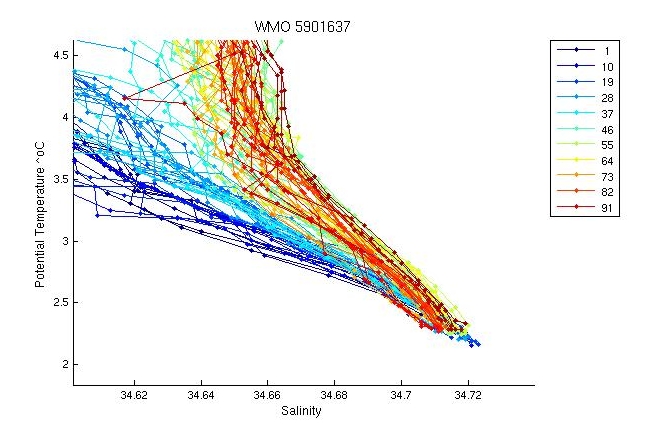
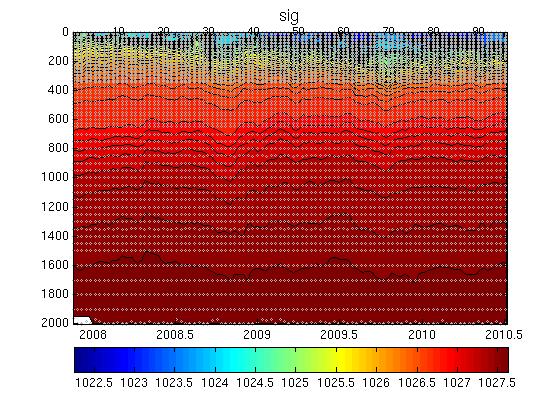
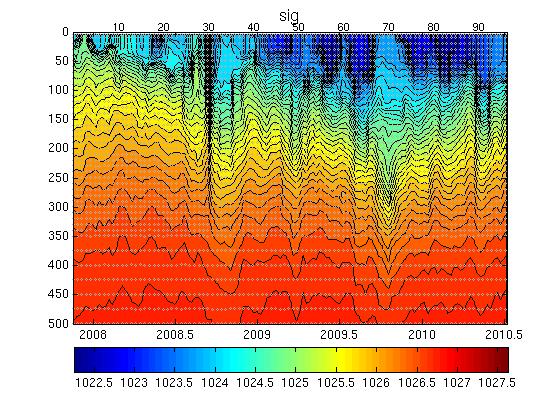
The plot below shows the potential-temperature/salinity relationship for the deepest theta levels where the relationship between the two parameters should show the least variation.
There is a high degree of variability evident in the profiles for this float throughout the water column. The latest profiles are particularly salty. Profile 31 appears to be warmer and fresher above the salinity minimum compared to neighbouring profiles.
The two plots below show a). the location of this float (black circles) in relation to the position of other nearby argo floats (coloured circles) and b). The potential-temperature/salinity curve for this float (in black) compared to nearby argo floats (coloured).
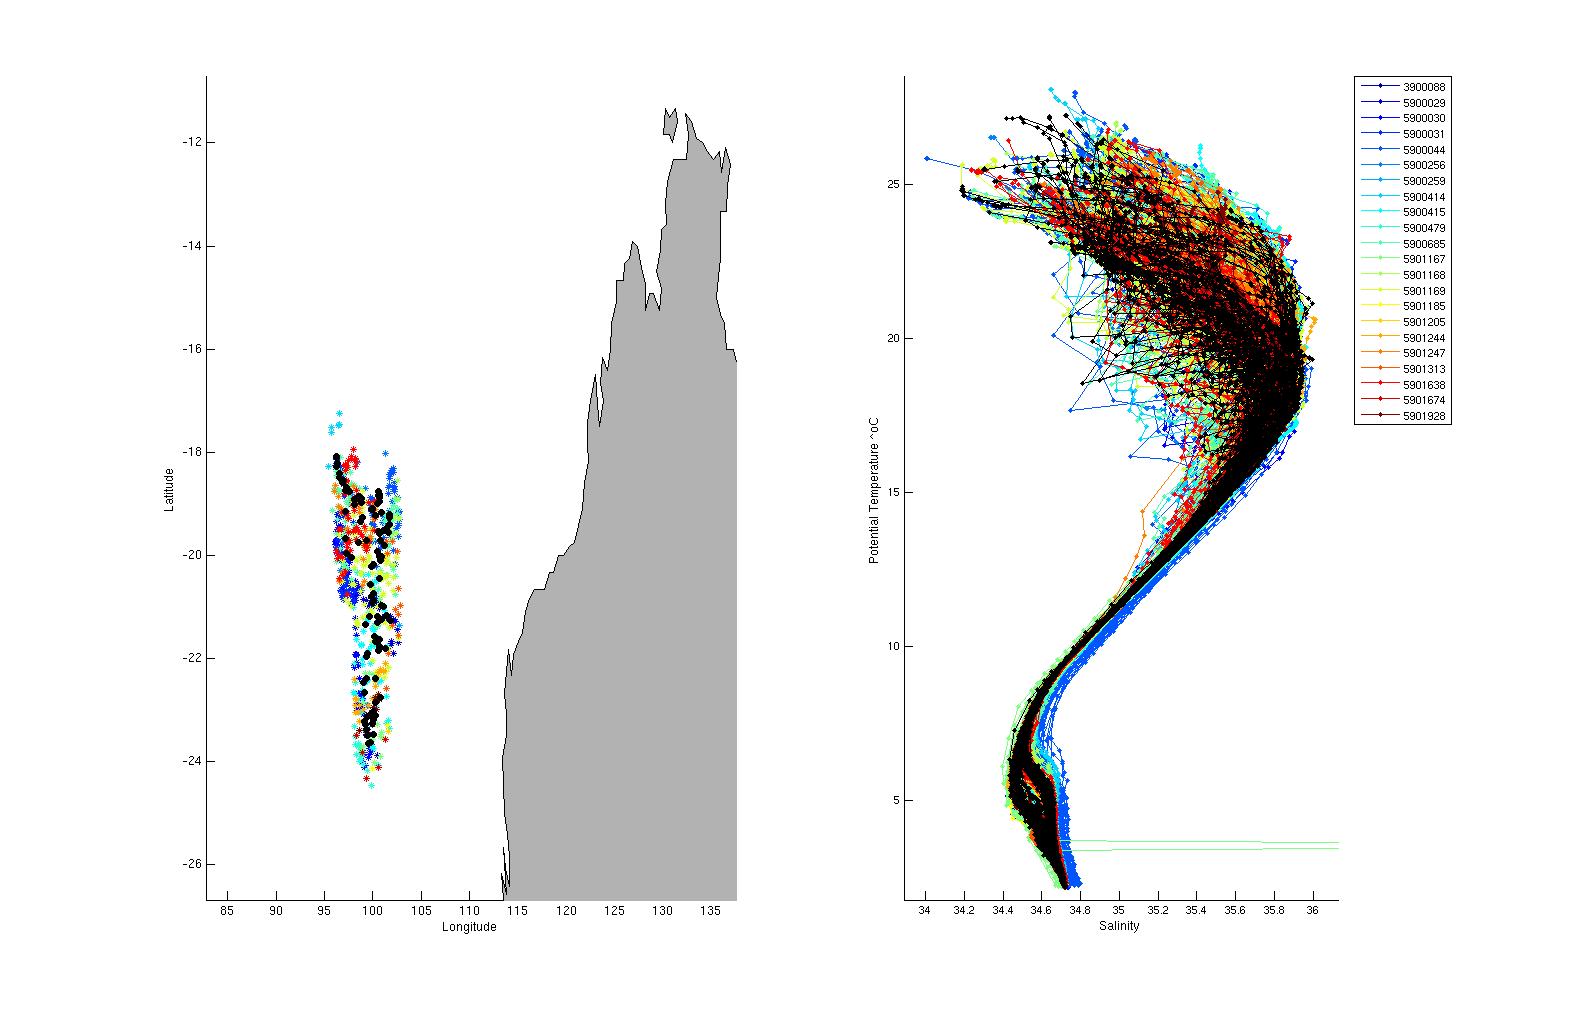
The potential-temperature/salinity relation for the deepest theta levels for this float (in black) and nearby argo floats (coloured) is displayed below.
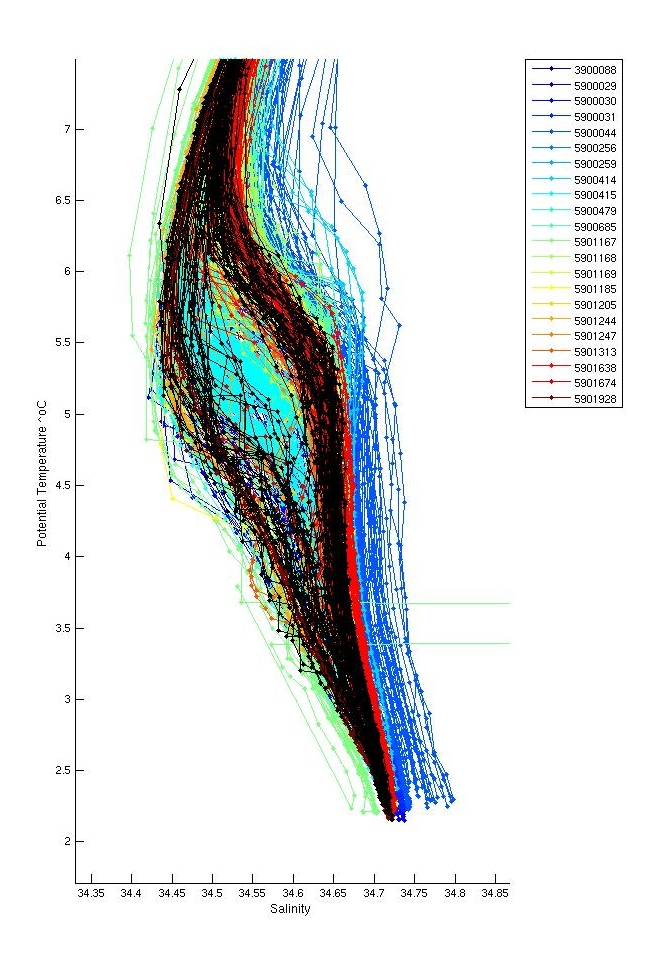
The profiles for this float are reasonable compared to neighbouring floats but do hang somewhat fresh between potential temperatures of 3.2 to 5 °C. Overall, through the whole water column however, the profiles for this float look okay.
There were no inversions.
Salt hooks were located in profiles; 2,3,8,10,12,13,15,17,20,22,23,27,28,30,31,35,37,38,39,40,41,46,49,51,53,58,60,62,64,66,68,70,72,74,76,78,80,81. These were flagged as QC 4 for both T & S.
No changes made.
The plot below shows the analysis of salinity drift using the WJO/OW software.

The four plots below show the salinity anomalies on theta surfaces compared to (a) the Gouretski and Kolterman climatology, (b) the CARS (CSIRO Atlas of Regional Seas)/WOA (World Ocean Atlas) climatology, (c) the anomalies within the float series itself, (i.e. the salinity anomaly of each profile from the mean profile average for the float and (d) the raw float salinity compared to the CARS and G&K climatological salinity on a theta surface of 2.4 degrees C.
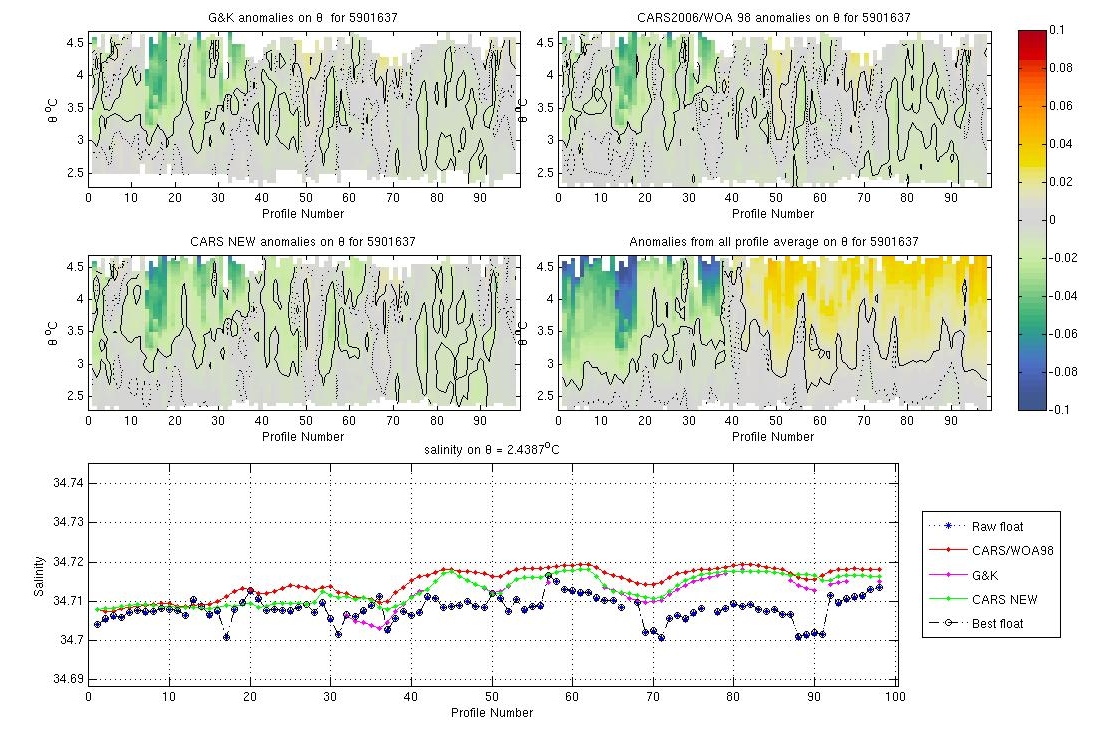
This float is close to both climatologies at the start of the record. It is slighlty fresher than climatologies towards the end of the record but the float is in a region of strong frontal gradients and seems to be crossing from one side of the front to the other on multiple occasions.
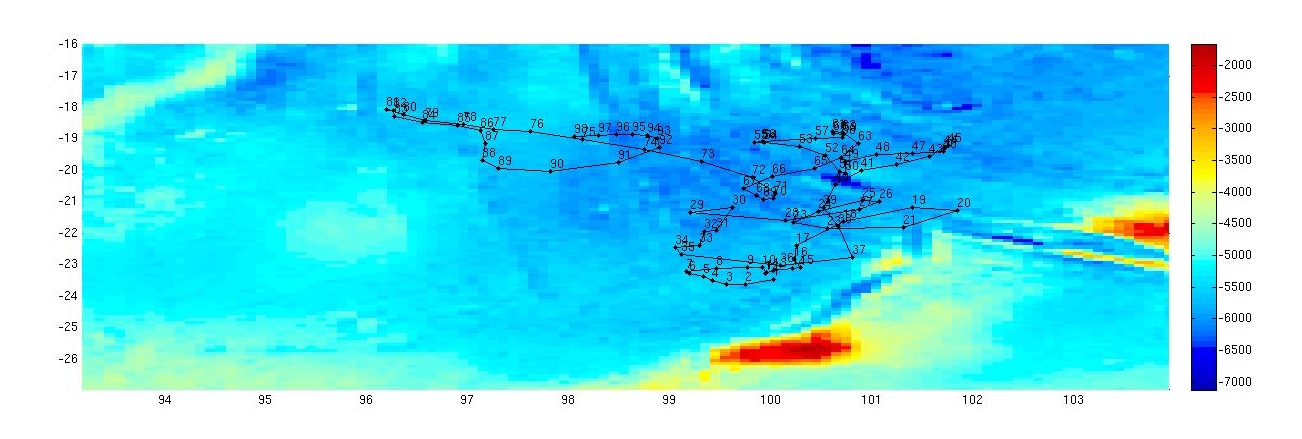
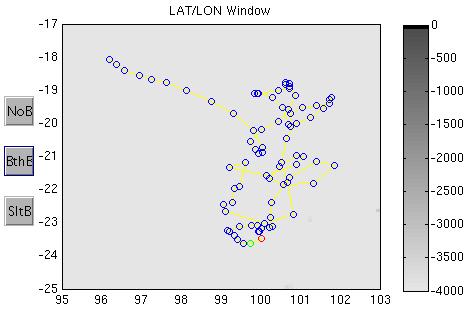
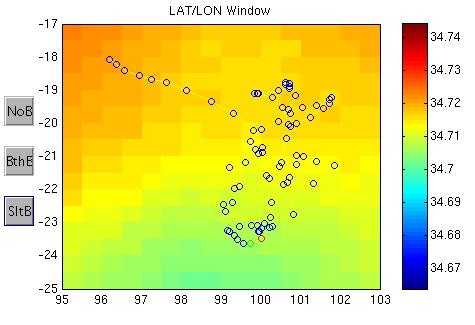
The plots below show the raw float salinity data (solid blue line) compared to neighbouring argo floats (coloured symbols) on a potential temperature surface of 2.6 degrees C. The locality map shows the location of the profiles for this float and for neighbouring floats.
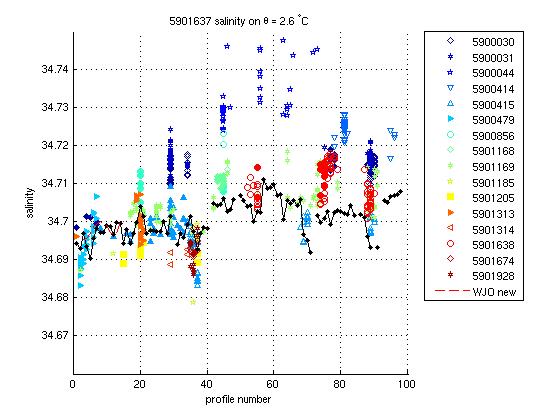
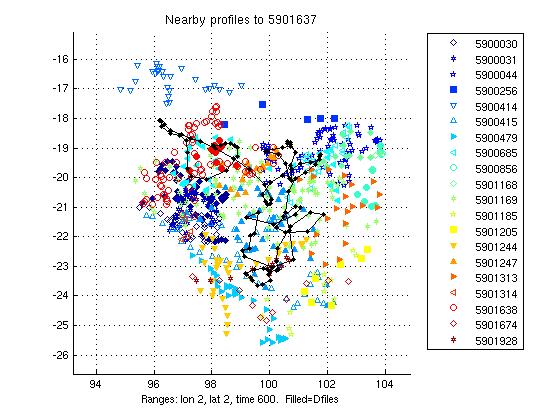
There is high variability at depth in neighbouring floats, the float is at the lower end of the nearby argo envelope but does not require correction.
This float required no salinity drift correction.
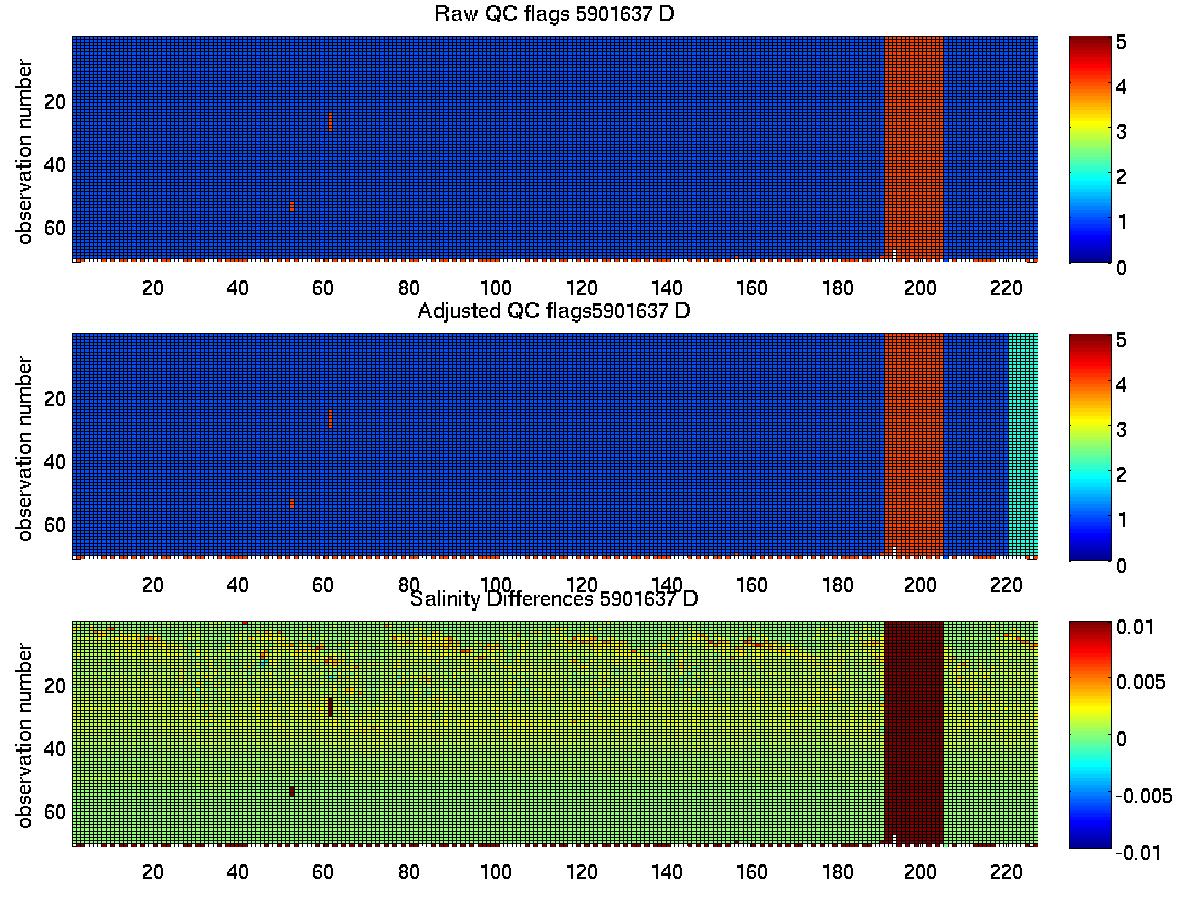
The plot below summarises the QC flags and salinity differences for the raw and adjusted salinity fields in the final delayed mode files submitted to the GDAC.
Created 29-07-2010