The table below provides basic information about the float, including primary sensors, mission parameters and current status of profiles.
| Institute | CSIRO |
| Principal Investigator | Susan Wijffels |
| Pressure Sensor | Druck (serial number=2402601) |
| CTD Sensor | APEX-SBE-41 (serial number=3311) |
| CTD Sampling Mode | Burst Sampler |
| Controller Board | APF 9 |
| Additional Sensors/Software | None |
| Park Depth | 1000 m |
| Profile Depth | 2000 m |
| Launch Date | 15-11-2007 |
| Number of D-moded Profiles | 81 |
| Calibration Date | 29-07-2010 |
| Pressure Drift | Surface Pressure Offset corrected |
| Salinity Drift | No salinity drift detected |
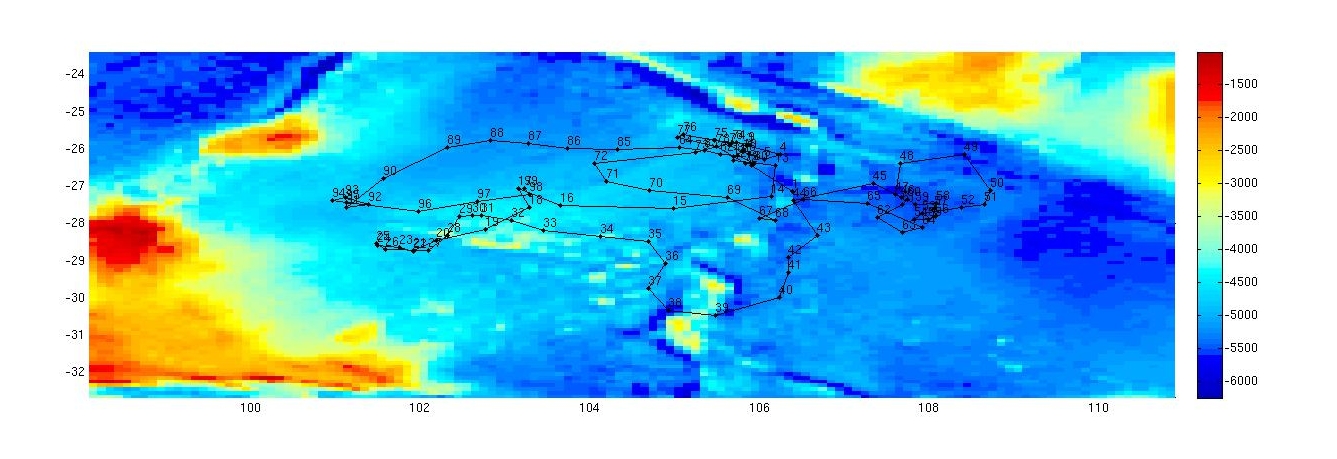
This float was located to the west of Geraldton, Western Australia, in a region bounded by 101 to 107 şE and 25 to 31 ş S.
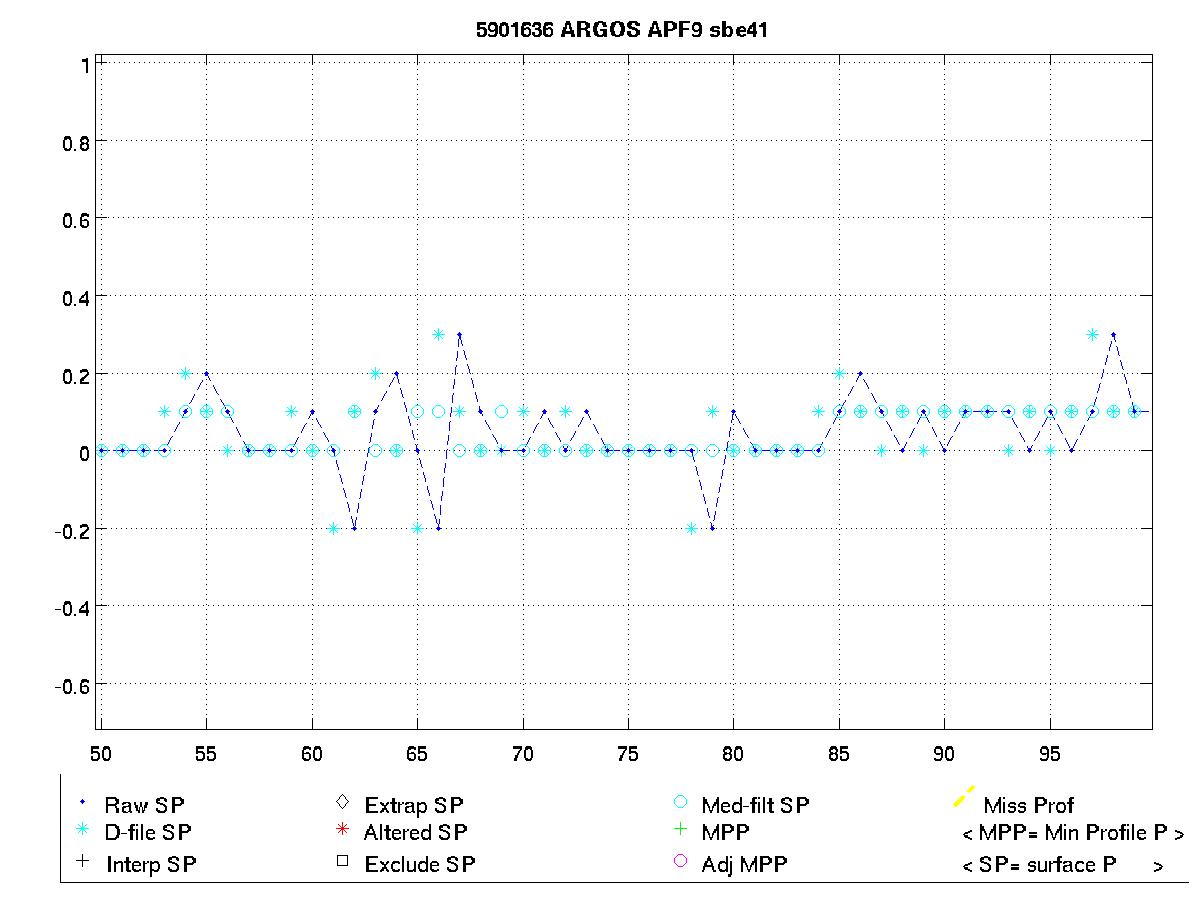
The surface pressure for this float is shown in the plot below.
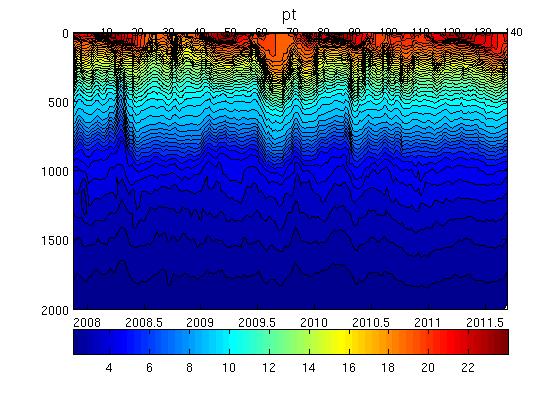
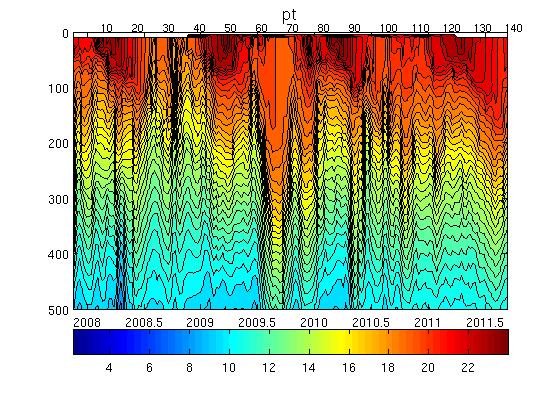
Potential Temperature-Salinity (a), Location (b, Max Temperature (c) and Sea Surface Salinity (d) plots located below.
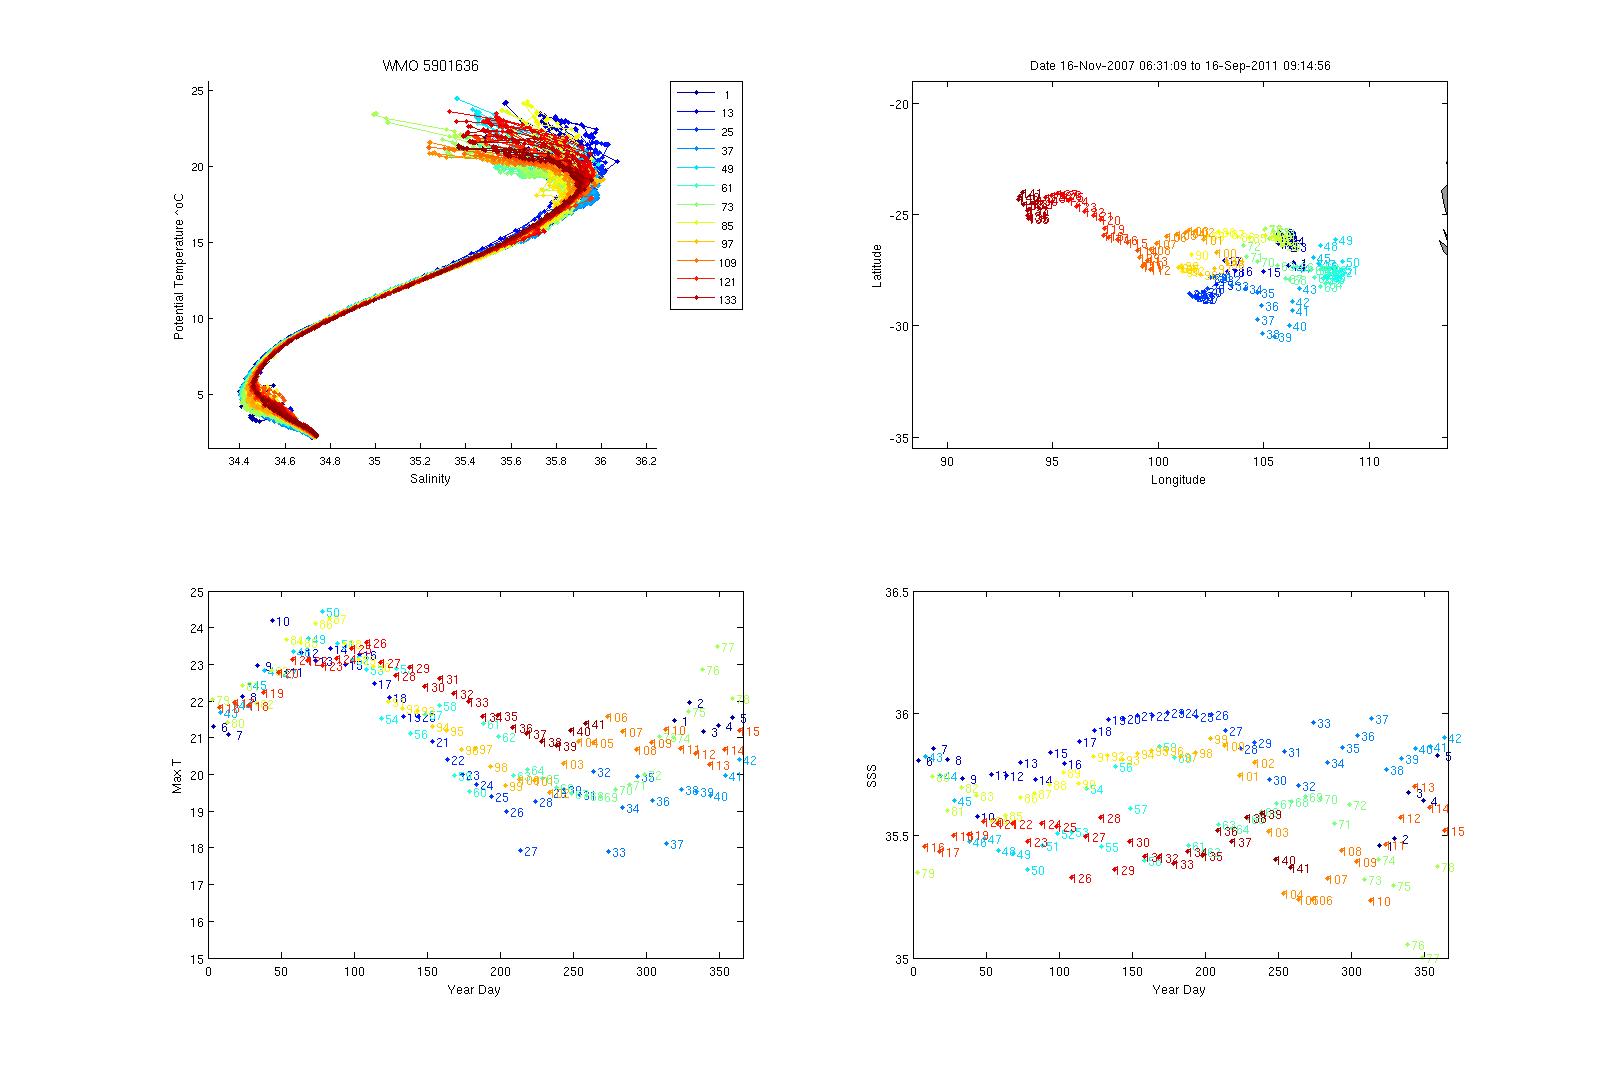
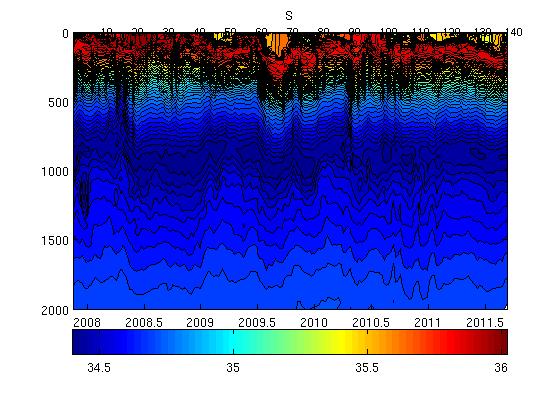
Surface temperatures generally varied between 17.5 and 24.5 şC and surface salinities from 35.4 to 36.0.
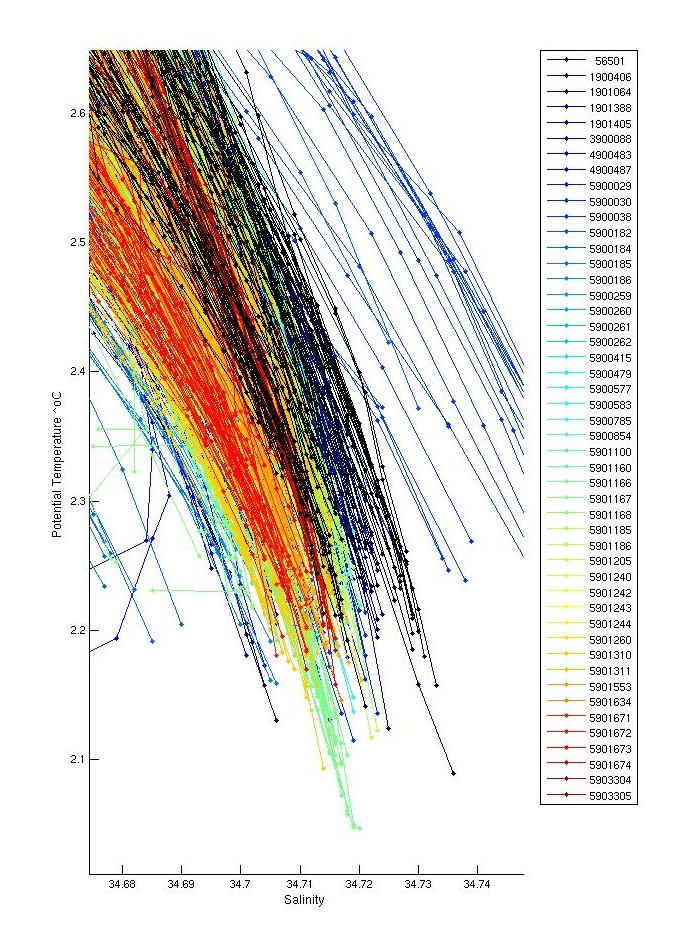
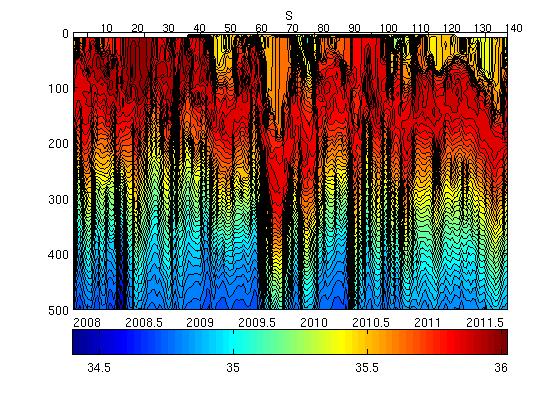
The plot below shows the potential-temperature/salinity relationship for the deepest theta levels where the relationship between the two parameters should show the least variation.
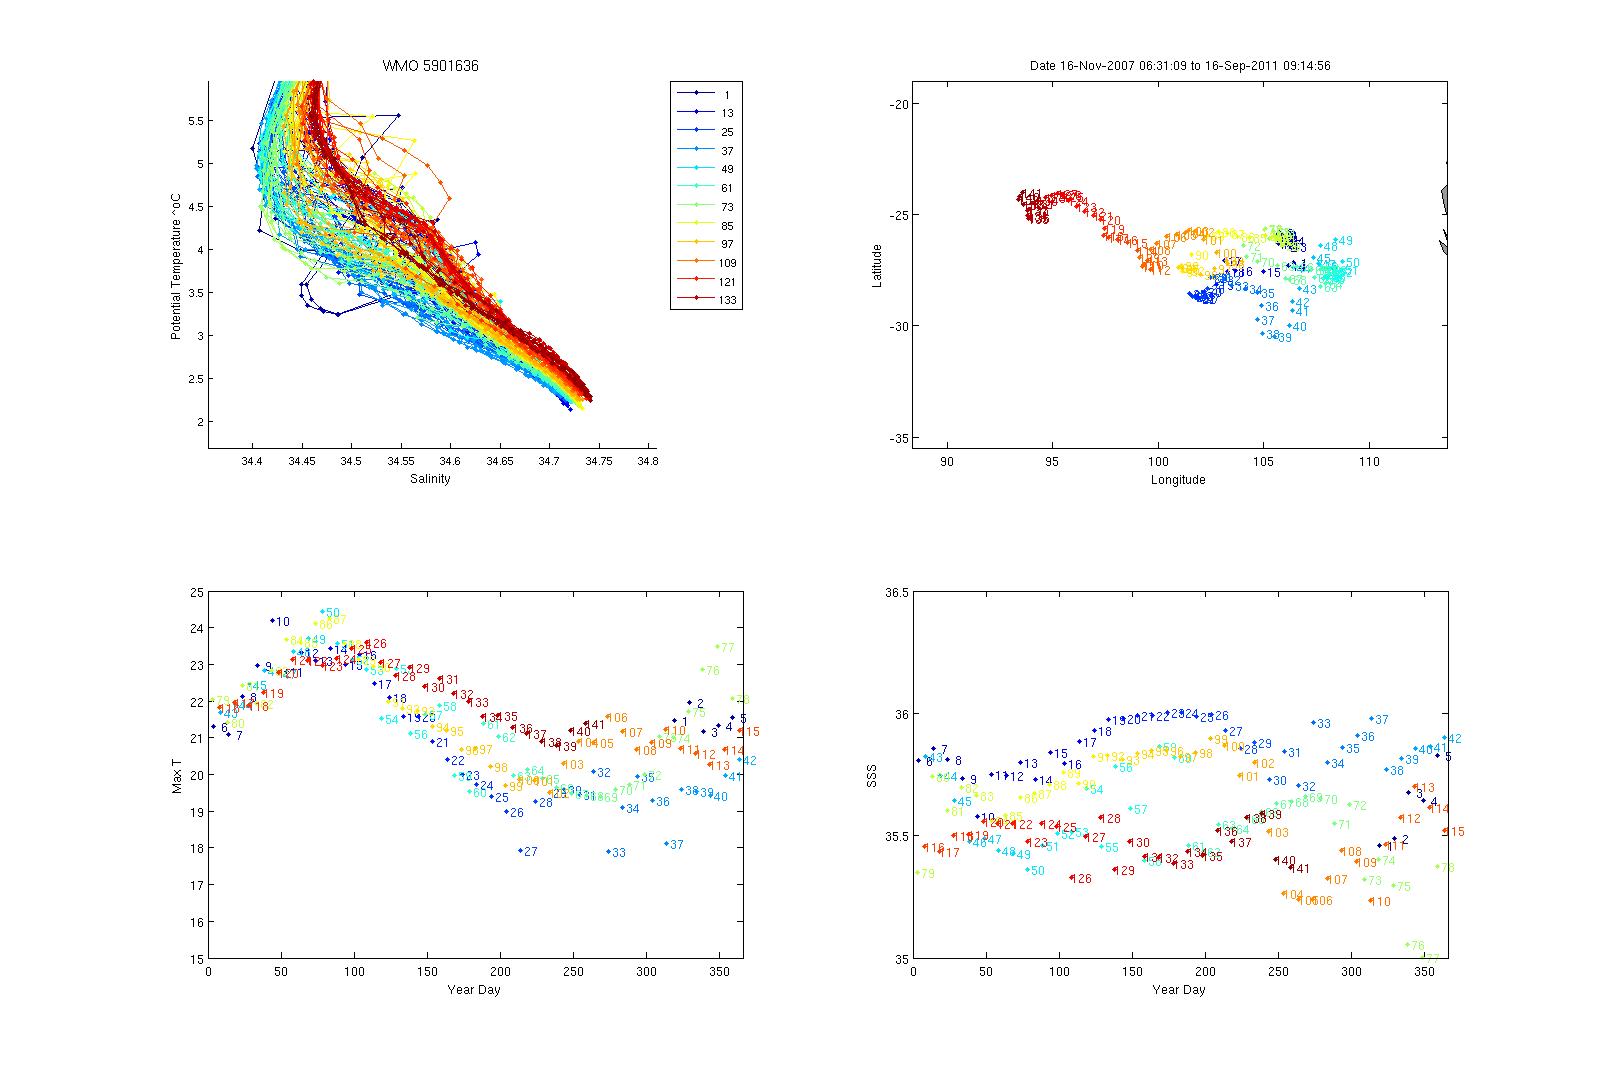
There is a large spread in the profiles at depth, some of the early profiles (1,4 and 5) show significant low salinity intrusions at depth. The high salinity intrusion at depth looks odd as it only occurs over one, possibly two, values.
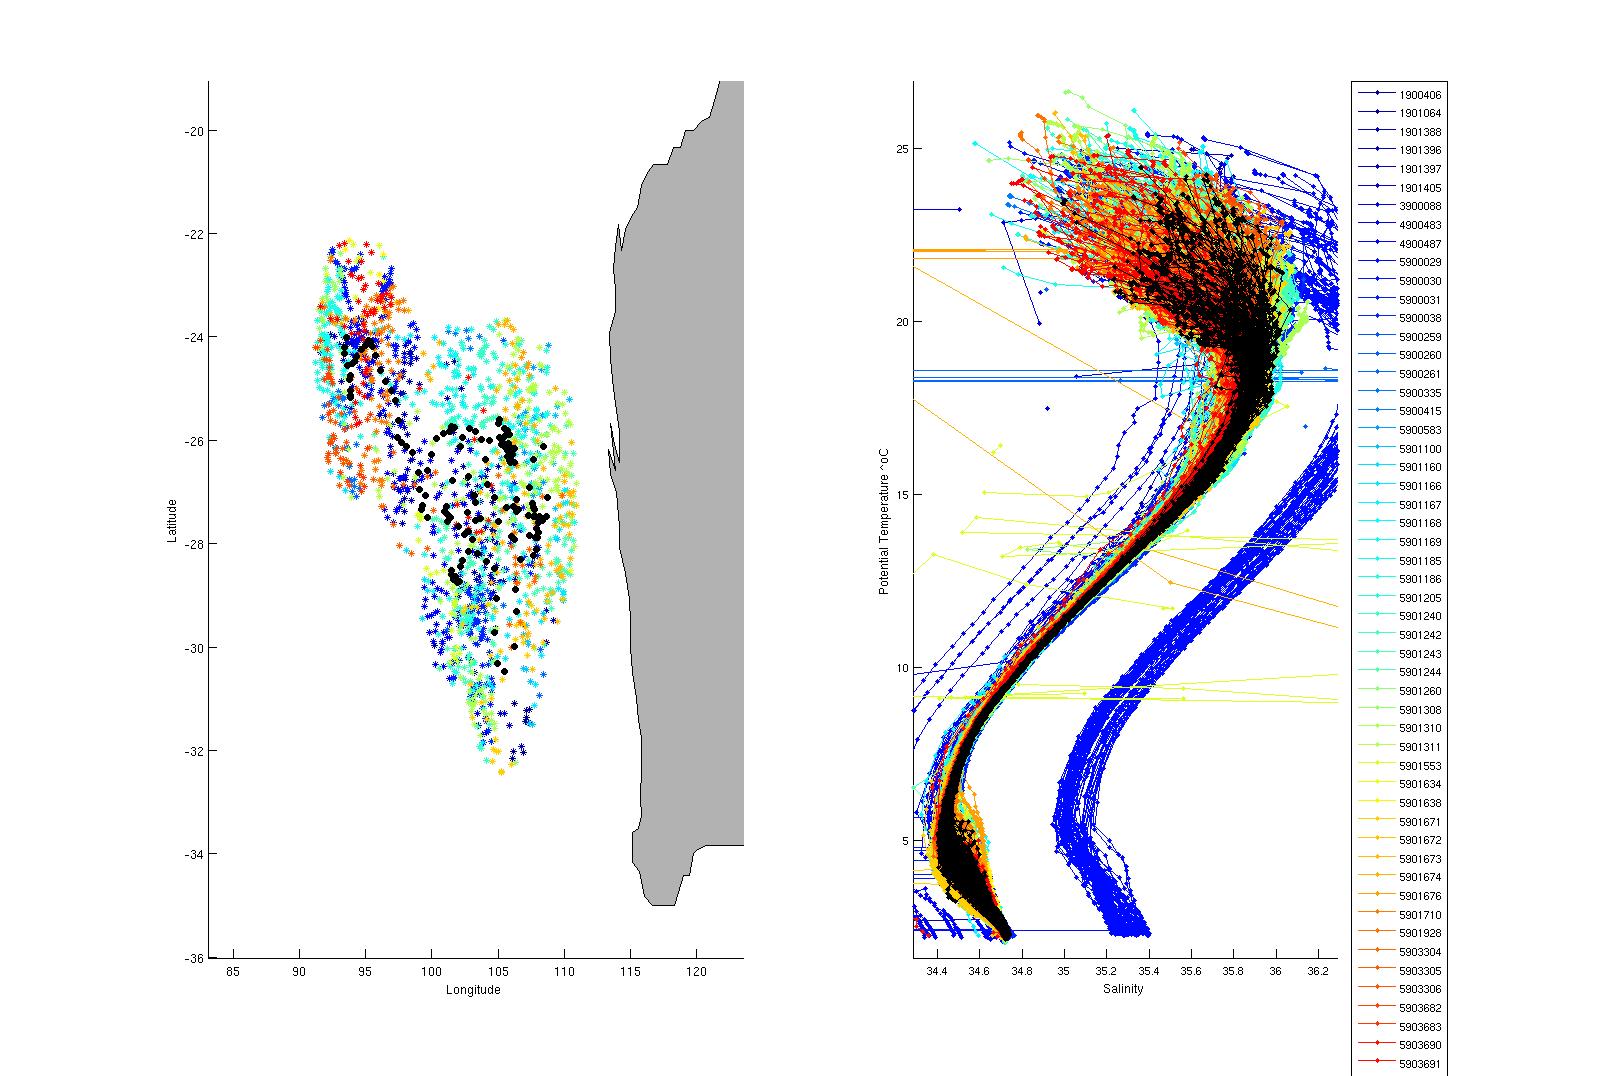
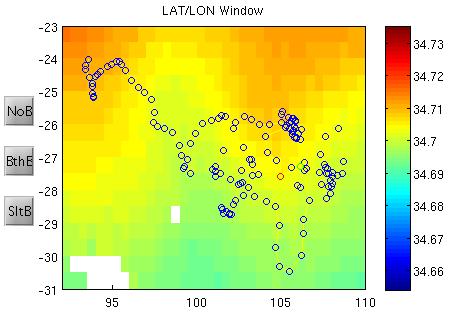
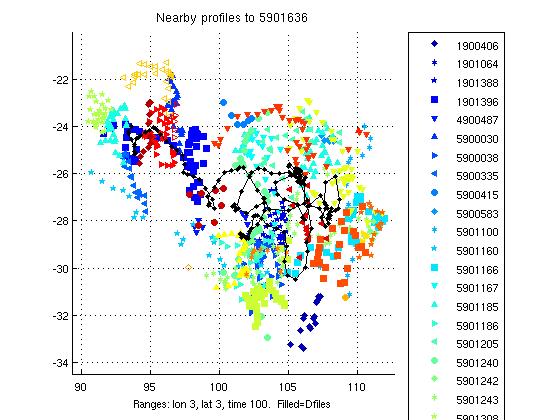
The two plots below show a). the location of this float (black circles) in relation to the position of other nearby argo floats (coloured circles) and b). The potential-temperature/salinity curve for this float (in black) compared to nearby argo floats (coloured).
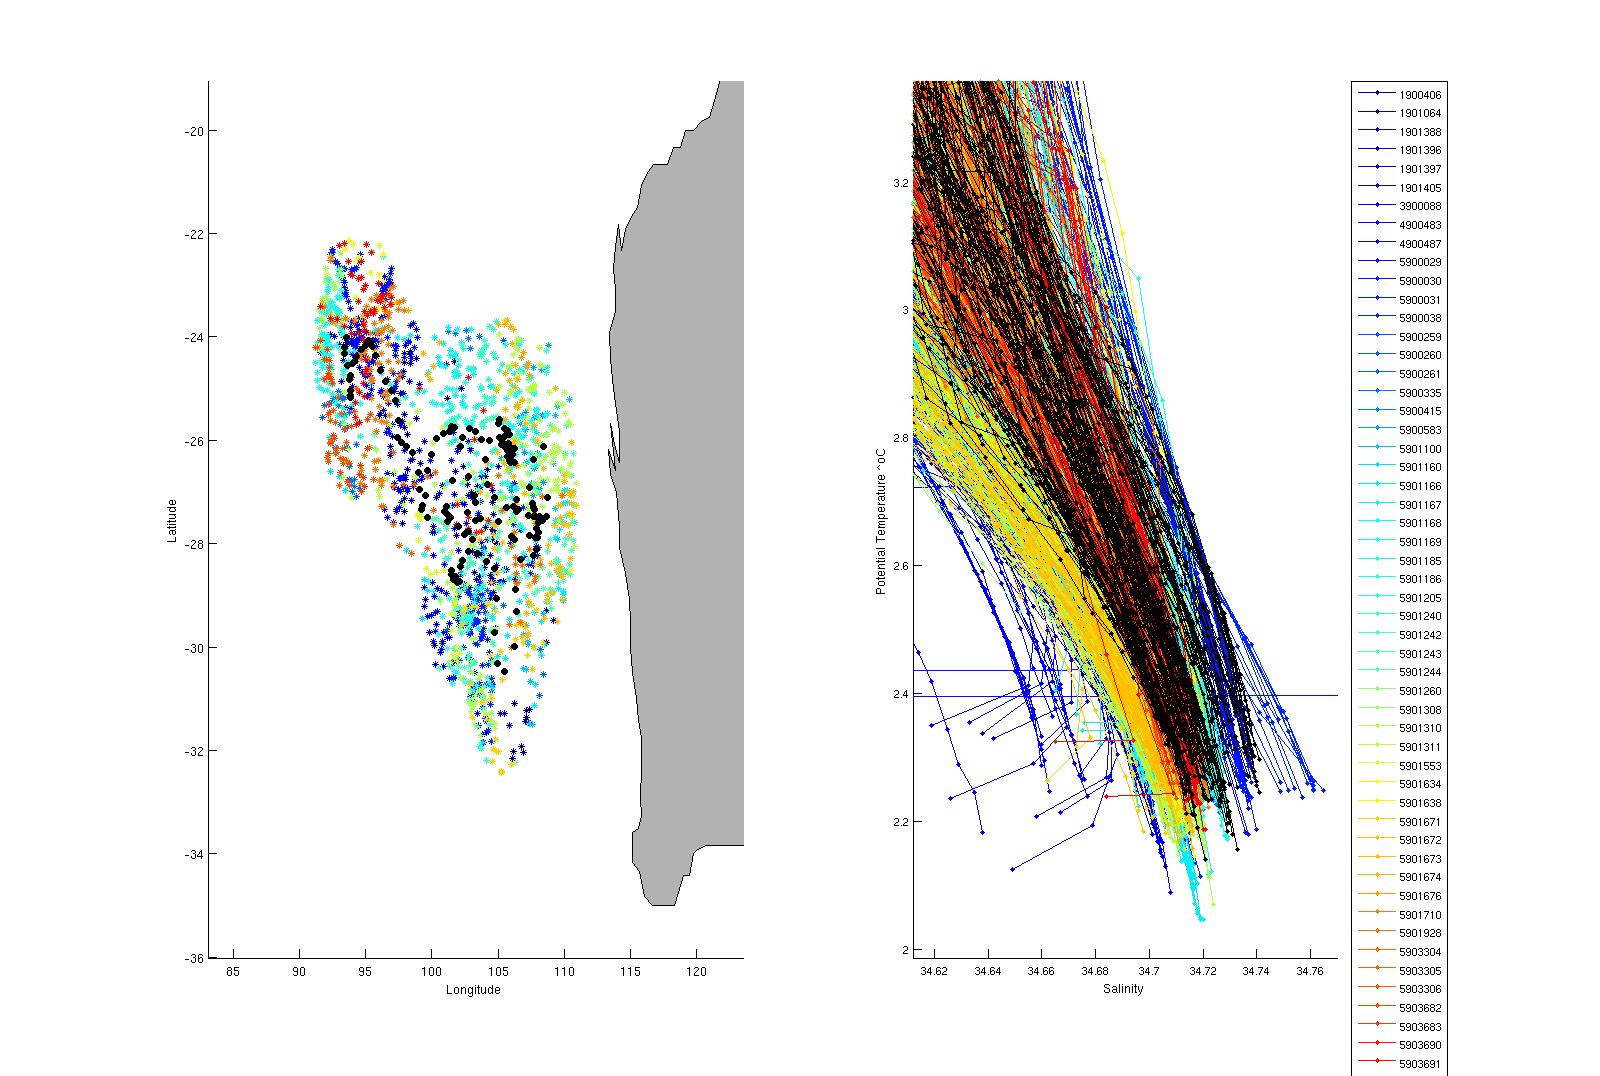
The potential-temperature/salinity relation for the deepest theta levels for this float (in black) and nearby argo floats (coloured) is displayed below.
The high salinity intrusion in profile 3 at depth was flagged as QC=4 as even though some neighbouring floats had similar high sal intrusions at depth, none were quite that salty at that theta level, so to be conservative we've flagged this spike. Profiles 1, 4 and 5 had low salinity intrusions at depths around 800 to 1000 m (pf 1) and 1000 to 1300m depth (pfs 4 and 5). These were checked in Gilson and seemed okay, as they occurred over more than one profile and over multiple depths. Even though neighbouring floats do not show the same intrusions leave in for now as this is a highly variable region and there simply may not be enough neighbouring data to make an adequate comparison.
There were no inversions.
Salt hooks were located in profiles; 1, 7, 11, 13, 15 and 19. These were flagged as QC 4 for both T & S.
No changes made.
The plot below shows the analysis of salinity drift using the WJO/OW software.

The four plots below show the salinity anomalies on theta surfaces compared to (a) the Gouretski and Kolterman climatology, (b) the CARS (CSIRO Atlas of Regional Seas)/WOA (World Ocean Atlas) climatology, (c) the anomalies within the float series itself, (i.e. the salinity anomaly of each profile from the mean profile average for the float and (d) the raw float salinity compared to the CARS and G&K climatological salinity on a theta surface of 0.xx degrees C.
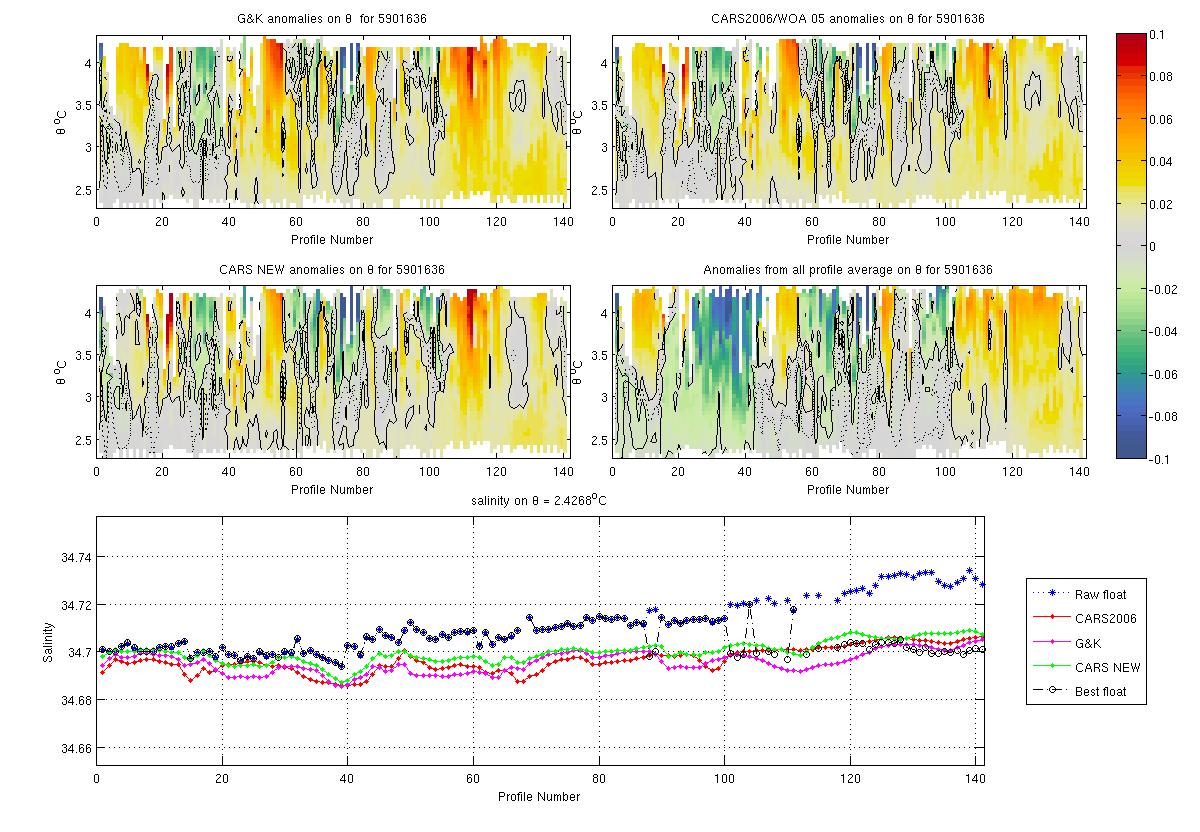
This float is stable to around +- 0.005 psu within the float record. It is very close to climatologies at the start of the record and then appears to drift salt, comparison with nearby argo shows this is not the case.
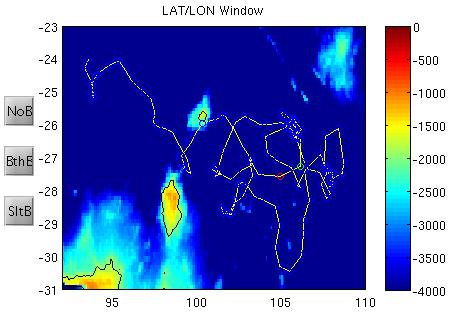
The plots below show the raw float salinity data (solid blue line) compared to neighbouring argo floats (coloured symbols) on a potential temperature surface of xx degrees C. The locality map shows the location of the profiles for this float and for neighbouring floats.
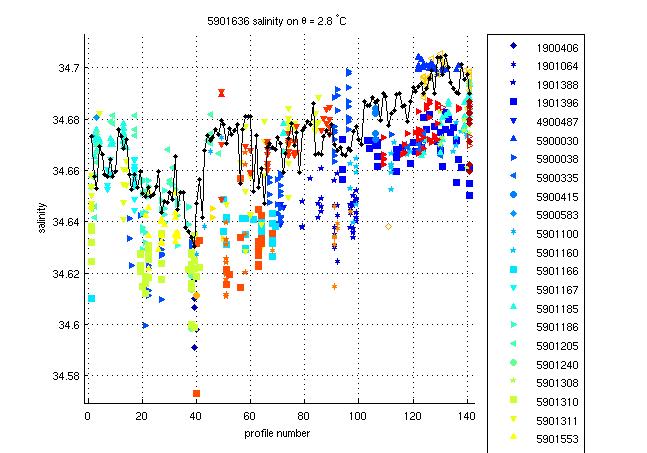
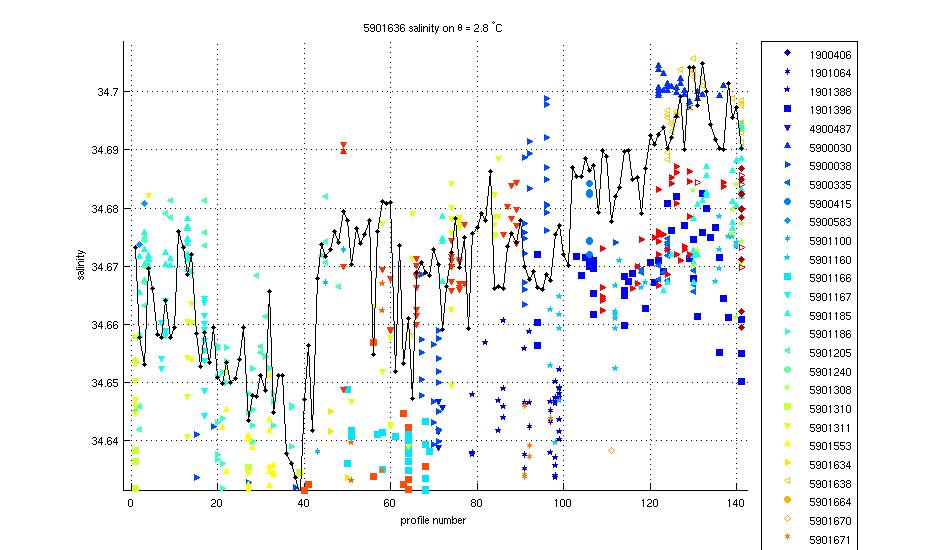
This is a highly variable region. The float looks like it might drift salty towards the end of the record however there are at least 5 other floats within 100 days and 1 x 1 deg that are similarly salty, so think this is real, no correction.
This float required no salinity drift correction.
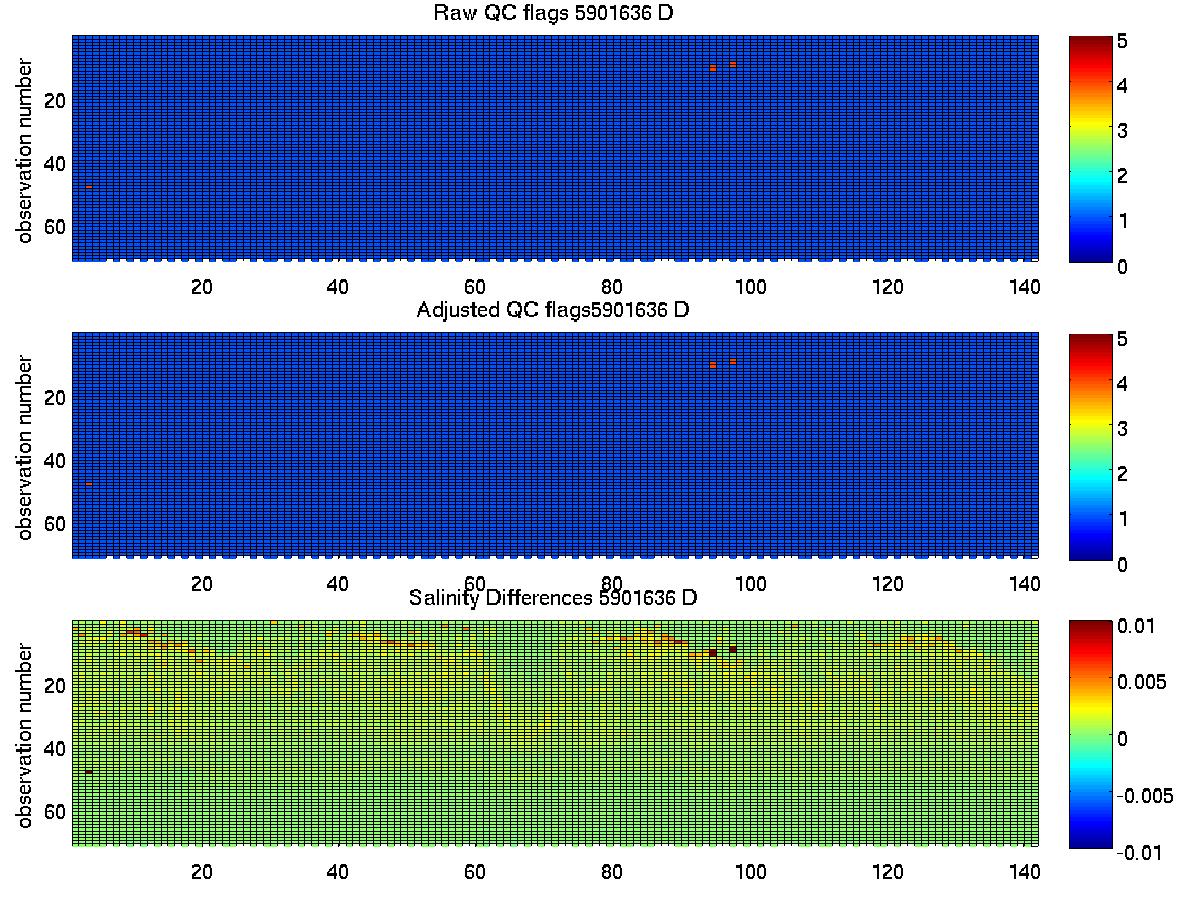
The plot below summarises the QC flags and salinity differences for the raw and adjusted salinity fields in the final delayed mode files submitted to the GDAC.
Created 27-09-2010