The table below provides basic information about the float, including primary sensors, mission parameters and current status of profiles.
| Institute | CSIRO | |
| Principal Investigator | Susan Wijffels | |
| Pressure Sensor | Druck (serial number=2402602) | |
| CTD Sensor | APEX-SBE-41 (serial number=3312) | |
| CTD Sampling Mode | Burst Sampler | |
| Controller Board | APF 8 | |
| Additional Sensors/Software | None | |
| Park Depth | 1000 m | |
| Profile Depth | 2000 m | |
| Launch Date | 14-11-2007 | |
| Number of D-moded Profiles | 81 | |
| Calibration Date | 29-07-2010 | |
| Pressure Drift | Surface Pressure Offset corrected | |
| Salinity Drift | No salinity drift detected |
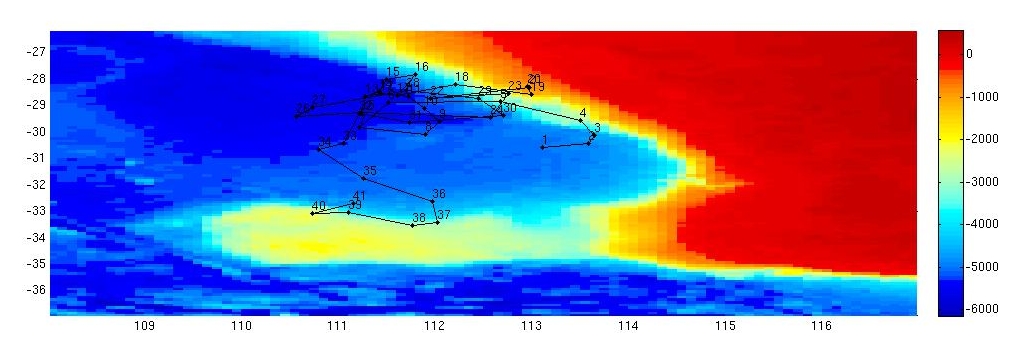
This float was located in the Indian Ocean, to the west of Geraldton, Western Australia, in a region bounded by 110 to 114 şE and 27 to 34 ş S.
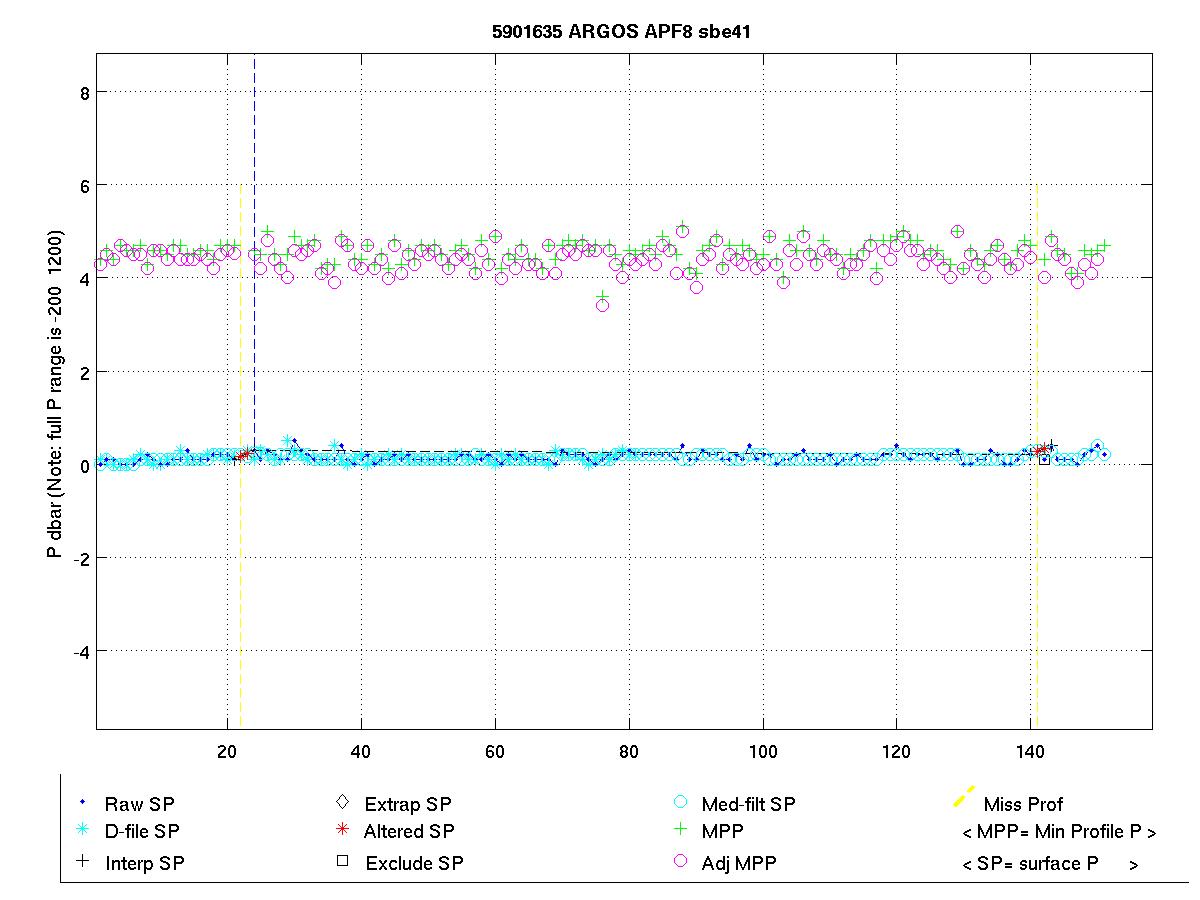
The surface pressure for this float is shown in the plot below.
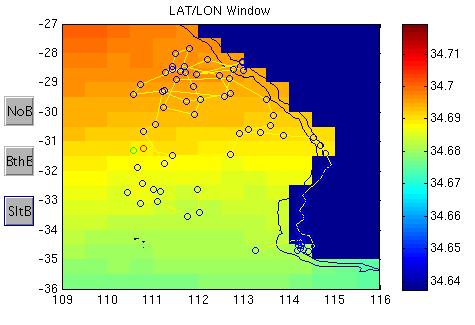
Potential Temperature-Salinity (a), Location (b, Max Temperature (c) and Sea Surface Salinity (d) plots located below.
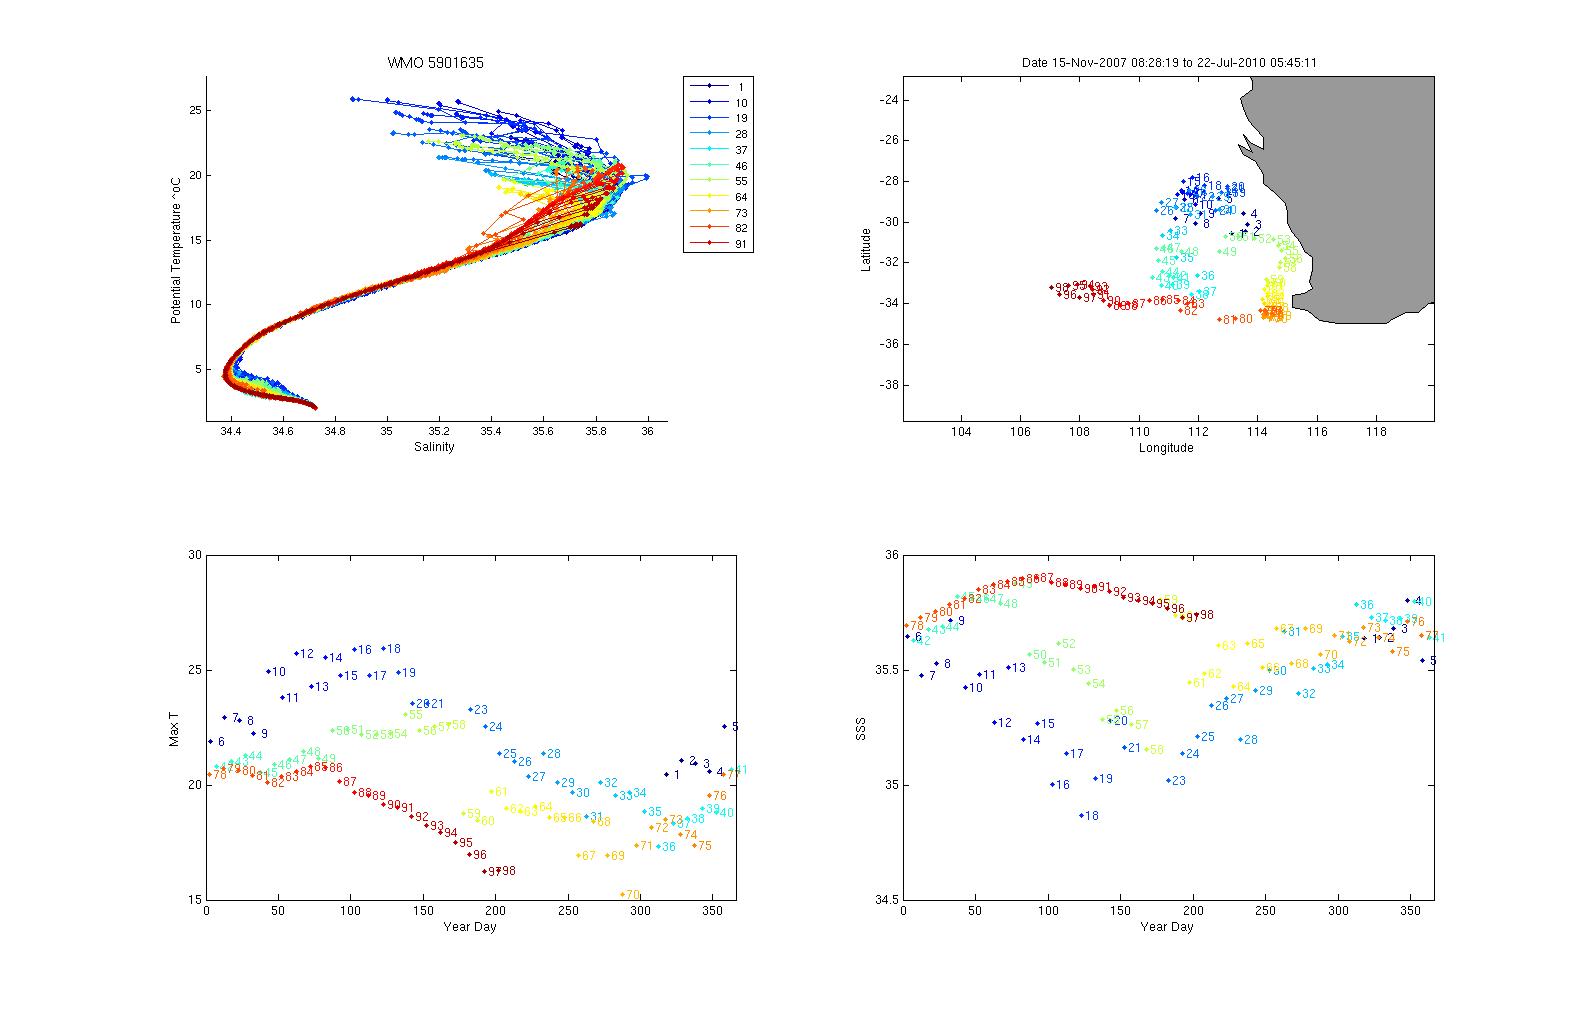
Surface temperatures generally varied between 18 and 27 şC and surface salinities from 34.8 to 35.8. The surface value for profile 22 looks suspicious. This is because this profile is missing data at the surface.
The plot below shows the potential-temperature/salinity relationship for the deepest theta levels where the relationship between the two parameters should show the least variation.
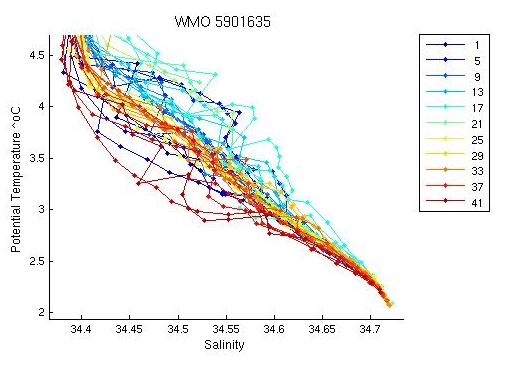
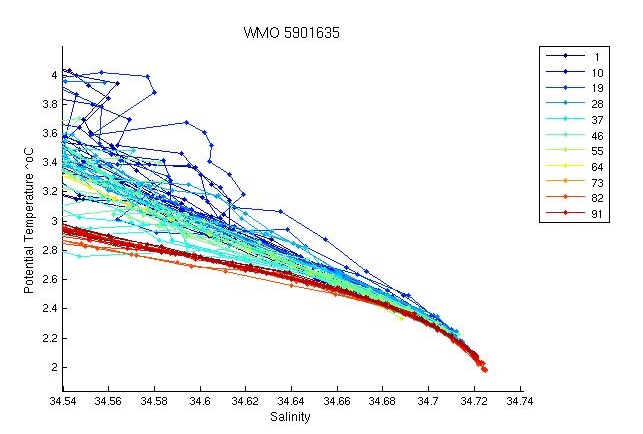
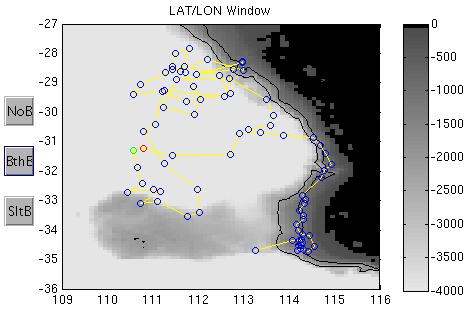
There is quite a spread in the profiles at depth but this looks reasonable. Lower salinity values are seen at depth for the earlier and later profiles corresponding to those sampled in the east and south of the area. There is a distinct salinity gradient in the region seen in the trajectory plot below so this is to be expected.
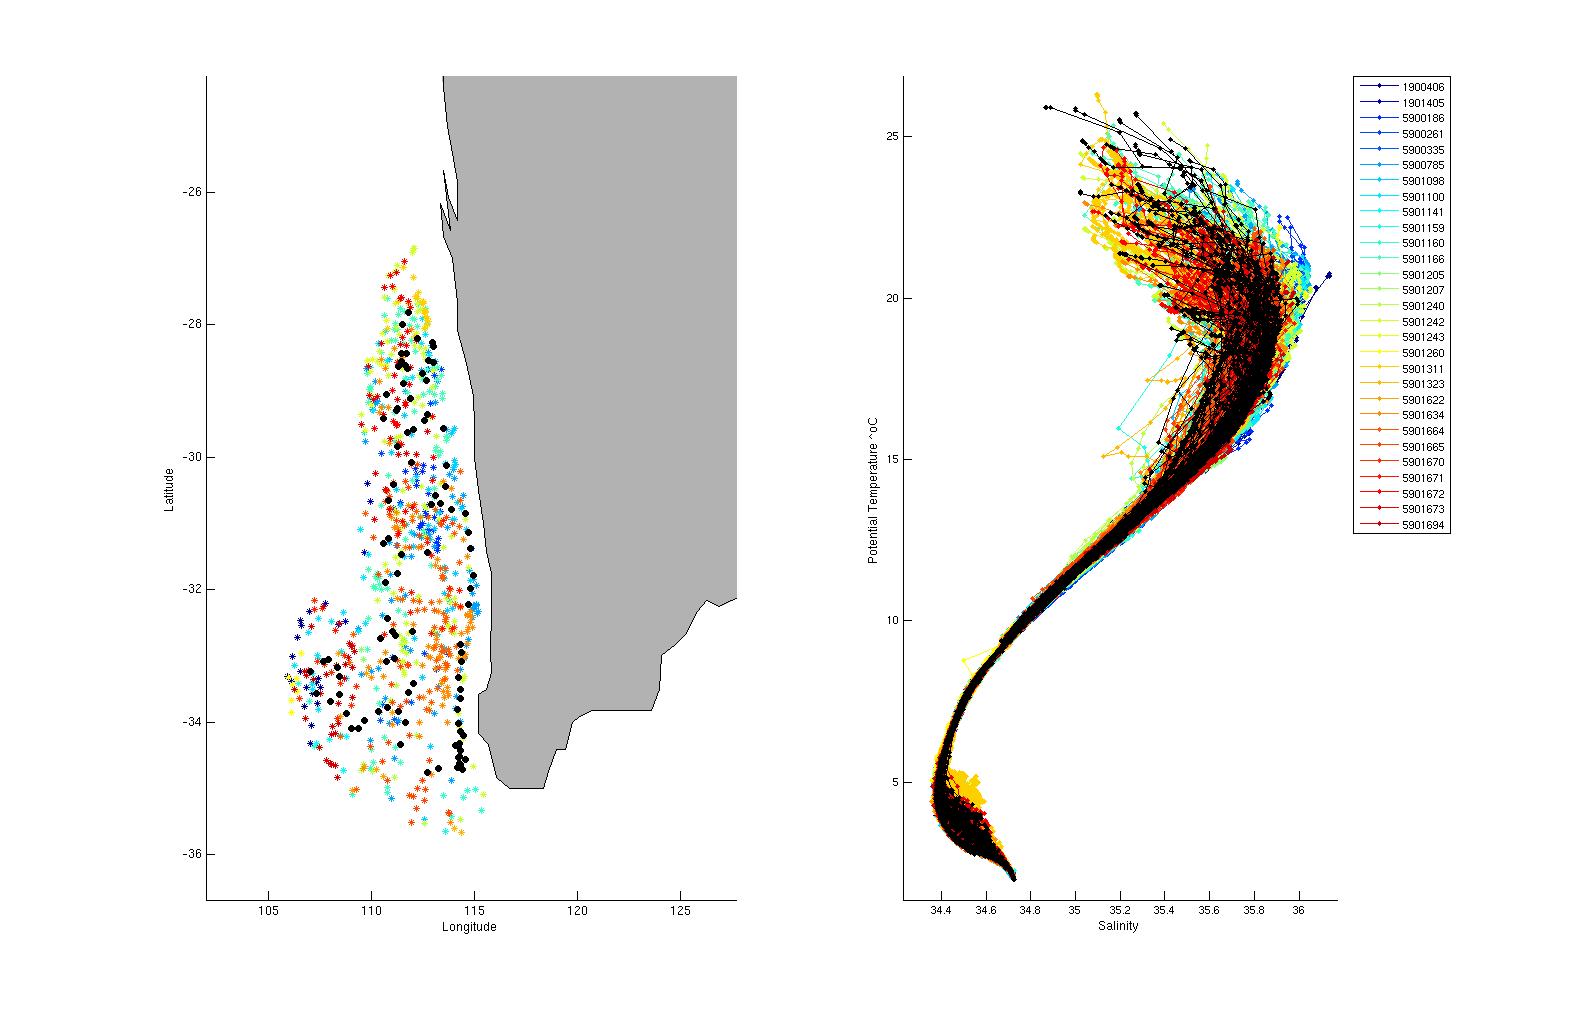
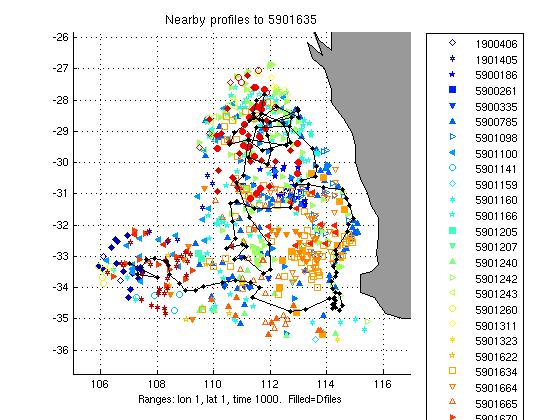
The two plots below show a). the location of this float (black circles) in relation to the position of other nearby argo floats (coloured circles) and b). The potential-temperature/salinity curve for this float (in black) compared to nearby argo floats (coloured).
The potential-temperature/salinity relation for the deepest theta levels for this float (in black) and nearby argo floats (coloured) is displayed below.
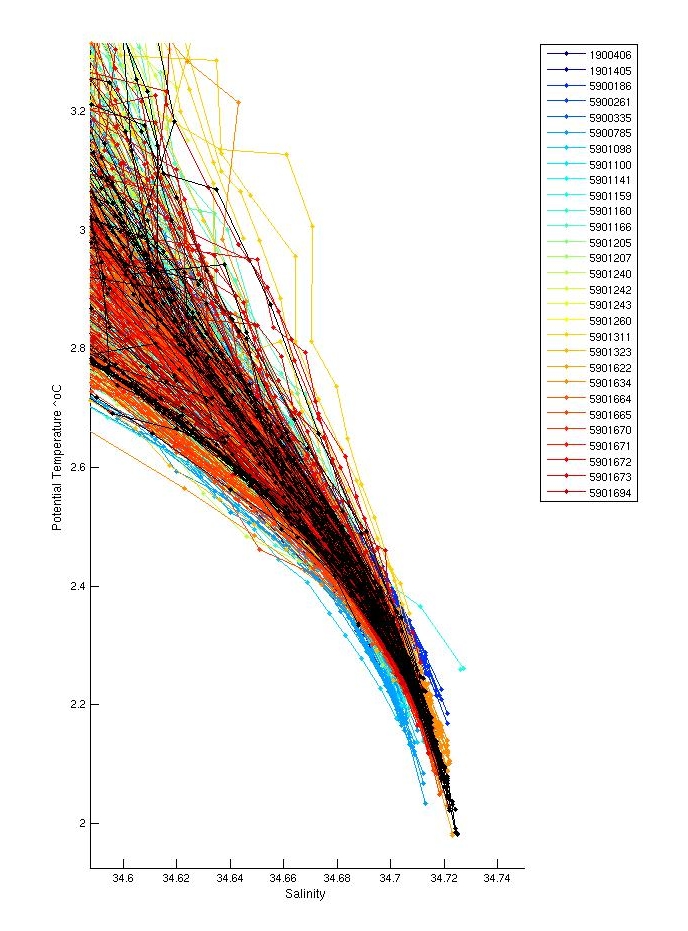
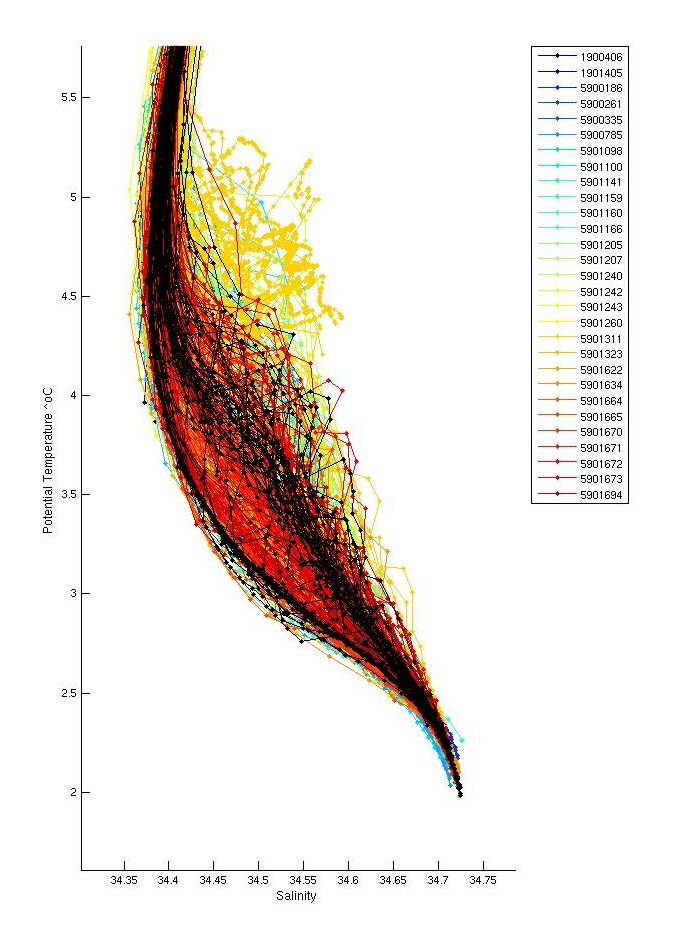
There is quite a spread in the profiles at depth but this looks reasonable compared to neighbouring floats. This float lies in the middle to upper end of the float envelope.
There was a surface inversion in profile 42 at the surface which was not significant and was not flagged.
Salt hooks were located in profiles; 4, 6, 7, 9, 11, 13, 16, 18 and 23. These were flagged as QC 4 for both T & S.
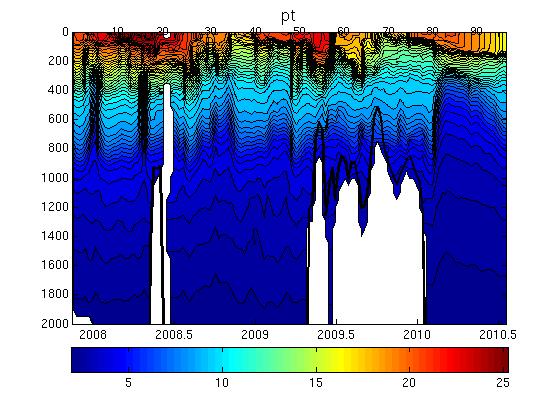
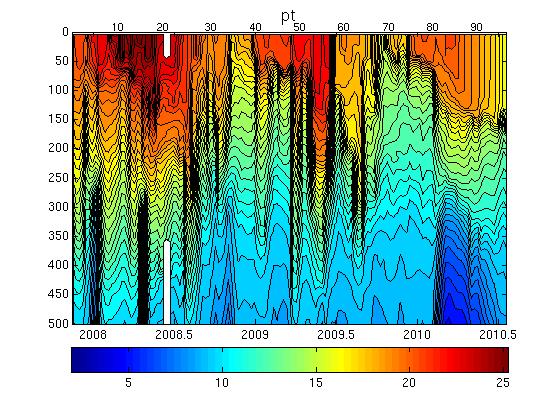
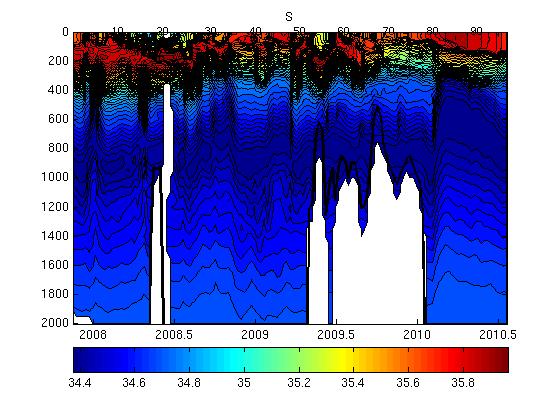
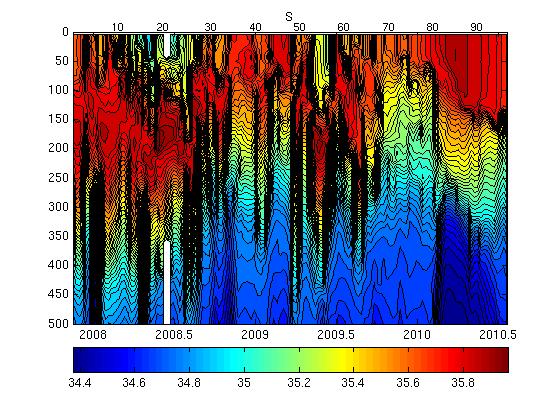
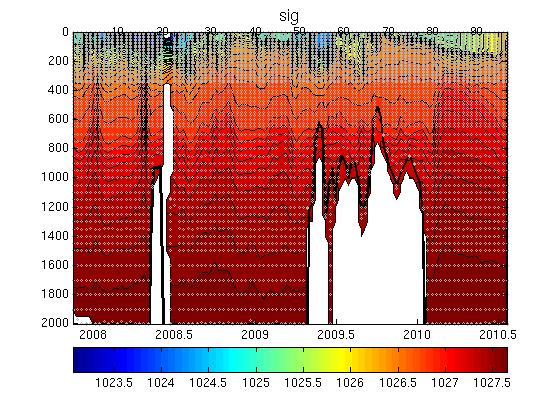
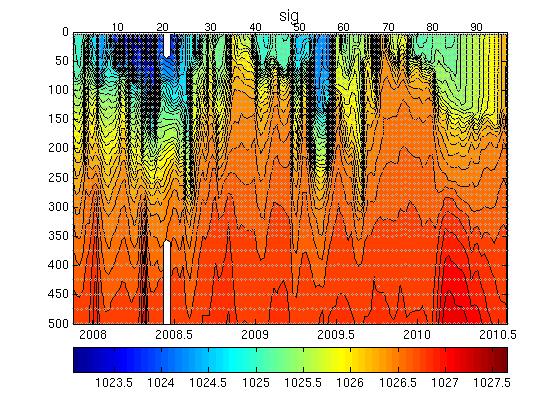
The float grounded over profiles; 19, 20, 21, 22, 23, 39 and 40. Profiles 22 and 23 are both missing data. There are several low salinity and low temperature intrusions at depth at profiles 6 and 17 which are not density compensated (see section plots). These are probably most similar hydrographically to profiles 32 and 35. Profile 6 and 17 are geographically close in space and also close to 32 although not 35 so much. Leave these in for now as they look like real variability. A few near bottom values were flagged as QC4 in profiles 19, 20, 21 and 23, where the float grounded as these looked strange. All of profile 23 was QC'd as 4 for both T & S as only the bottom half of this profile existed and it was highly saline, it's position may be wrong and it generally looked like bad data. Profile 22 was missing.
The plot below shows the analysis of salinity drift using the WJO/OW software.

This is placeholder text.
The four plots below show the salinity anomalies on theta surfaces compared to (a) the Gouretski and Kolterman climatology, (b) the CARS (CSIRO Atlas of Regional Seas)/WOA (World Ocean Atlas) climatology, (c) the anomalies within the float series itself, (i.e. the salinity anomaly of each profile from the mean profile average for the float and (d) the raw float salinity compared to the CARS and G&K climatological salinity on a theta surface of 0.xx degrees C.
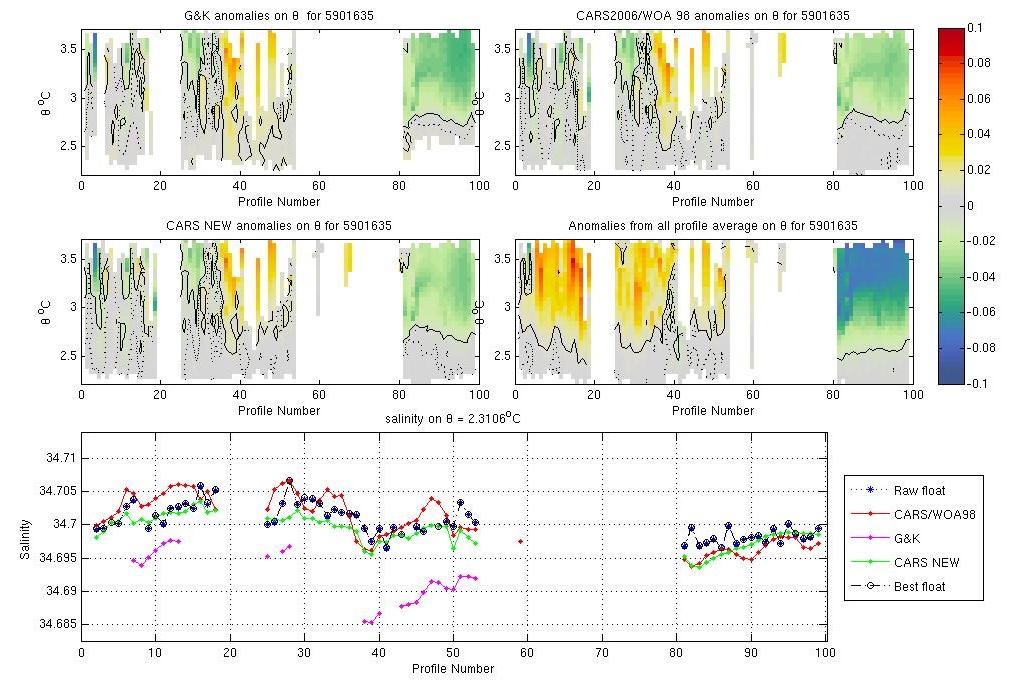
The float is very close to climatologies.
The plots below show the raw float salinity data (solid blue line) compared to neighbouring argo floats (coloured symbols) on a potential temperature surface of xx degrees C. The locality map shows the location of the profiles for this float and for neighbouring floats.
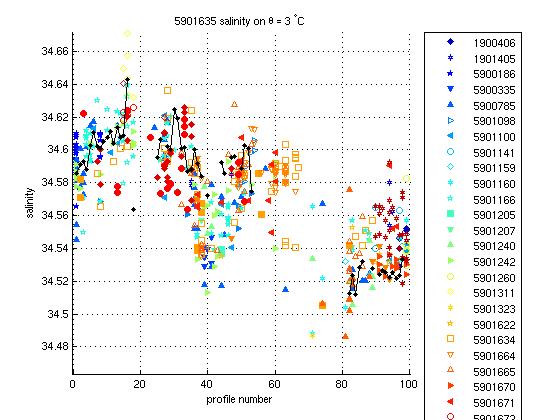
There is a high degree of variability in the nearby argo data however this float looks fine compared with nearby argo.
This float required no salinity drift correction.
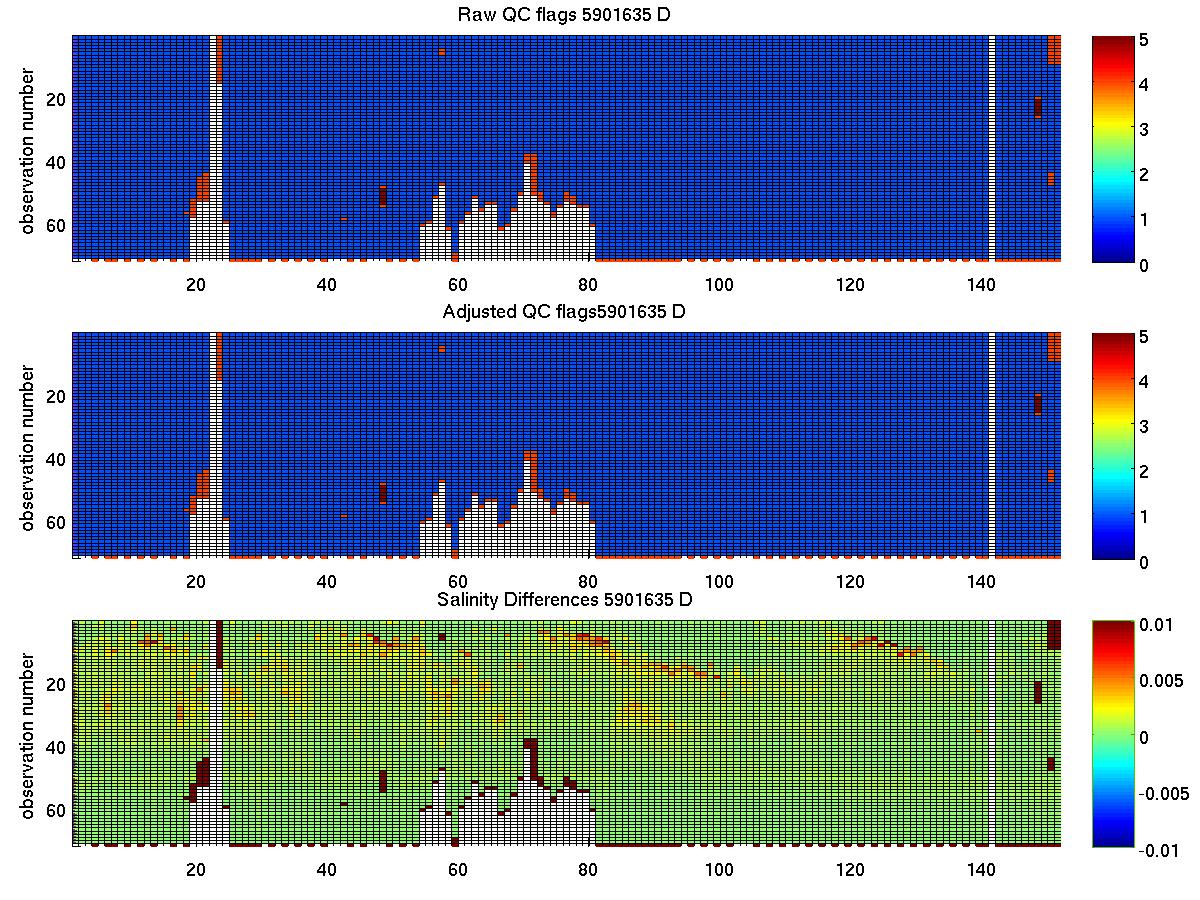
The plot below summarises the QC flags and salinity differences for the raw and adjusted salinity fields in the final delayed mode files submitted to the GDAC.
Created 29-07-2010