The table below provides basic information about the float, including primary sensors, mission parameters and current status of profiles.
| Institute | CSIRO |
| Principal Investigator | Susan Wijffels |
| Pressure Sensor | Druck (serial number=2409698) |
| CTD Sensor | APEX-SBE-41 (serial number=3321) |
| CTD Sampling Mode | Burst Sampler |
| Controller Board | APF 8 |
| Additional Sensors/Software | None |
| Park Depth | 1000 m |
| Profile Depth | 2000 m |
| Launch Date | 17-10-2007 |
| Number of D-moded Profiles | 84 |
| Calibration Date | 30-07-2010 |
| Pressure Drift | Surface Pressure Offset corrected |
| Salinity Drift | No salinity drift detected |
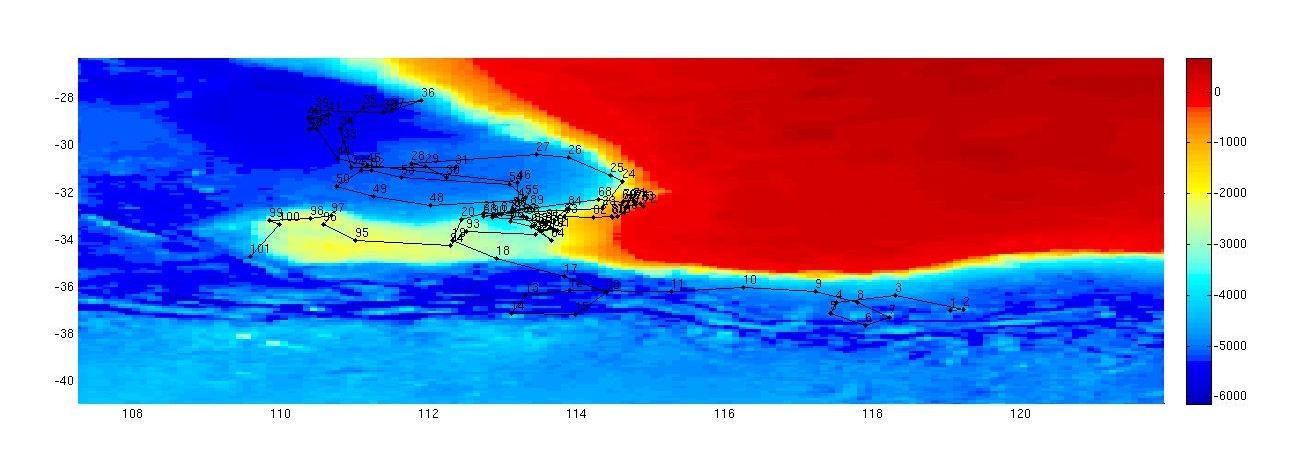
This float was located in the westerly sector of the Indonesian throughflow region in an area bounded by 87 to 91 şE and 15 to 18 ş S.
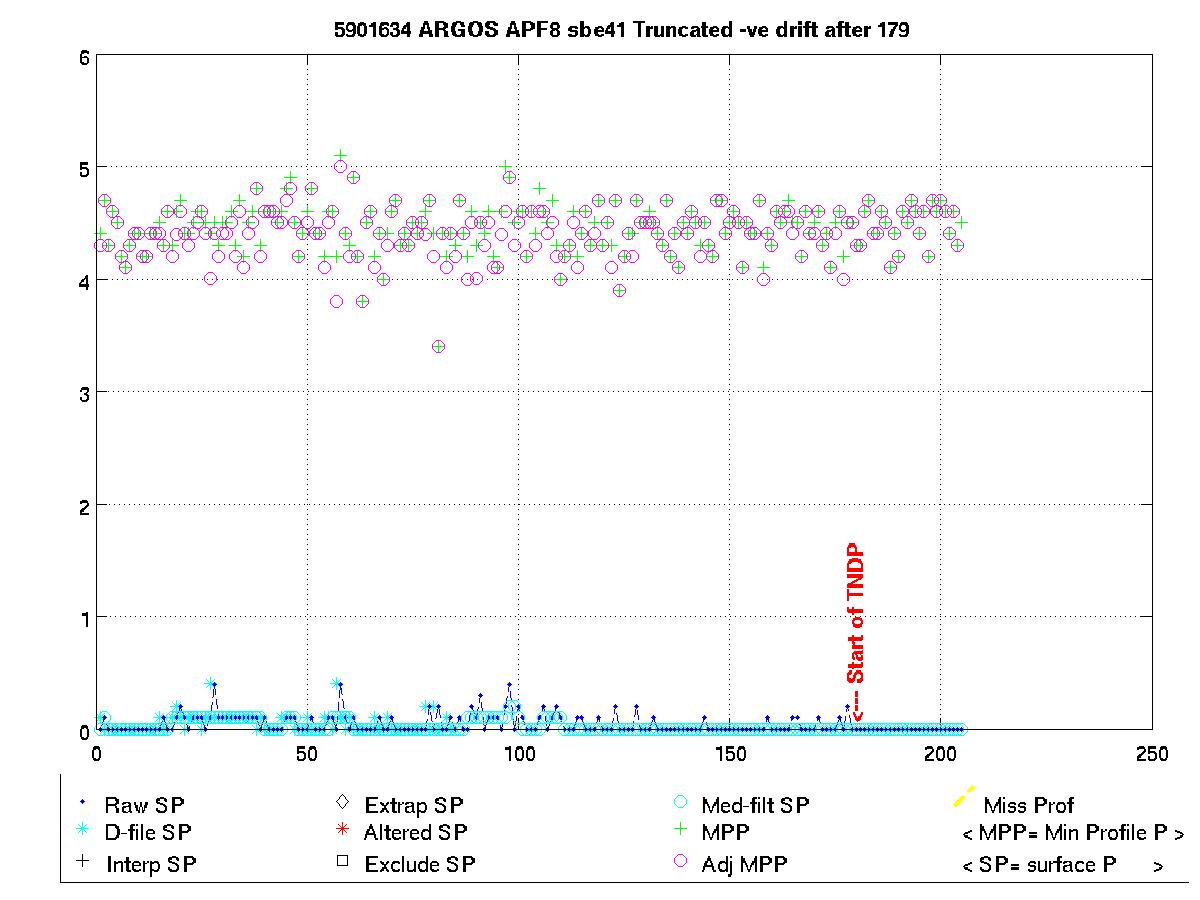
The surface pressure for this float is shown in the plot below.
Potential Temperature-Salinity (a), Location (b, Max Temperature (c) and Sea Surface Salinity (d) plots located below.
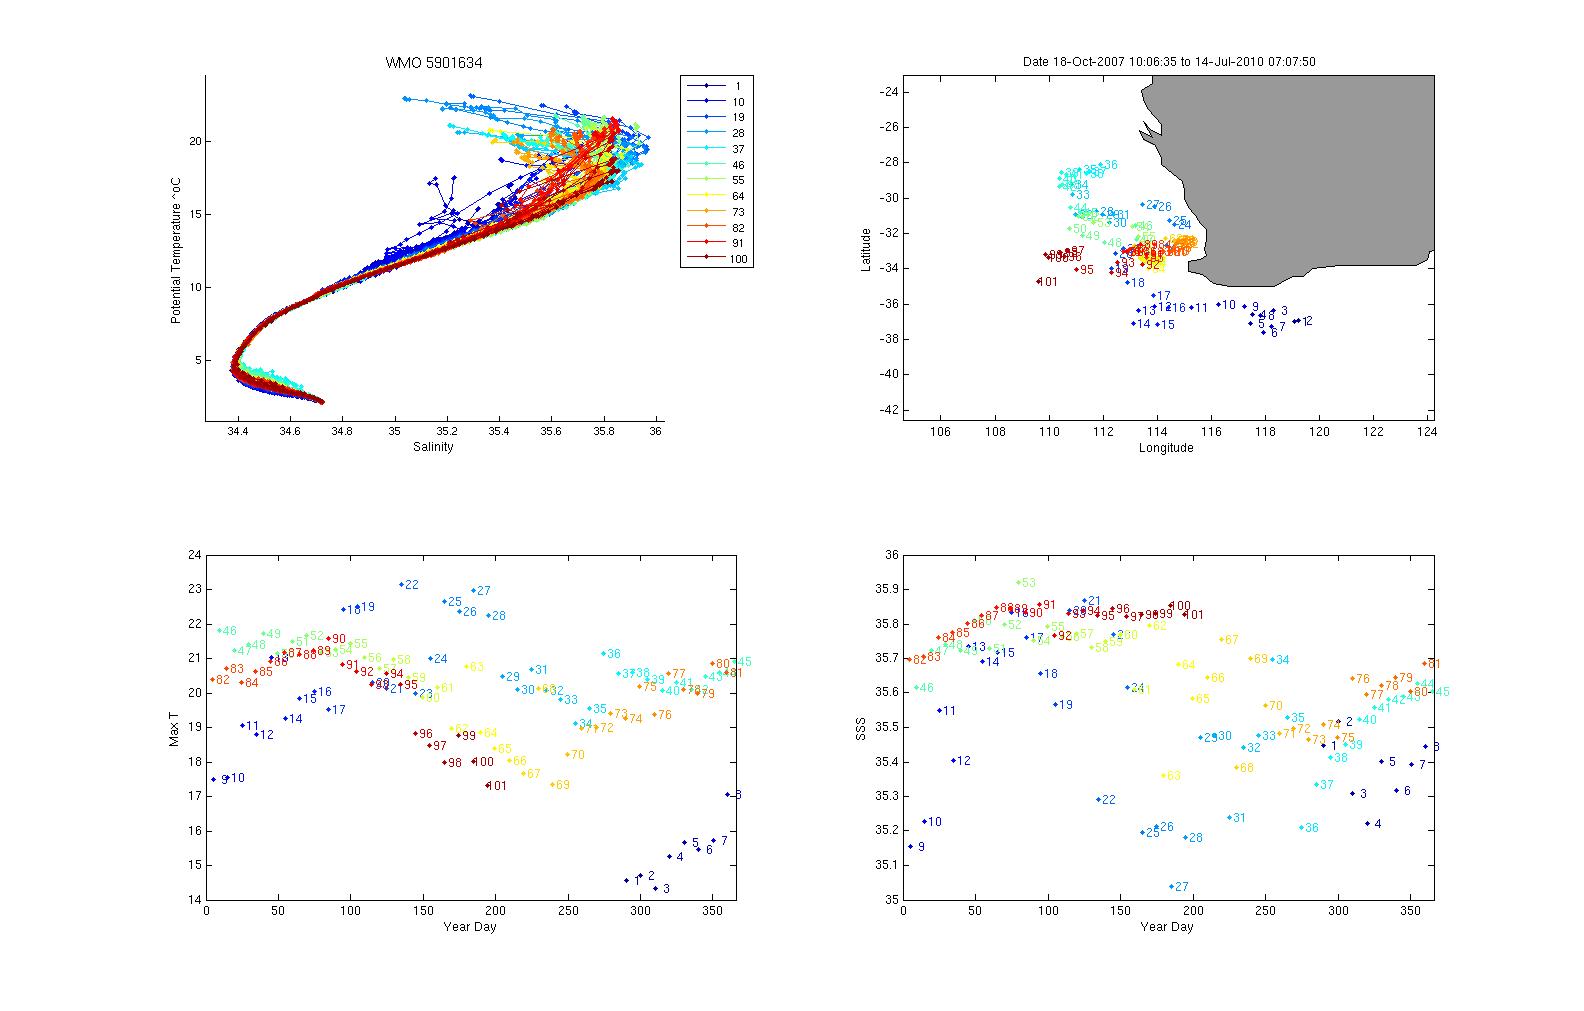
Surface temperatures generally varied between xx and xx şC and surface salinities from xx to xx.
The plot below shows the potential-temperature/salinity relationship for the deepest theta levels where the relationship between the two parameters should show the least variation.
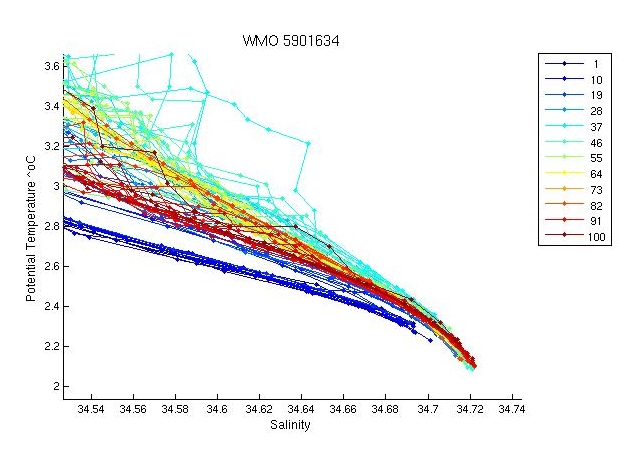
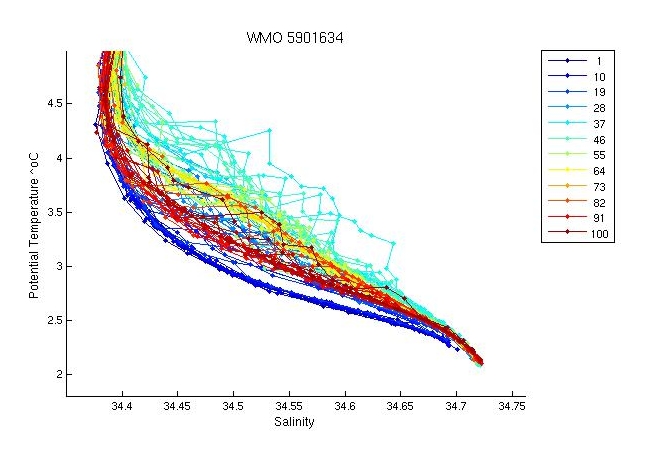
There is a huge spread in the profiles. The earlier profiles are significantly fresher at depth than later profiles but this looks fine given the path of the float.
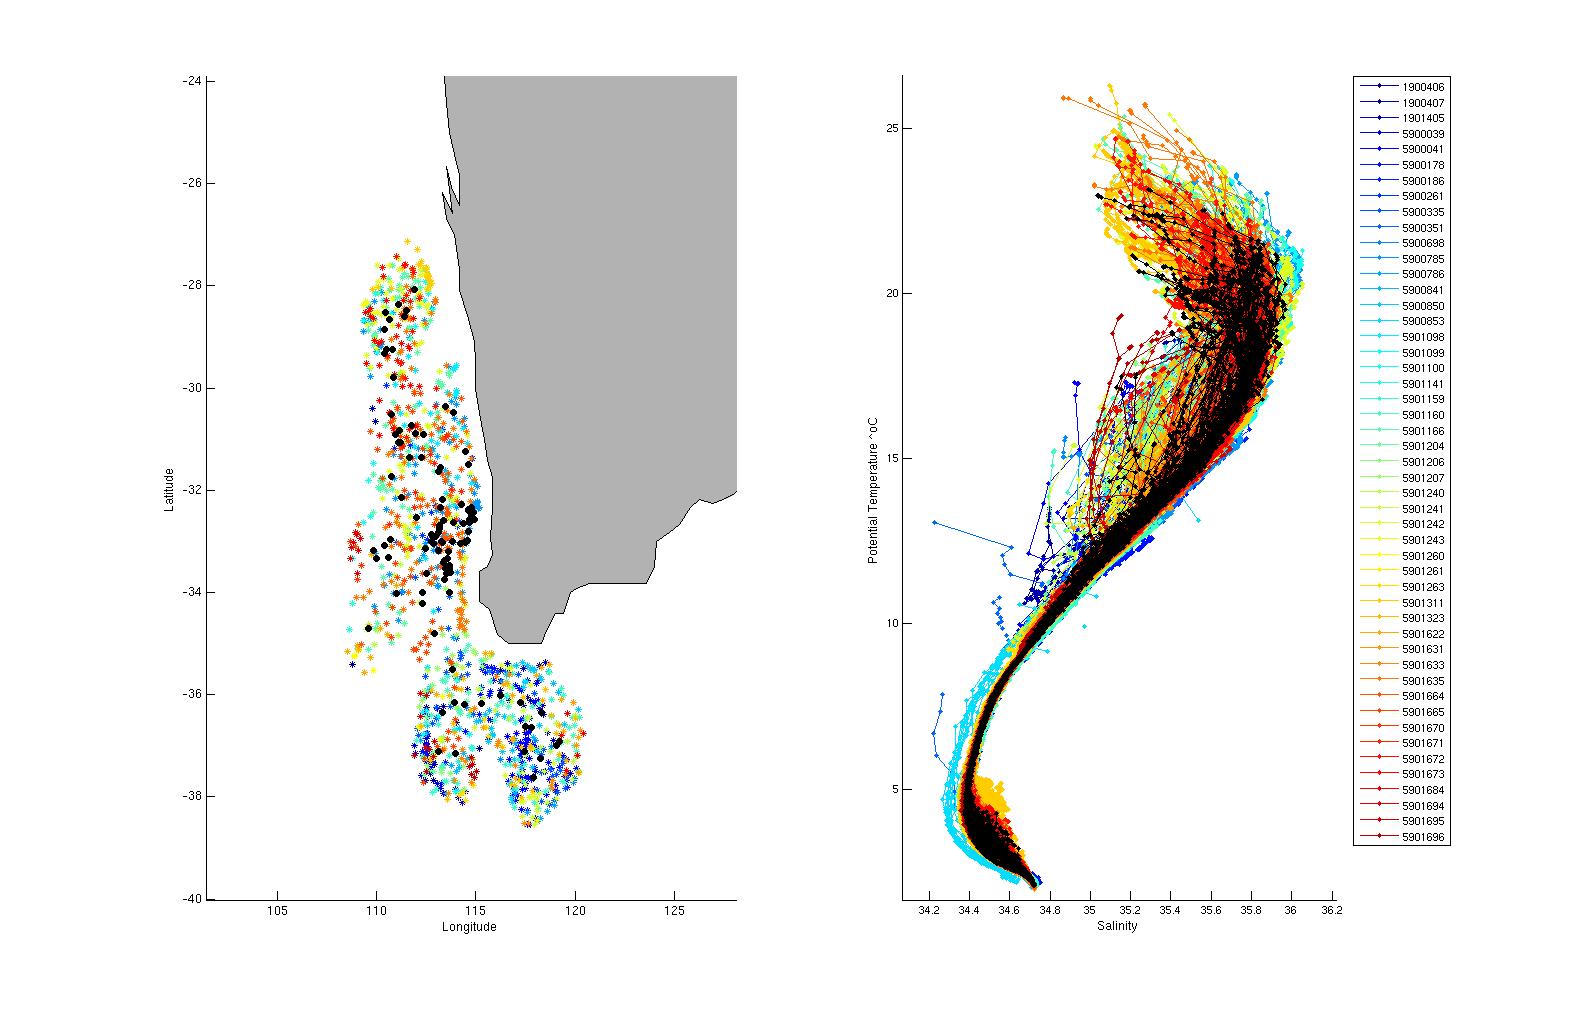
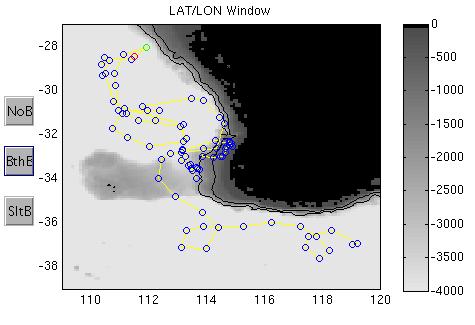
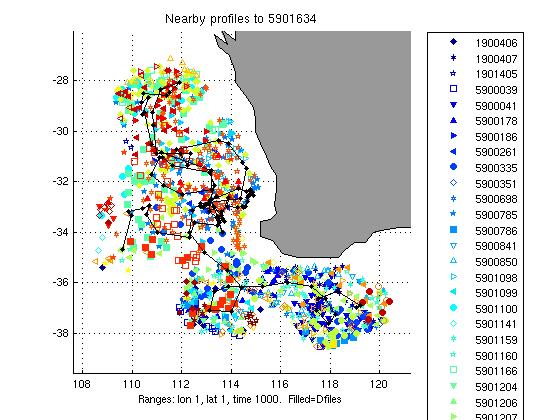
The two plots below show a). the location of this float (black circles) in relation to the position of other nearby argo floats (coloured circles) and b). The potential-temperature/salinity curve for this float (in black) compared to nearby argo floats (coloured).
The potential-temperature/salinity relation for the deepest theta levels for this float (in black) and nearby argo floats (coloured) is displayed below.
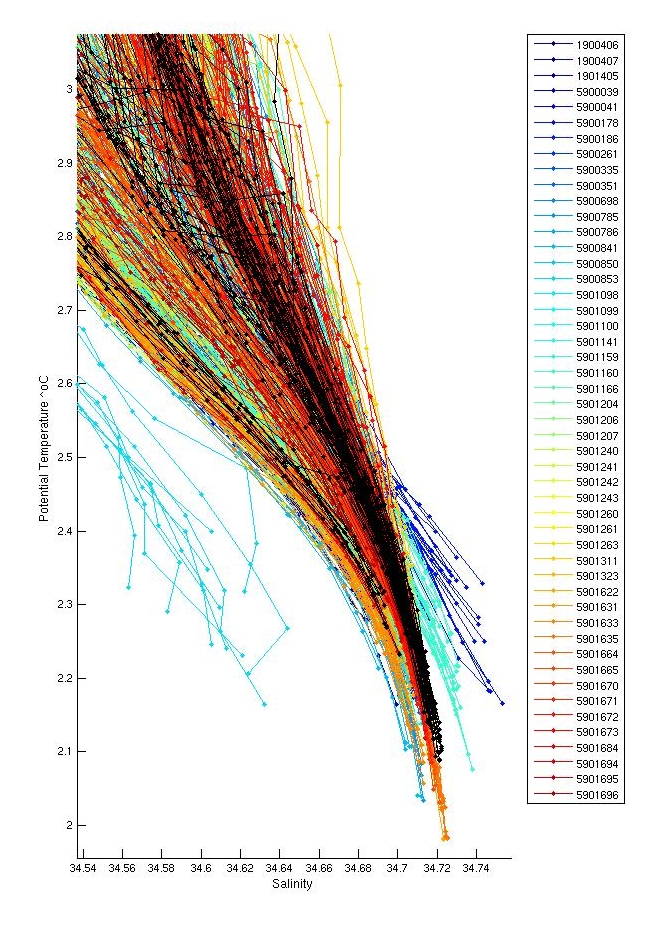
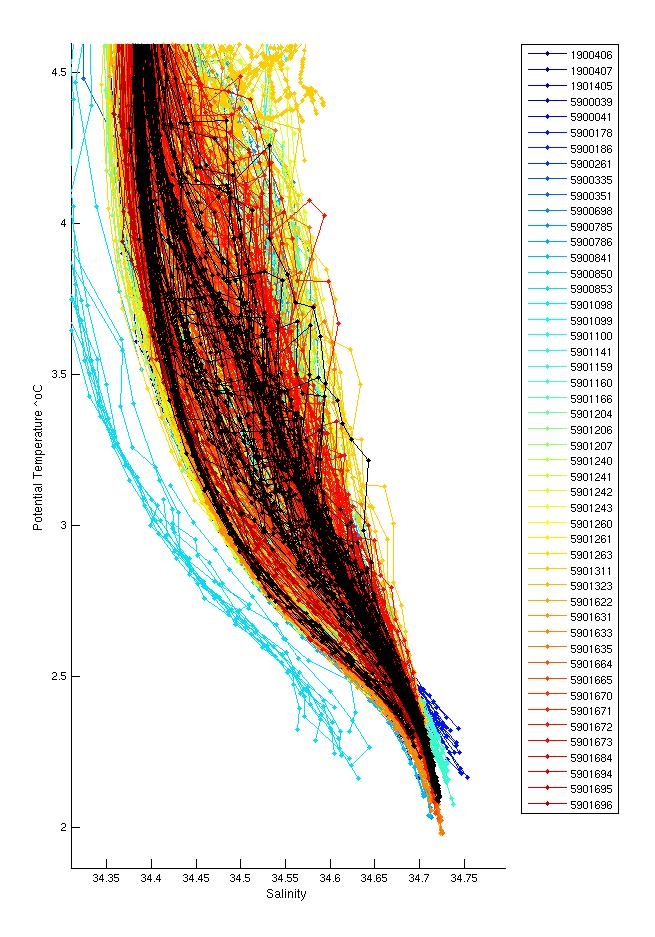
High variability in the TS curve is reflected in neighbouring floats also and given the huge distance this float has travelled is reasonable.
There were no inversions.
Salt hooks were located in profiles; 2,4,6,8,10,12,17,20,22,24,27,29,30,32,34,36,41,43,45,47,48,50,53,54,59,63,65,67,83,84. These were flagged as QC 4 for both T & S.
There were no missing profiles. The float grounded on multiple profiles, some suspicious bottom values were flagged as QC=4 for both T & S.
The plot below shows the analysis of salinity drift using the WJO/OW software.

The four plots below show the salinity anomalies on theta surfaces compared to (a) the Gouretski and Kolterman climatology, (b) the CARS (CSIRO Atlas of Regional Seas)/WOA (World Ocean Atlas) climatology, (c) the anomalies within the float series itself, (i.e. the salinity anomaly of each profile from the mean profile average for the float and (d) the raw float salinity compared to the CARS and G&K climatological salinity on a theta surface of 2.4 degrees C.
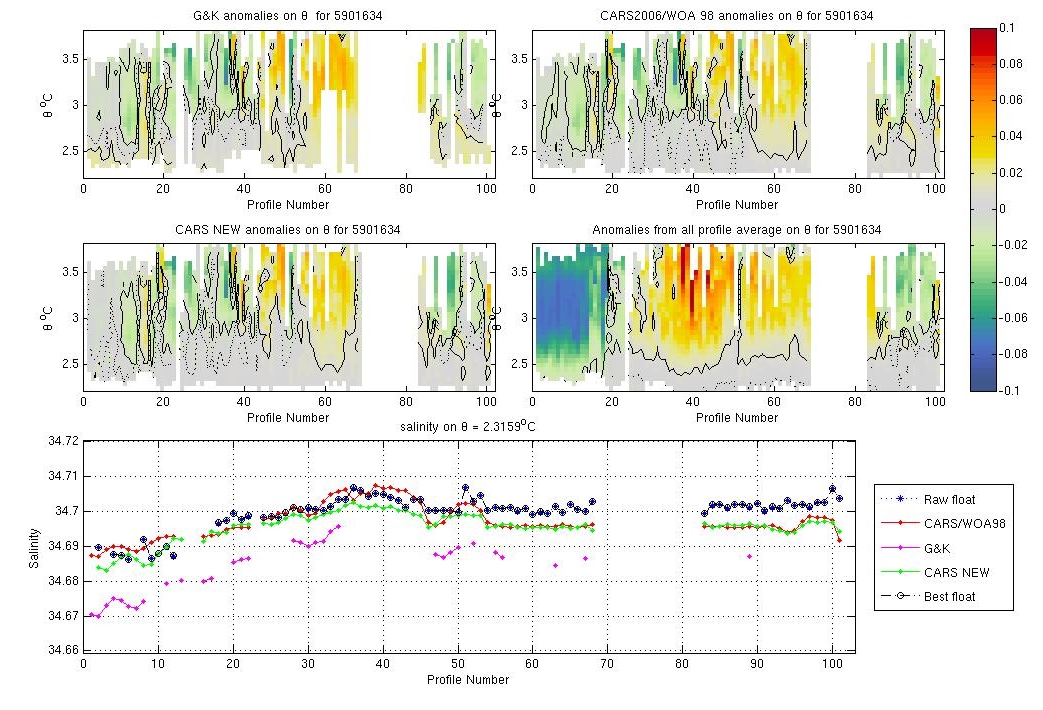
This float is extremely close to climatologies.
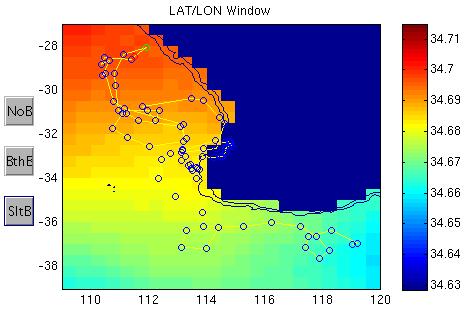
The plots below show the raw float salinity data (solid blue line) compared to neighbouring argo floats (coloured symbols) on a potential temperature surface of 2.6 degrees C. The locality map shows the location of the profiles for this float and for neighbouring floats.
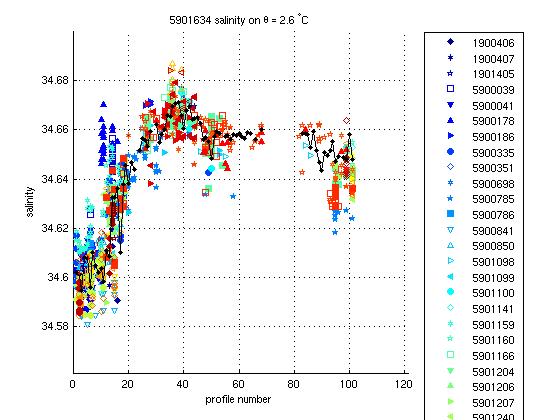
There is a high degree of salinity variability on deep theta surfaces. This float is right in the middle of the data envelope and looks reasonable.
This float required no salinity drift correction.
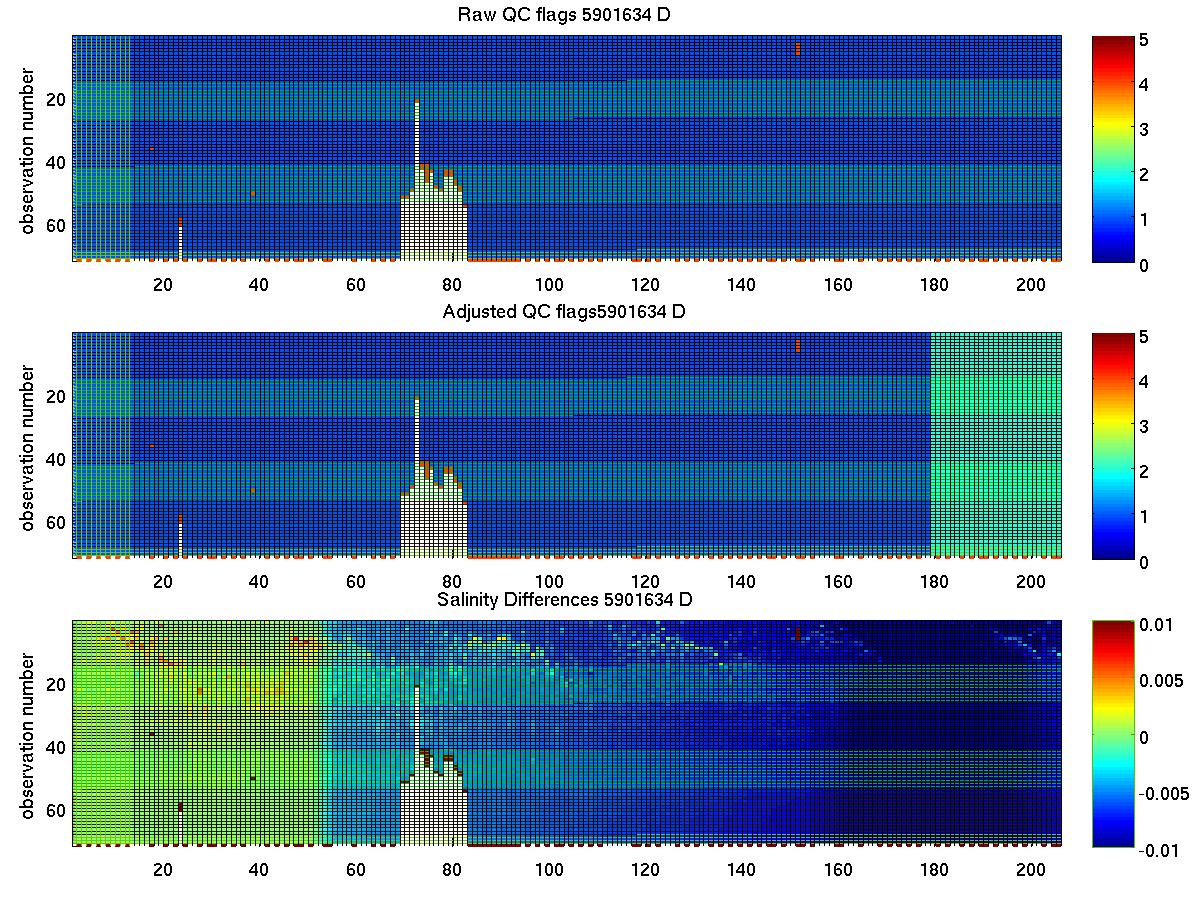
The plot below summarises the QC flags and salinity differences for the raw and adjusted salinity fields in the final delayed mode files submitted to the GDAC.
Created 29-07-2010