The table below provides basic information about the float, including primary sensors, mission parameters and current status of profiles.
| Institute | CSIRO |
| Principal Investigator | Susan Wijffels |
| Pressure Sensor | Druck (serial number=10269) |
| CTD Sensor | APEX-SBE-41 (serial number=3009) |
| CTD Sampling Mode | Burst Sampler |
| Controller Board | APF 8 |
| Additional Sensors/Software | Compressee |
| Park Depth | 1000 m |
| Profile Depth | 2000 m |
| Launch Date | 31-08-2007 |
| Number of D-moded Profiles | 89 |
| Calibration Date | 30-07-2010 |
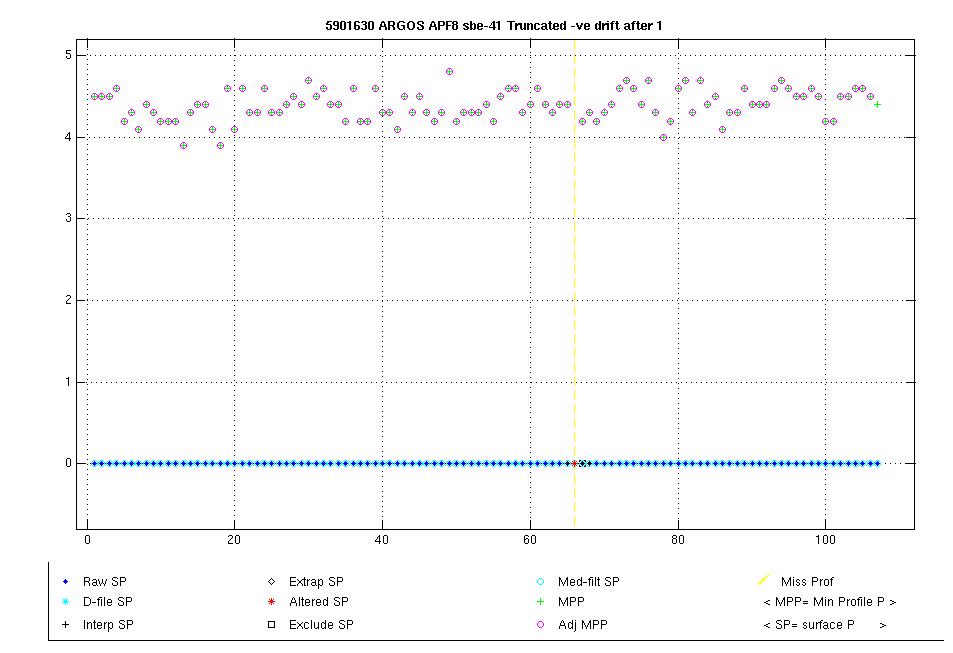
| Pressure Drift | Surface Pressure Offset unknown and uncorrectable from profile 1 onwards, TNDP float, no anomalous TS data, QC=2, serial number < 2324175 |
| Salinity Drift | No salinity drift detected |
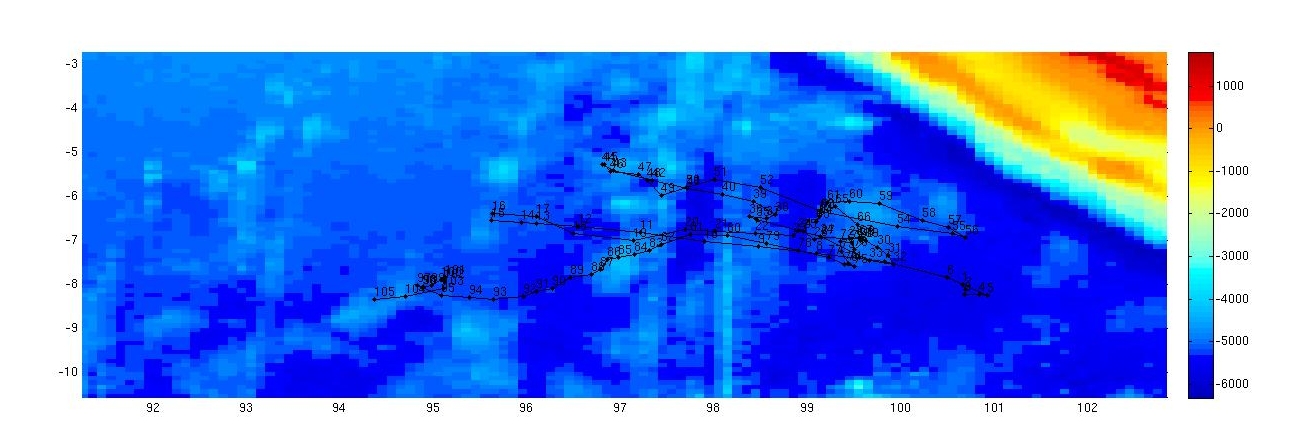
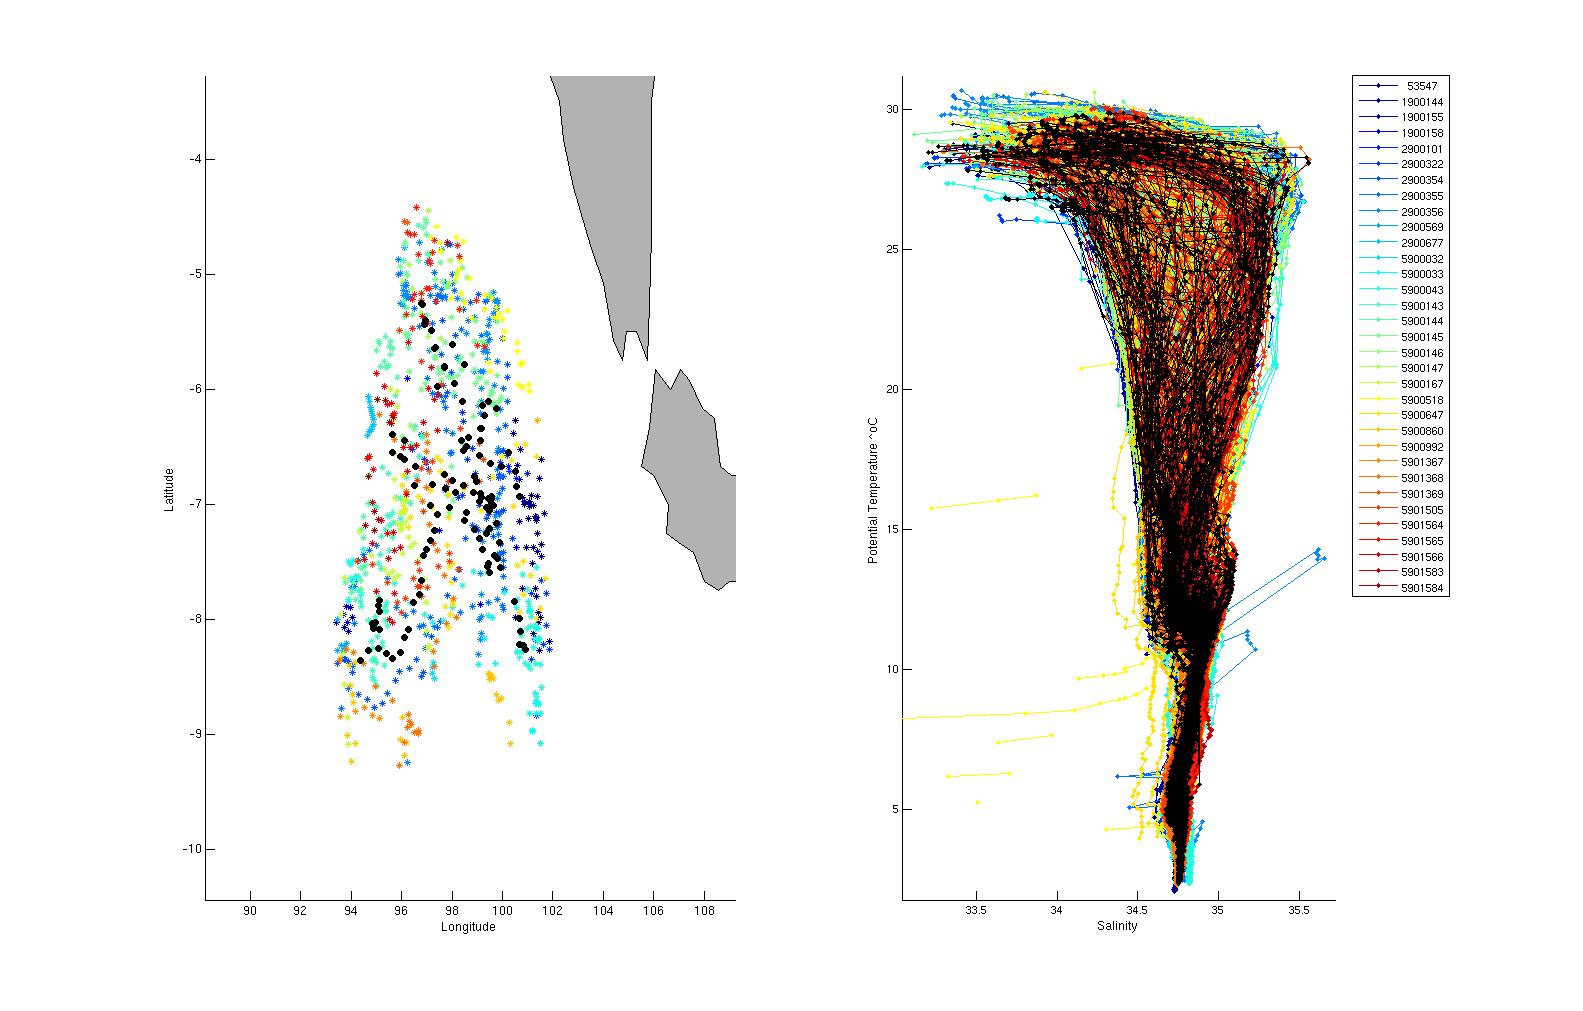
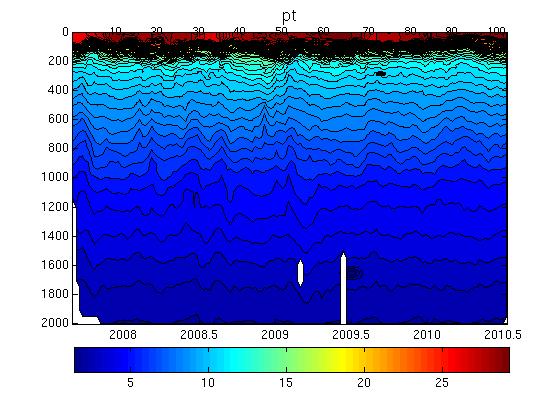
This float was located in the northern Indian Ocean, south of Sumatra and west of Java, Indonesia, in a region bounded by 95 to 101 şE and 5 to 9 ş S.
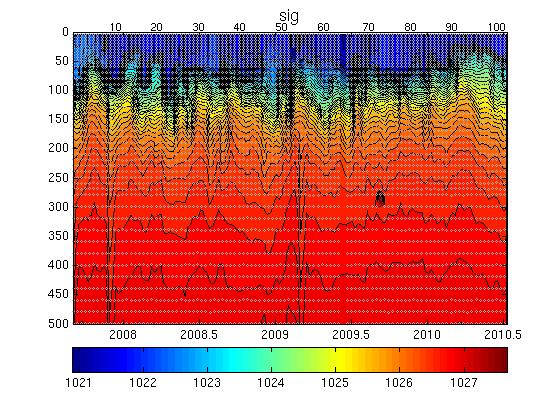
The surface pressure for this float is shown in the plot below.
Potential Temperature-Salinity (a), Location (b, Max Temperature (c) and Sea Surface Salinity (d) plots located below.
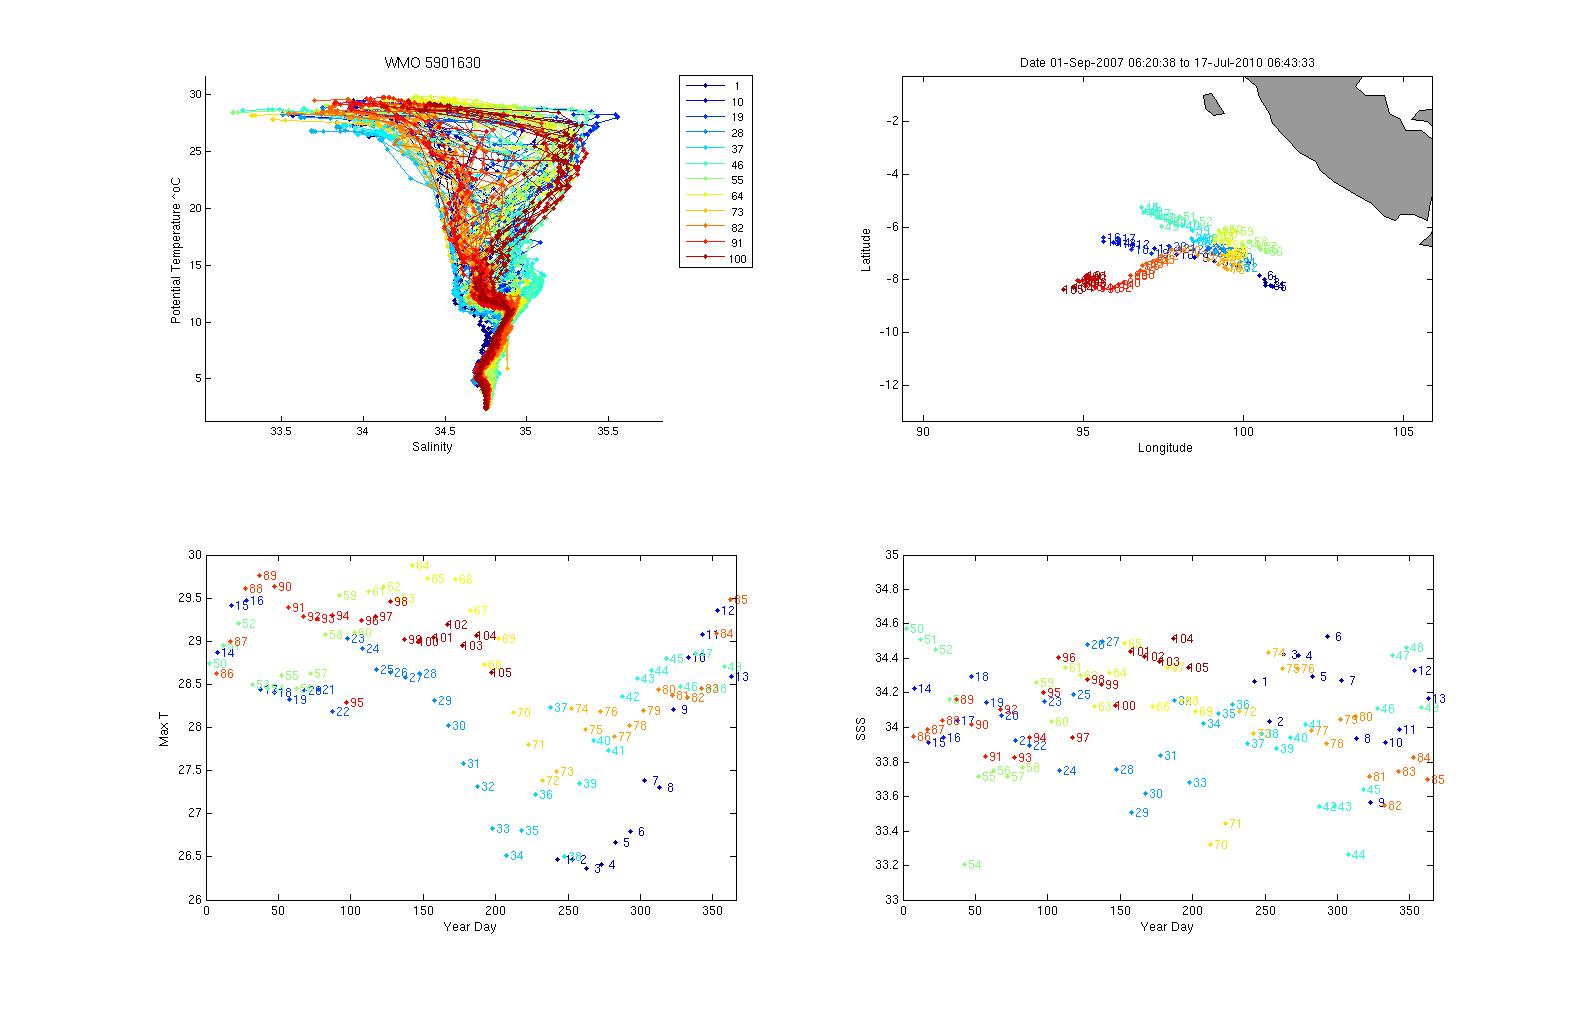
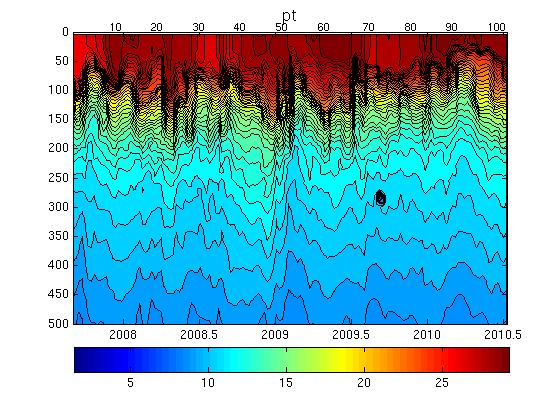
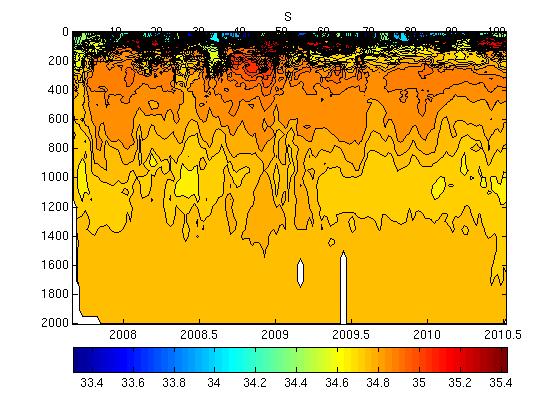
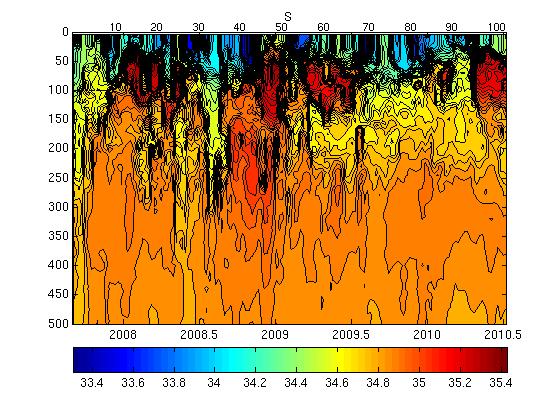
Surface temperatures generally varied between 26.5 and 29.5 şC and surface salinities from 33.2 to 34.6.
The plot below shows the potential-temperature/salinity relationship for the deepest theta levels where the relationship between the two parameters should show the least variation.
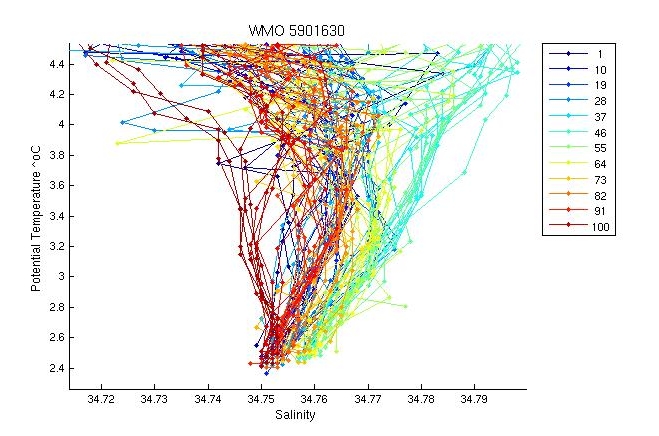
There is very large variability in the TS curve in this region with later profiles significantly more salty at depth. Generally the profiles look fine. There is a low salinity spike in one of the early profiles at depth at about 8 degrees that looks ood. Check.
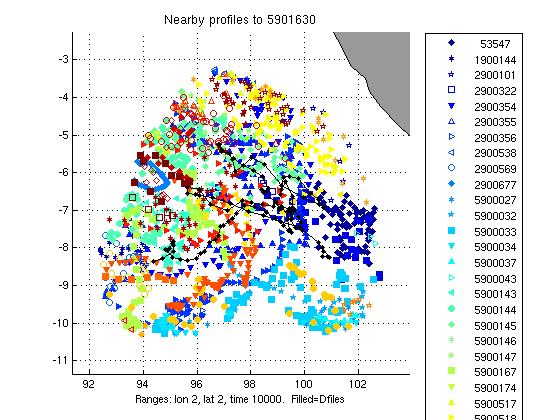
The two plots below show a). the location of this float (black circles) in relation to the position of other nearby argo floats (coloured circles) and b). The potential-temperature/salinity curve for this float (in black) compared to nearby argo floats (coloured).
The potential-temperature/salinity relation for the deepest theta levels for this float (in black) and nearby argo floats (coloured) is displayed below.
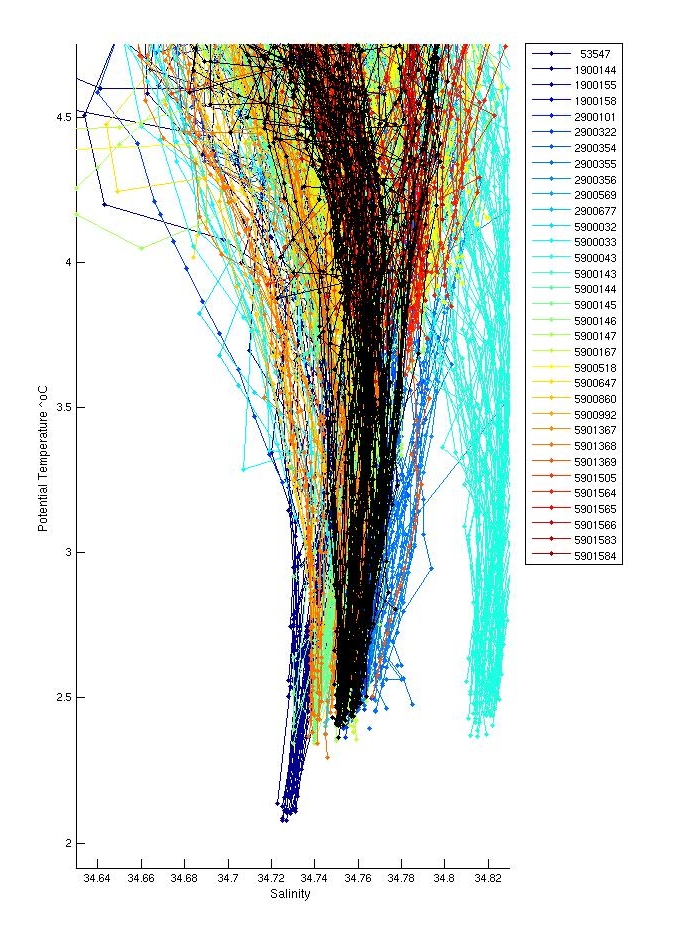
Compared to neighbouring floats this float looks similar.
There were inversions in profiles; 75,76. These were both significant and were flagged as QC=4.
Salt hooks were located in profiles; 5,9,11,13,18,19,22,26,28,32,34,36,38,40,42,44,46,48,51,53,55,57,58,61,62,67,68,70,72,74,76,80,82,84,86,88. These were flagged as QC 4 for both T & S.
The float did not ground anywhere and there were no profiles missing. The low salinity and low temperature spike in profile 4 between 400 and 500m depth was flagged as QC=4 as this was not seen in any other profiles from this float or neighbouring floats and was most probably gunk caught briefly in the cell. The last values of profiles 1, 2, 10 and 32 were flagged as QC=4 as these looked strange. The large thermal lag spike in pf 17 was also flagged as QC=4.

The plot below shows the analysis of salinity drift using the WJO/OW software.

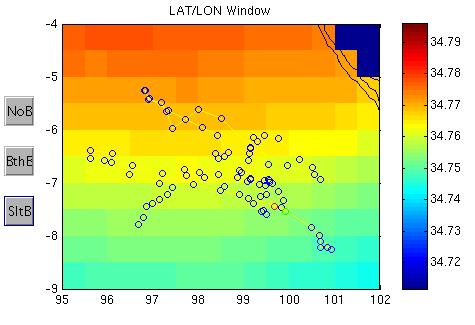
The four plots below show the salinity anomalies on theta surfaces compared to (a) the Gouretski and Kolterman climatology, (b) the CARS (CSIRO Atlas of Regional Seas)/WOA (World Ocean Atlas) climatology, (c) the anomalies within the float series itself, (i.e. the salinity anomaly of each profile from the mean profile average for the float and (d) the raw float salinity compared to the CARS and G&K climatological salinity on a theta surface of 0.xx degrees C.
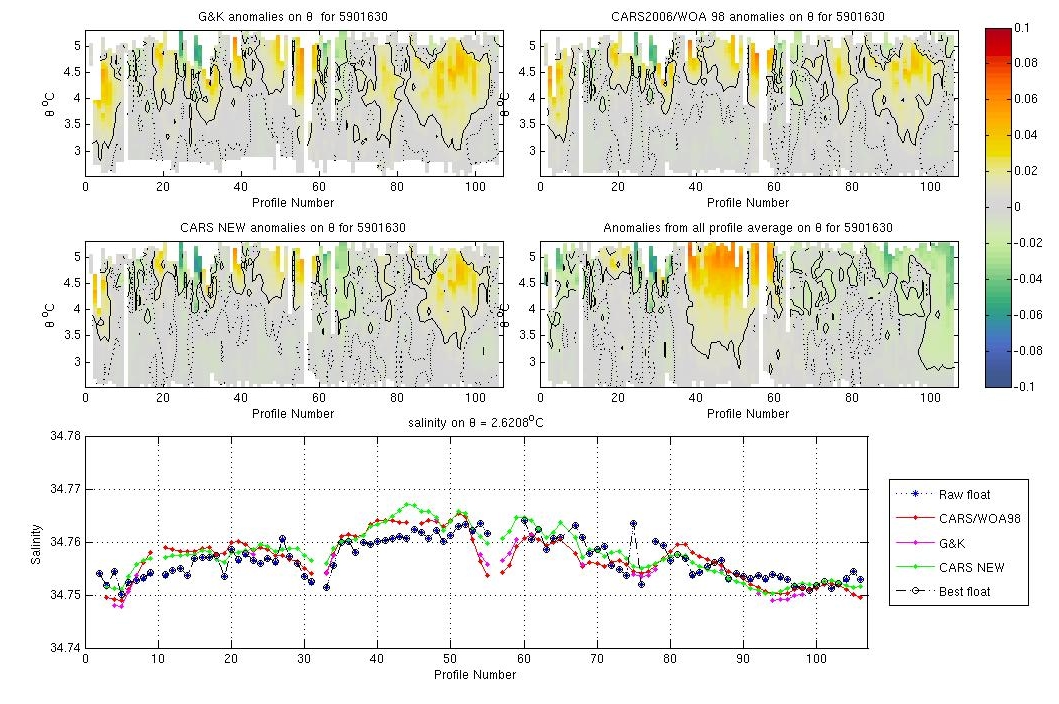
This float was very close to climatologies.
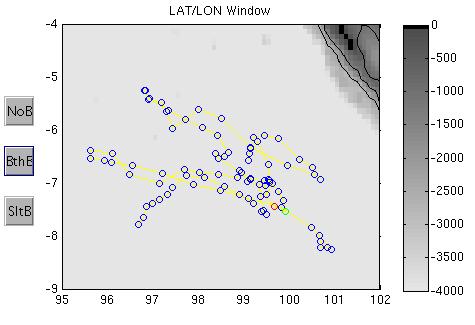
The plots below show the raw float salinity data (solid blue line) compared to neighbouring argo floats (coloured symbols) on a potential temperature surface of xx degrees C. The locality map shows the location of the profiles for this float and for neighbouring floats.
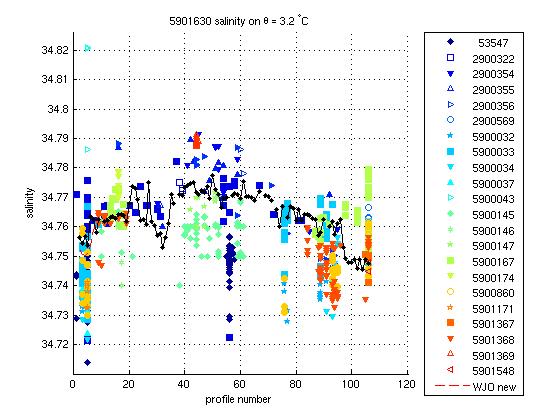
Data highly variable in this region but float looks okay.
This float required no salinity drift correction.
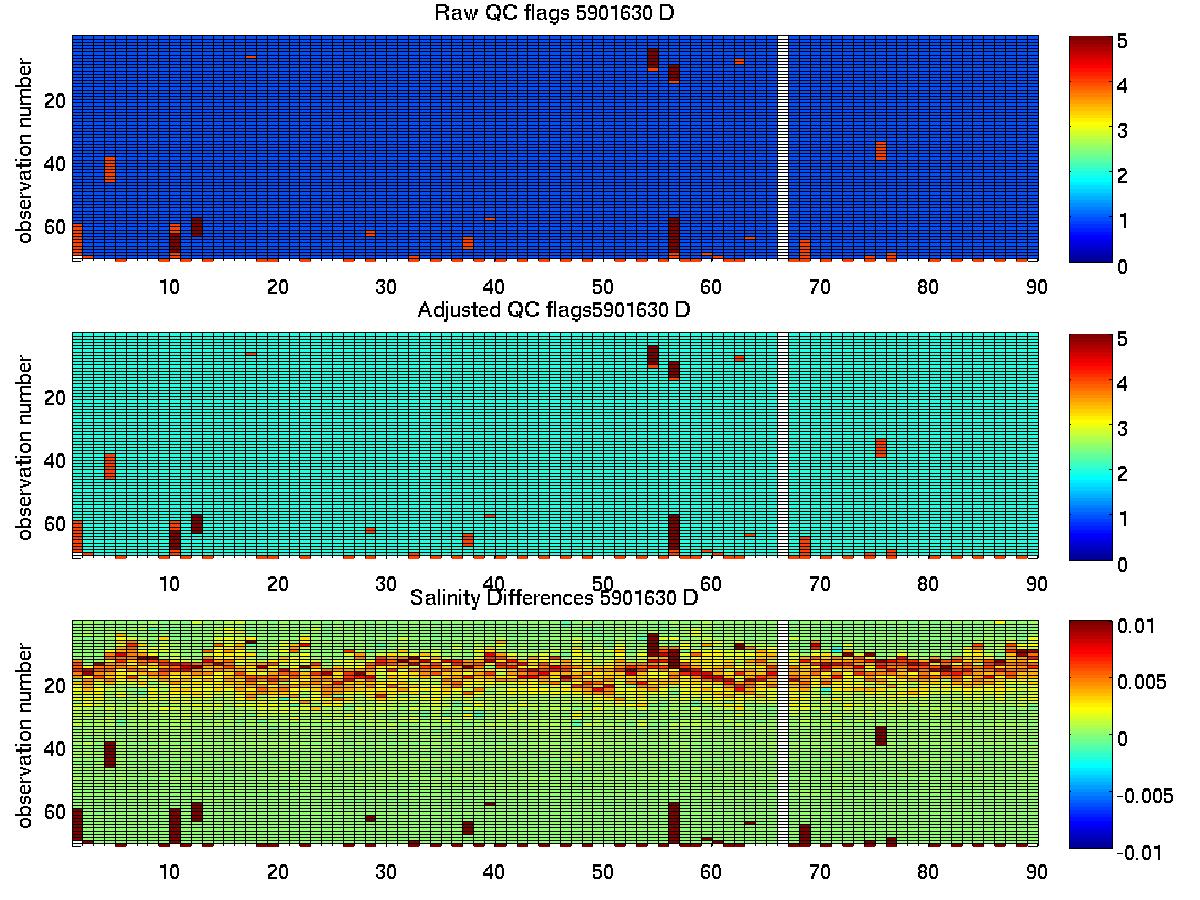
The plot below summarises the QC flags and salinity differences for the raw and adjusted salinity fields in the final delayed mode files submitted to the GDAC.
Created 30-07-2010