The table below provides basic information about the float, including primary sensors, mission parameters and current status of profiles.
| Institute | CSIRO |
| Principal Investigator | Susan Wijffels |
| Pressure Sensor | Druck (serial number=10268) |
| CTD Sensor | APEX-SBE-41 (serial number=3008) |
| CTD Sampling Mode | Burst Sampler |
| Controller Board | APF 8 |
| Additional Sensors/Software | None |
| Park Depth | 1000 m |
| Profile Depth | 2000 m |
| Launch Date | 30-08-2007 |
| Number of D-moded Profiles | 89 |
| Calibration Date | 30-07-2010 |
| Pressure Drift | Surface Pressure Offset unknown and uncorrectable from profile 1 onwards, TNDP float, no anomalous TS data, QC=2, serial number < 2324175 |
| Salinity Drift | No salinity drift detected |
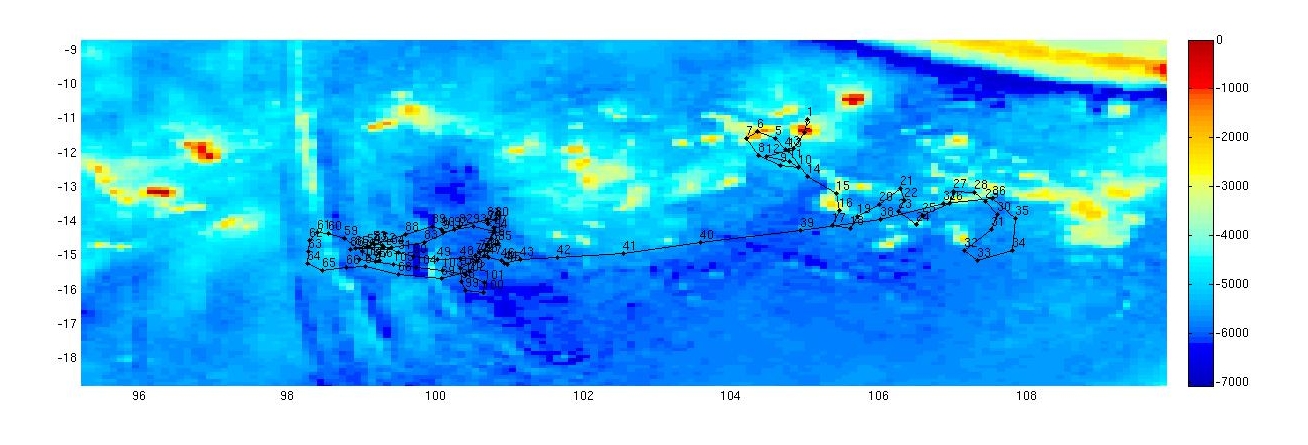
This float was located in the Indian Ocean between Indonesia and WA., in a region bounded by 99 to 108 şE and 10 to 16 ş S.
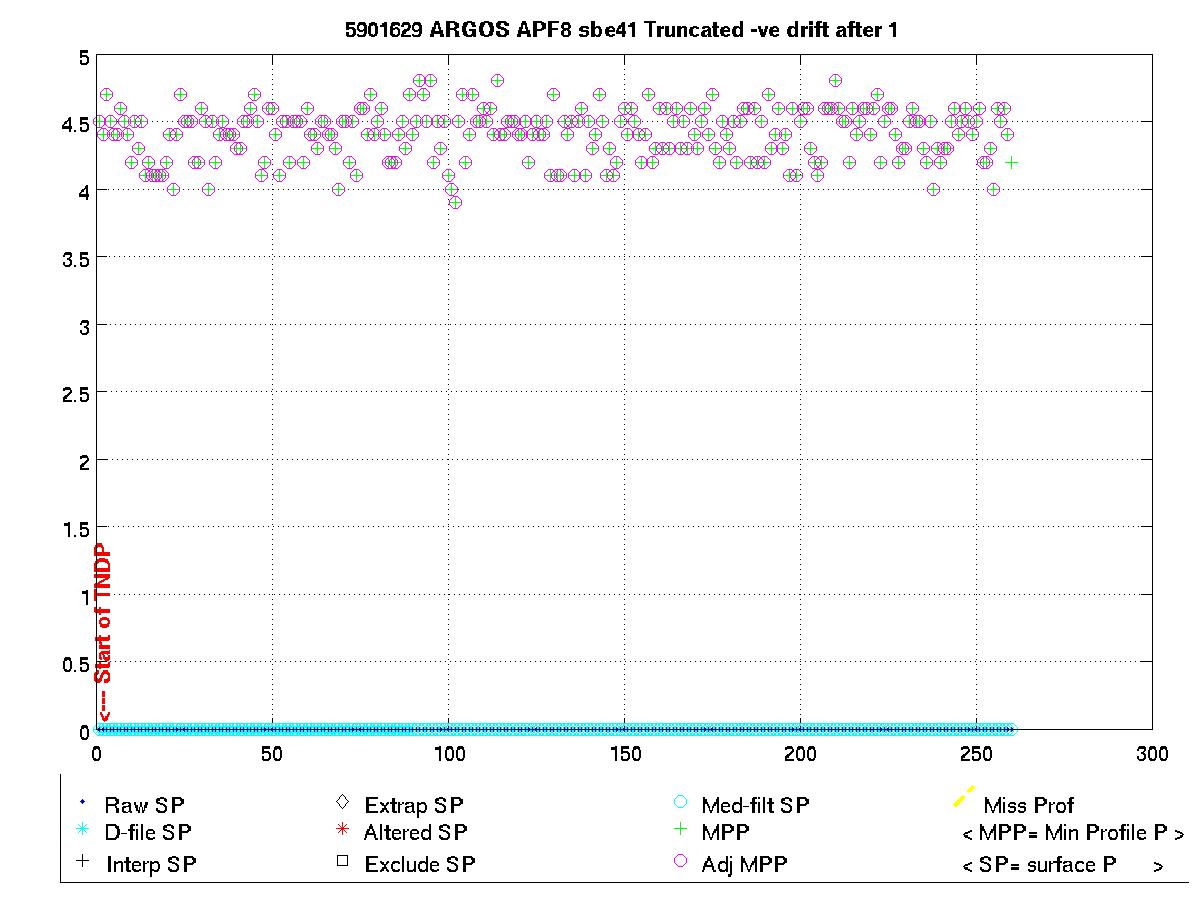
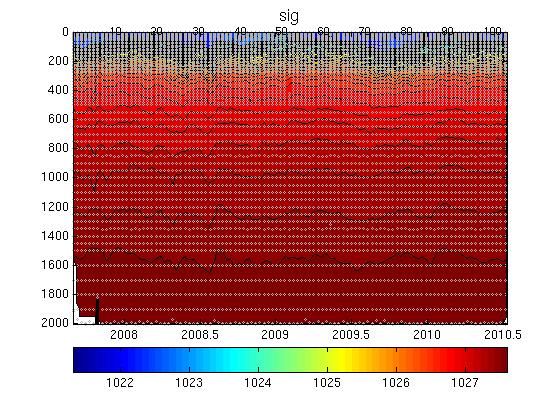
The surface pressure for this float is shown in the plot below.
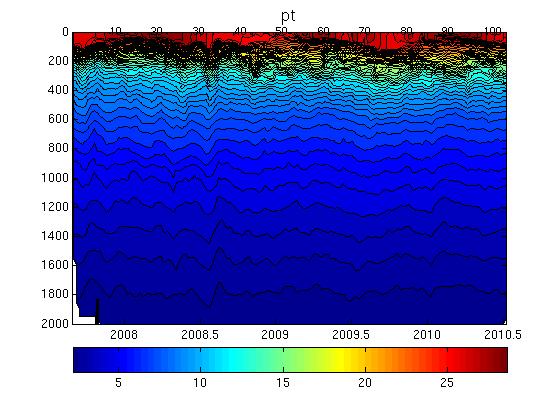
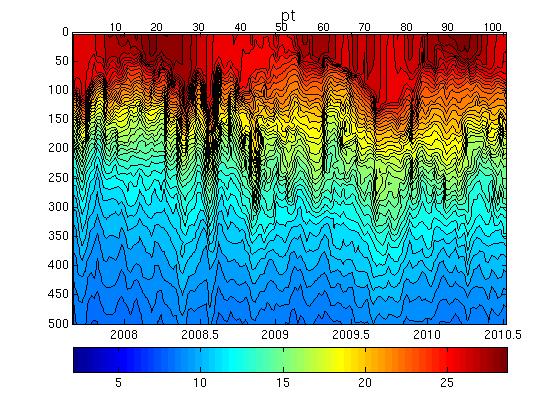
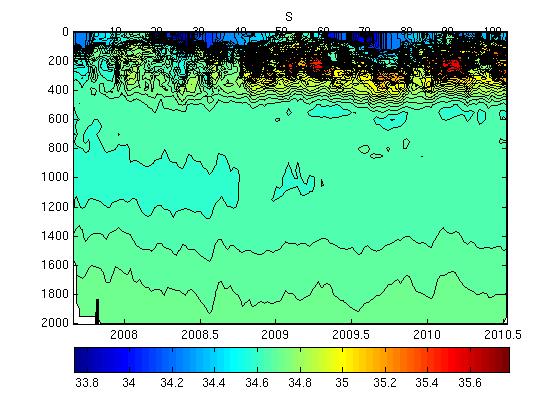
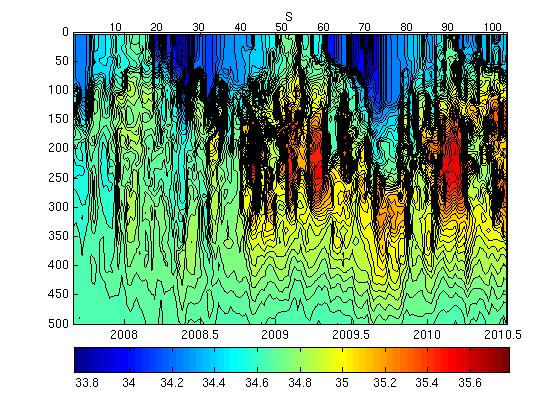
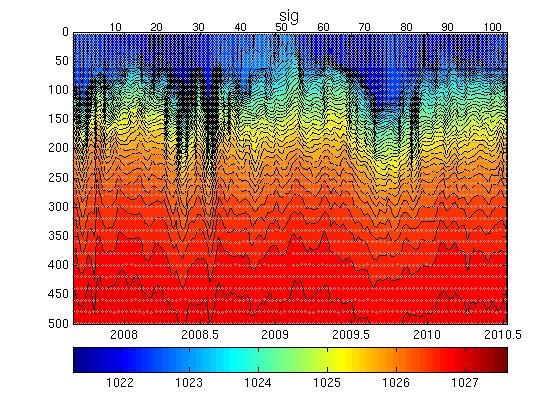
Potential Temperature-Salinity (a), Location (b, Max Temperature (c) and Sea Surface Salinity (d) plots located below.
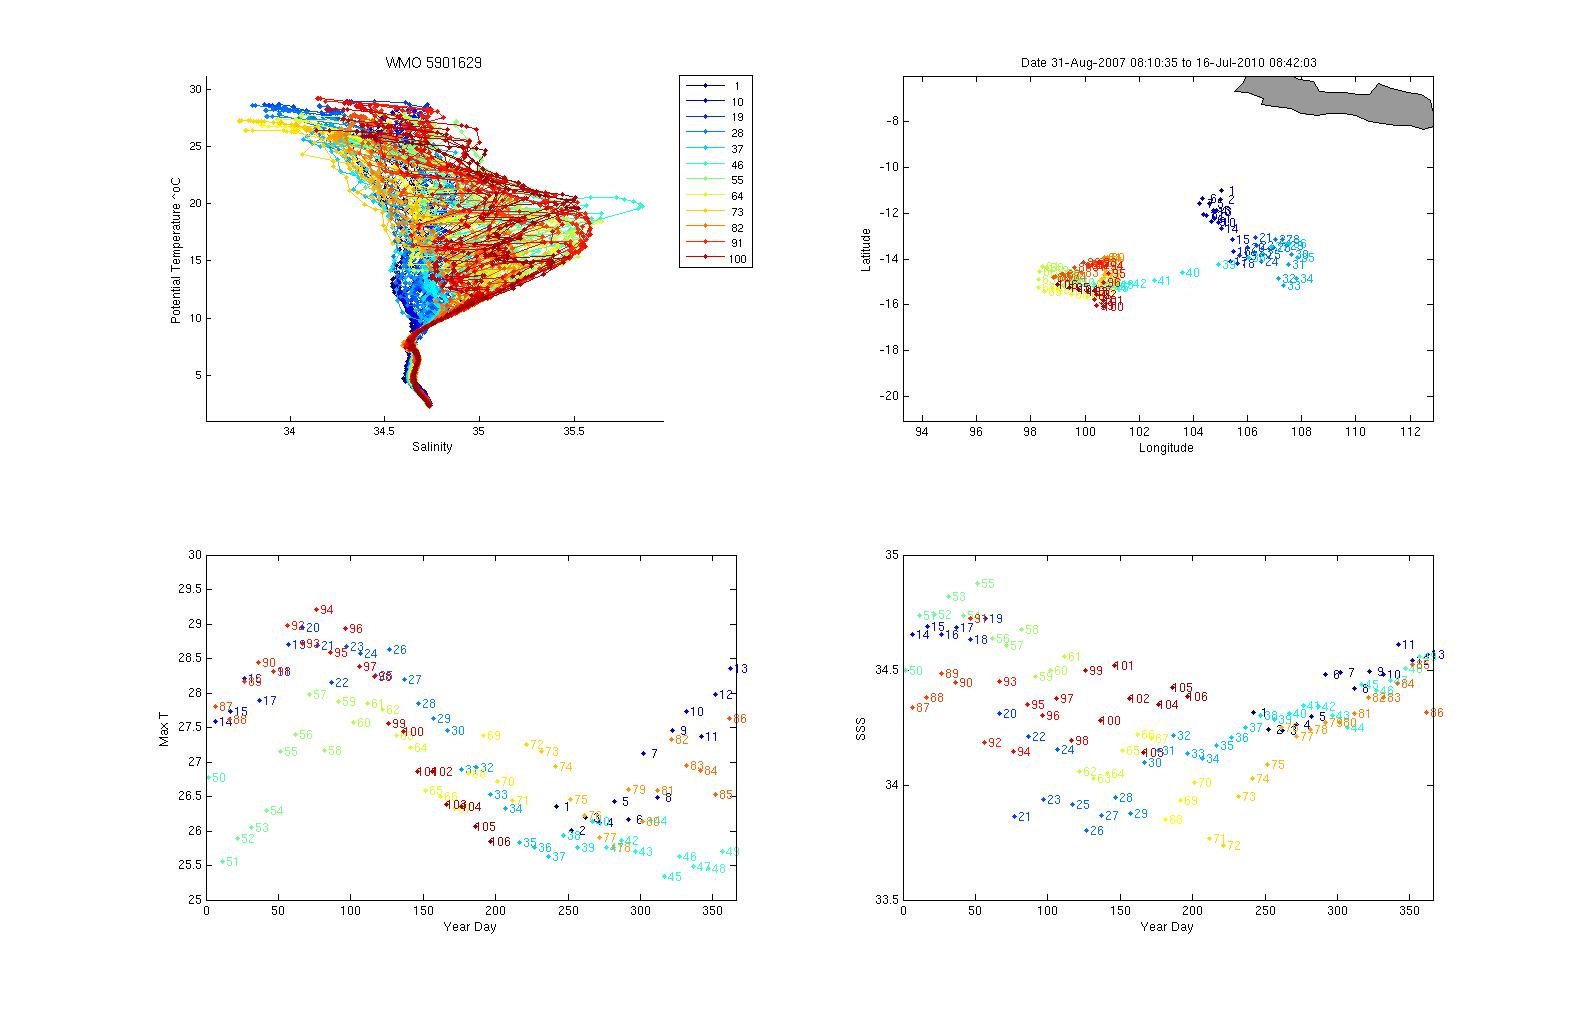
Surface temperatures generally varied between 25 and 29 şC and surface salinities from 33.8 to 34.8.
The plot below shows the potential-temperature/salinity relationship for the deepest theta levels where the relationship between the two parameters should show the least variation.
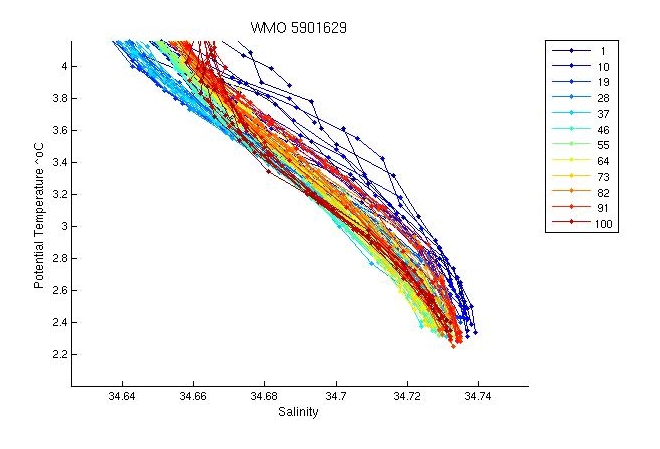
There is a spread of 0.02 psu in salinity in the deeper layers. Given the variability in water masses in this region this is reasonable. There is a salinity gradient in the region of high salinities in the northwest to lower salinities in the south east. The deep profiles look fine except for the bottom two values of profile 1.
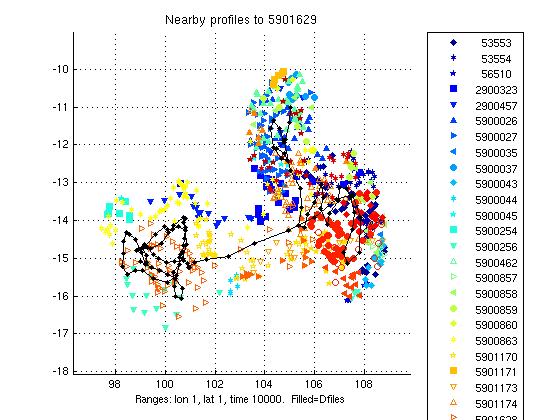
The two plots below show a). the location of this float (black circles) in relation to the position of other nearby argo floats (coloured circles) and b). The potential-temperature/salinity curve for this float (in black) compared to nearby argo floats (coloured).
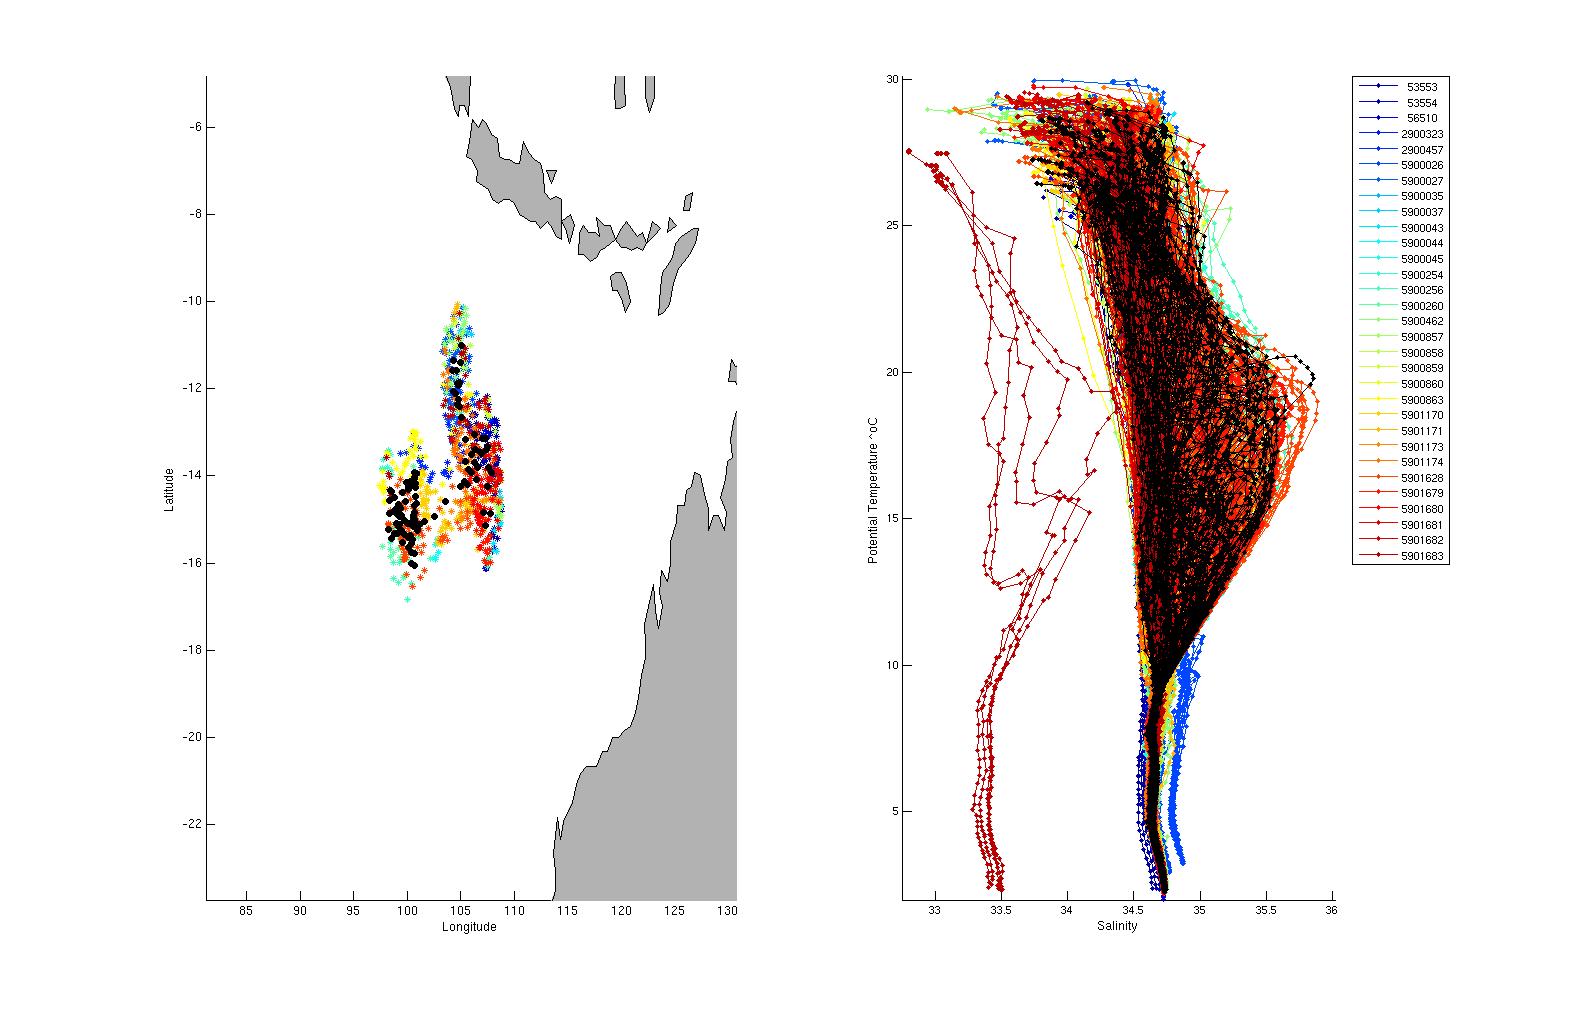
The potential-temperature/salinity relation for the deepest theta levels for this float (in black) and nearby argo floats (coloured) is displayed below.
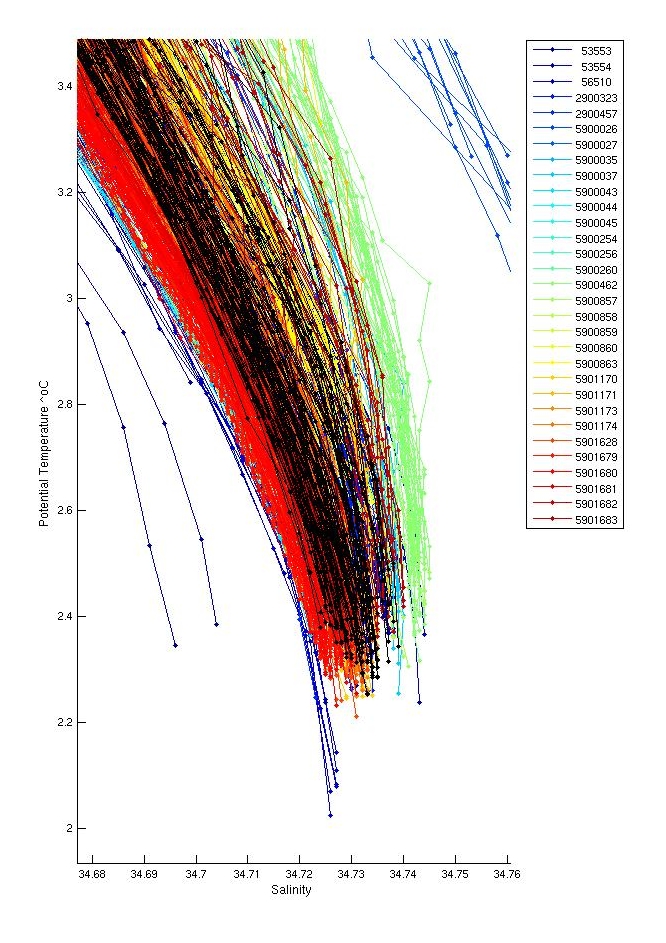
Even though there is such a large spread in the data at depth, this float is in the middle of the salinity envelope. The earlier profiles (1 to 15) are located more to the north and are significantly more salty than the later profiles (see plot of float trajectory over climatological salinity).
There were no inversions.
Salt hooks were located in profiles; 4,6,8,10,14,16,18,20,23,24,27,29,31,33,34,37,39,41,43,45,47,51,53,55,61,64,65,67,69,71,75,78,82,84,85,88. These were flagged as QC 4 for both T & S.
The last few values of profiles 1, 5, 6, 7 and 13 were flagged as QC4 for both T & S as these looked strange. A spike in T & S in profile 3 at 1450 m was flagged as QC=4 and a spike in profile 28, as was a deep spike in profile 10 at 1500 m depth.
The plot below shows the analysis of salinity drift using the WJO/OW software.

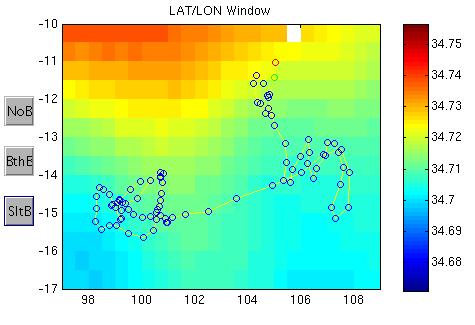
The four plots below show the salinity anomalies on theta surfaces compared to (a) the Gouretski and Kolterman climatology, (b) the CARS (CSIRO Atlas of Regional Seas)/WOA (World Ocean Atlas) climatology, (c) the anomalies within the float series itself, (i.e. the salinity anomaly of each profile from the mean profile average for the float and (d) the raw float salinity compared to the CARS and G&K climatological salinity on a theta surface of 0.xx degrees C.
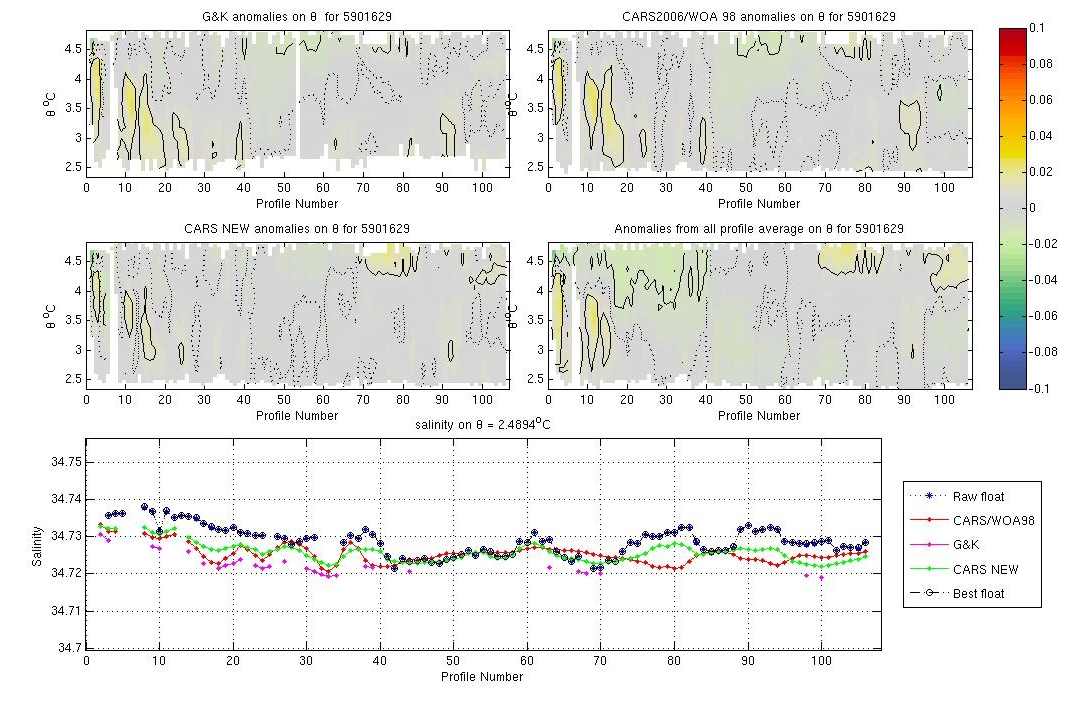
This float is very close to climatologies.
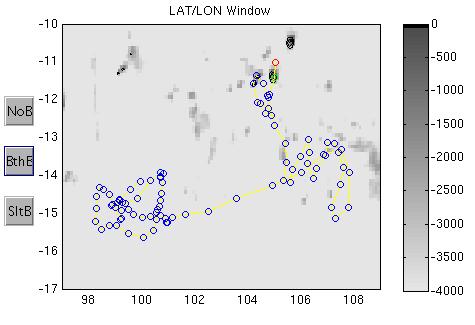
The plots below show the raw float salinity data (solid blue line) compared to neighbouring argo floats (coloured symbols) on a potential temperature surface of xx degrees C. The locality map shows the location of the profiles for this float and for neighbouring floats.
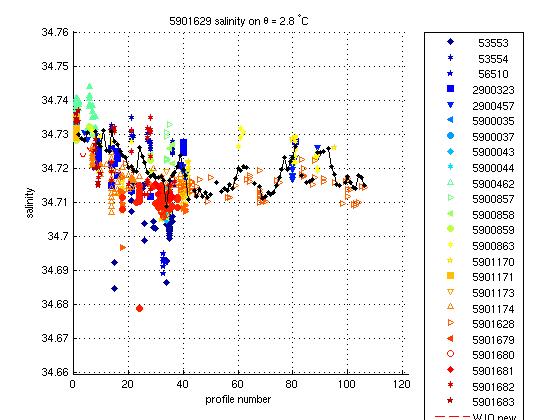
The float is in the middle of the nearby argo envelope.
This float required no salinity drift correction.
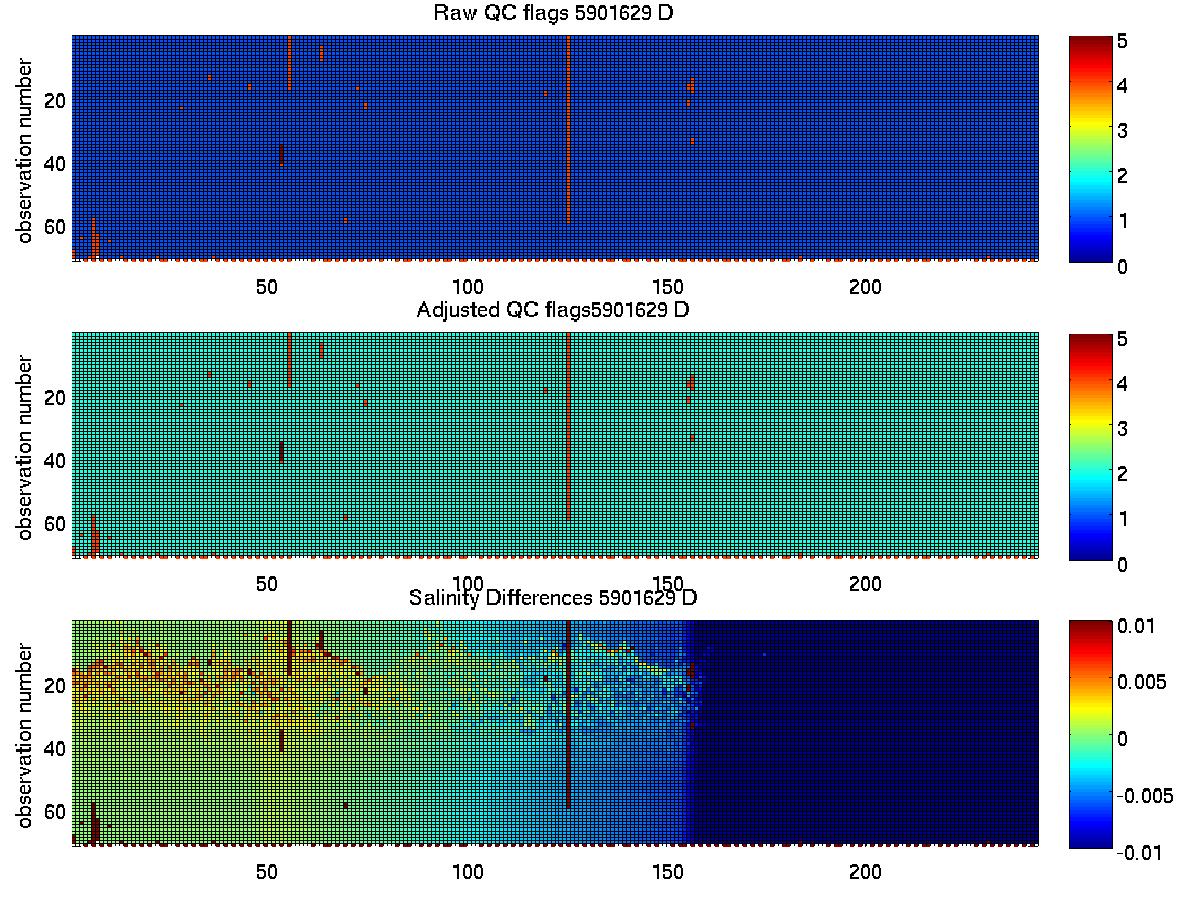
The plot below summarises the QC flags and salinity differences for the raw and adjusted salinity fields in the final delayed mode files submitted to the GDAC.
Created 30-07-2010